Races in Cesar Chavez, Texas (TX) Detailed Stats
Ancestries, Foreign-born residents, place of birth

Recent posts about races in Cesar Chavez, Texas on our local forum with over 2,400,000 registered users:
 | Austin Market has truly gone to **** (736 replies) |
| Are the camps here to stay? (205 replies) |
| CD posters aren't the only ones throwing shade at Austin (64 replies) |
| Any feedback on Avery Ranch? (5 replies) |
| Where are the best breakfast tacos in the Austin region? (49 replies) |
| Possibly Moving to Austin (23 replies) |
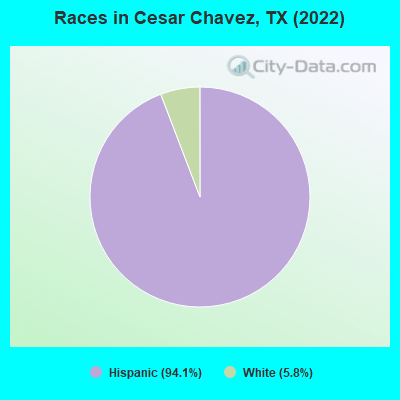
According to 2022 data, the most numerous races in Cesar Chavez, TX are Hispanic (1,739 residents), White alone (107 residents), and Black alone (0 residents). 21.8% of Cesar Chavez residents speak English at home. 28.4% of Cesar Chavez, TX residents are foreign-born (27.9% born in Latin America), which is 40.2% greater than the foreign-born rate of 17.0% across the entire state of Texas.
Race distribution in Cesar Chavez

2000
2022

- 10,933,31352.4%White alone
- 6,669,66632.0%Hispanic
- 2,364,25511.3%Black alone
- 554,4452.7%Asian alone
- 230,5671.1%Two or more races
- 68,8590.3%American Indian alone
- 19,9580.10%Other race alone
- 10,7570.05%Native Hawaiian and Other
Pacific Islander alone

-
- 12,070,64240.2%Hispanic
- 11,683,43038.9%White alone
- 3,508,70611.7%Black alone
- 1,608,1735.4%Asian alone
- 956,5603.2%Two or more races
- 125,7630.4%Other race alone
- 47,0230.2%American Indian alone
- 29,2750.10%Native Hawaiian and Other
Pacific Islander alone

Income and house value in Cesar Chavez
- Median household income in 2022
- $77,483Two or more races householders
- $77,567Hispanic or Latino race householders
- Median 2022 house value
- $-354,239,027White Non-Hispanic householders
- $-869,495,793Some other race householders
- $-1,332,869,066Hispanic or Latino householders
Household income for White non-Hispanic householders

Household income for Two or more races householders

Household income for Hispanic or Latino race householders

Median age by race in Cesar Chavez
- 35.3Median age for White residents
- 41.5Males
- 36.5Females
- -636,150,234.1Median age for Black or African American residents
- -682,648,401.1Males
- -489,388,264.2Females
- -560,747,663.0Median age for American Indian / Alaska Native residents
- -575,645,755.9Males
- -627,650,550.7Females
- -666,666,666.0Median age for Asian residents
- -602,763,384.5Males
- -710,659,897.8Females
- -581,560,283.1Median age for Native Hawaiian / Pacific Islander residents
- -612,729,233.5Males
- -577,777,777.2Females
- -610,800,744.3Median age for Other race residents
- -628,019,323.0Males
- -594,164,455.6Females
- 30.9Median age for Two or more races residents
- 33.3Males
- 30.1Females
- 79.5Median age for White alone residents
- 78.0Males
- 86.1Females
- 32.0Median age for Hispanic or Latino residents
- 31.9Males
- 31.8Females
Owner/renter occupied households by race in Cesar Chavez
- House owners and renters - White residents
- 198100.0%Owner occupied
- House owners and renters - Two or more races residents
- 20670.2%Owner occupied
- 8729.8%Renter occupied
- House owners and renters - White alone residents
- 60100.0%Owner occupied
- House owners and renters - Hispanic or Latino residents
- 44890.1%Owner occupied
- 499.9%Renter occupied
Language usage in Cesar Chavez
- English speakers - Total
- 21.8% of residents of Cesar Chavez speak English at home.
- 78.2% of residents speak Spanish at home
- 88063.2%Speak English very well
- 51236.8%Speak English less than very well
All residents speak only English at home
- English speakers - Foreign-born
- 7.1% of residents of Cesar Chavez speak English at home.
- 92.5% of residents speak Spanish at home
- 10221.2%Speak English very well
- 38078.8%Speak English less than very well
White (Caucasian) - Speak only English
| Native: | 51.2% (268) |
| Foreign-born: | 11.1% (17) |
White (Caucasian) - Speak another language
| Native: | 53.0% (277) |
| Foreign-born: | 79.6% (123) |
Two or more races - Speak another language
| Native: | 96.9% (523) |
| Foreign-born: | 99.3% (333) |
Hispanic or Latino - Speak only English
| Native: | 20.9% (240) |
| Foreign-born: | 7.5% (39) |
Hispanic or Latino - Speak another language
| Native: | 79.1% (912) |
| Foreign-born: | 92.9% (483) |
Foreign-born residents in Cesar Chavez
526 residents are foreign born (27.9% Latin America).
| This city: | 28.4% |
| Texas: | 17.1% |


Marital status for residents in Cesar Chavez
Marital status - White (Caucasian) population 15 years and over
- Males
- 20.9%Never married
- 73.8%Now married
- 0.0%Separated
- 0.0%Widowed
- 5.3%Divorced
- Females
- 26.4%Never married
- 60.1%Now married
- 0.0%Separated
- 0.0%Widowed
- 13.4%Divorced
Women who gave birth in the past 12 months
| Now married: | 100.0% (7) |
| Unmarried: | 0.0% (0) |
Women who did not give birth in the past 12 months
| Now married: | 43.8% (73) |
| Unmarried: | 56.2% (94) |
Marital status - Two or more races population 15 years and over
- Males
- 52.5%Never married
- 47.5%Now married
- 0.0%Separated
- 0.0%Widowed
- 0.0%Divorced
- Females
- 12.0%Never married
- 78.9%Now married
- 0.0%Separated
- 9.0%Widowed
- 0.0%Divorced
Women who did not give birth in the past 12 months
| Now married: | 86.8% (239) |
| Unmarried: | 13.2% (37) |
Marital status - White alone, not Hispanic / Latino population 15 years and over
- Males
- 0.0%Never married
- 100.0%Now married
- 0.0%Separated
- 0.0%Widowed
- 0.0%Divorced
- Females
- 0.0%Never married
- 100.0%Now married
- 0.0%Separated
- 0.0%Widowed
- 0.0%Divorced
Marital status - Hispanic or Latino population 15 years and over
- Males
- 35.2%Never married
- 61.1%Now married
- 0.0%Separated
- 0.0%Widowed
- 3.7%Divorced
- Females
- 25.1%Never married
- 61.4%Now married
- 0.0%Separated
- 2.3%Widowed
- 11.2%Divorced
Women who gave birth in the past 12 months
| Now married: | 100.0% (16) |
| Unmarried: | 0.0% (0) |
Women who did not give birth in the past 12 months
| Now married: | 56.0% (304) |
| Unmarried: | 44.0% (239) |
Ancestries in Cesar Chavez

- 211.3%German
- 191.1%American

Geographical mobility in Cesar Chavez

- Same house 1 year ago
- 58096.5%White (Caucasian)
- 99098.4%Two or more races
- 109100.0%White alone, not Hispanic / Latino
- 1,70698.1%Hispanic or Latino

Children Nativity (place of birth) in Cesar Chavez
Place of birth for residents in Cesar Chavez
![Place of birth for the foreign-born population - Regions]()
- 526Americas
- 526Latin America
- 526Central America

Grandparents responsible for own grandchildren in Cesar Chavez
Zip codes: 78542.