Races in Clarksville, Indiana (IN) Detailed Stats
Data:
Races - White alone (%)
Races - White alone (% change since 2000)
Races - Black alone (%)
Races - Black alone (% change since 2000)
Races - American Indian alone (%)
Races - American Indian alone (% change since 2000)
Races - Asian alone (%)
Races - Asian alone (% change since 2000)
Races - Hispanic (%)
Races - Hispanic (% change since 2000)
Races - Native Hawaiian and Other Pacific Islander alone (%)
Races - Native Hawaiian and Other Pacific Islander alone (% change since 2000)
Races - Two or more races(%)
Races - Two or more races(% change since 2000)
Races - Other race alone (%)
Races - Other race alone (% change since 2000)
Racial diversity
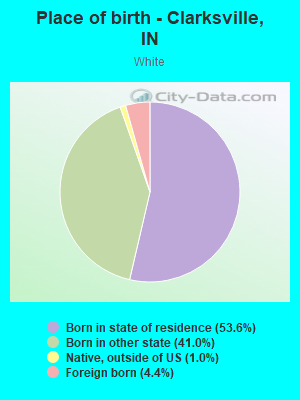
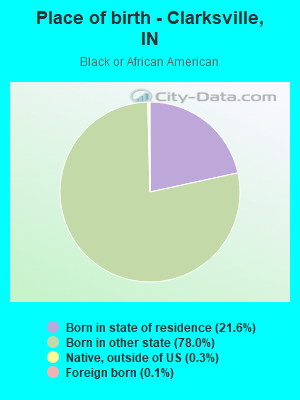
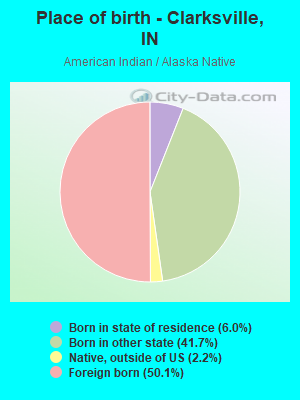
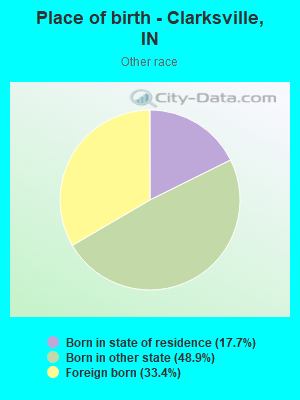
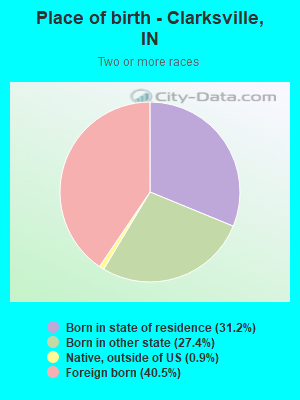
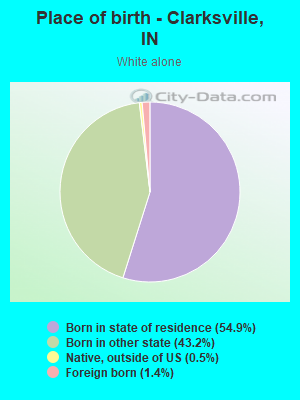
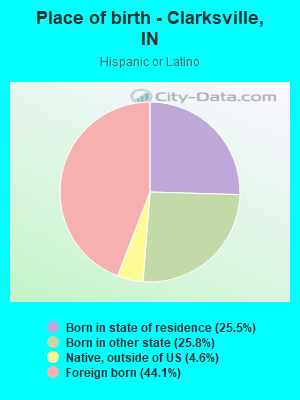
Place of birth - Born in state of residence (%)
Place of birth - Born in state of residence (%) - White
Place of birth - Born in state of residence (%) - Black or African American
Place of birth - Born in state of residence (%) - Asian
Place of birth - Born in state of residence (%) - Hispanic or Latino
Place of birth - Born in state of residence (%) - American Indian and Alaska Native
Place of birth - Born in state of residence (%) - Multirace
Place of birth - Born in state of residence (%) - Other Race
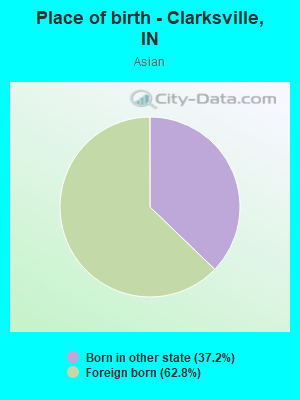
Place of birth - Born in other state (%)
Place of birth - Born in other state (%) - White
Place of birth - Born in other state (%) - Black or African American
Place of birth - Born in other state (%) - Asian
Place of birth - Born in other state (%) - Hispanic or Latino
Place of birth - Born in other state (%) - American Indian and Alaska Native
Place of birth - Born in other state (%) - Multirace
Place of birth - Born in other state (%) - Other Race
Place of birth - Native, outside of US (%)
Place of birth - Native, outside of US (%) - White
Place of birth - Native, outside of US (%) - Black or African American
Place of birth - Native, outside of US (%) - Asian
Place of birth - Native, outside of US (%) - Hispanic or Latino
Place of birth - Native, outside of US (%) - American Indian and Alaska Native
Place of birth - Native, outside of US (%) - Multirace
Place of birth - Native, outside of US (%) - Other Race
Place of birth - Foreign born (%)
Place of birth - Foreign born (%) - White
Place of birth - Foreign born (%) - Black or African American
Place of birth - Foreign born (%) - Asian
Place of birth - Foreign born (%) - Hispanic or Latino
Place of birth - Foreign born (%) - American Indian and Alaska Native
Place of birth - Foreign born (%) - Multirace
Place of birth - Foreign born (%) - Other Race
Residents speaking English at home (%)
Residents speaking English at home - Born in the United States (%)
Residents speaking English at home - Native, born elsewhere (%)
Residents speaking English at home - Foreign born (%)
Residents speaking Spanish at home (%)
Residents speaking Spanish at home - Born in the United States (%)
Residents speaking Spanish at home - Native, born elsewhere (%)
Residents speaking Spanish at home - Foreign born (%)
Residents speaking other language at home (%)
Residents speaking other language at home - Born in the United States (%)
Residents speaking other language at home - Native, born elsewhere (%)
Residents speaking other language at home - Foreign born (%)
Marital status - Never married (%)
Marital status - Now married (%)
Marital status - Separated (%)
Marital status - Widowed (%)
Marital status - Divorced (%)
Ancestries Reported - Arab (%)
Ancestries Reported - Czech (%)
Ancestries Reported - Danish (%)
Ancestries Reported - Dutch (%)
Ancestries Reported - English (%)
Ancestries Reported - French (%)
Ancestries Reported - French Canadian (%)
Ancestries Reported - German (%)
Ancestries Reported - Greek (%)
Ancestries Reported - Hungarian (%)
Ancestries Reported - Irish (%)
Ancestries Reported - Italian (%)
Ancestries Reported - Lithuanian (%)
Ancestries Reported - Norwegian (%)
Ancestries Reported - Polish (%)
Ancestries Reported - Portuguese (%)
Ancestries Reported - Russian (%)
Ancestries Reported - Scotch-Irish (%)
Ancestries Reported - Scottish (%)
Ancestries Reported - Slovak (%)
Ancestries Reported - Subsaharan African (%)
Ancestries Reported - Swedish (%)
Ancestries Reported - Swiss (%)
Ancestries Reported - Ukrainian (%)
Ancestries Reported - United States (%)
Ancestries Reported - Welsh (%)
Ancestries Reported - West Indian (%)
Ancestries Reported - Other (%)
Geographical mobility - Same house 1 year ago (%)
Geographical mobility - Same house 1 year ago (%) - White
Geographical mobility - Same house 1 year ago (%) - Black or African American
Geographical mobility - Same house 1 year ago (%) - Asian
Geographical mobility - Same house 1 year ago (%) - Hispanic or Latino
Geographical mobility - Same house 1 year ago (%) - American Indian and Alaska Native
Geographical mobility - Same house 1 year ago (%) - Multirace
Geographical mobility - Same house 1 year ago (%) - Other Race
Geographical mobility - Moved within same county (%)
Geographical mobility - Moved within same county (%) - White
Geographical mobility - Moved within same county (%) - Black or African American
Geographical mobility - Moved within same county (%) - Asian
Geographical mobility - Moved within same county (%) - Hispanic or Latino
Geographical mobility - Moved within same county (%) - American Indian and Alaska Native
Geographical mobility - Moved within same county (%) - Multirace
Geographical mobility - Moved within same county (%) - Other Race
Geographical mobility - Moved from different county within same state (%)
Geographical mobility - Moved from different county within same state (%) - White
Geographical mobility - Moved from different county within same state (%) - Black or African American
Geographical mobility - Moved from different county within same state (%) - Asian
Geographical mobility - Moved from different county within same state (%) - Hispanic or Latino
Geographical mobility - Moved from different county within same state (%) - American Indian and Alaska Native
Geographical mobility - Moved from different county within same state (%) - Multirace
Geographical mobility - Moved from different county within same state (%) - Other Race
Geographical mobility - Moved from different state (%)
Geographical mobility - Moved from different state (%) - White
Geographical mobility - Moved from different state (%) - Black or African American
Geographical mobility - Moved from different state (%) - Asian
Geographical mobility - Moved from different state (%) - Hispanic or Latino
Geographical mobility - Moved from different state (%) - American Indian and Alaska Native
Geographical mobility - Moved from different state (%) - Multirace
Geographical mobility - Moved from different state (%) - Other Race
Geographical mobility - Moved from abroad (%)
Geographical mobility - Moved from abroad (%) - White
Geographical mobility - Moved from abroad (%) - Black or African American
Geographical mobility - Moved from abroad (%) - Asian
Geographical mobility - Moved from abroad (%) - Hispanic or Latino
Geographical mobility - Moved from abroad (%) - American Indian and Alaska Native
Geographical mobility - Moved from abroad (%) - Multirace
Geographical mobility - Moved from abroad (%) - Other Race
Place of birth for the foreign-born population - Ireland (%)
Place of birth for the foreign-born population - Denmark (%)
Place of birth for the foreign-born population - Norway (%)
Place of birth for the foreign-born population - Sweden (%)
Place of birth for the foreign-born population - United Kingdom (%)
Place of birth for the foreign-born population - England (%)
Place of birth for the foreign-born population - Scotland (%)
Place of birth for the foreign-born population - Other Northern Europe (%)
Place of birth for the foreign-born population - Austria (%)
Place of birth for the foreign-born population - Belgium (%)
Place of birth for the foreign-born population - France (%)
Place of birth for the foreign-born population - Germany (%)
Place of birth for the foreign-born population - Netherlands (%)
Place of birth for the foreign-born population - Switzerland (%)
Place of birth for the foreign-born population - Other Western Europe (%)
Place of birth for the foreign-born population - Greece (%)
Place of birth for the foreign-born population - Italy (%)
Place of birth for the foreign-born population - Portugal (%)
Place of birth for the foreign-born population - Spain (%)
Place of birth for the foreign-born population - Other Southern Europe (%)
Place of birth for the foreign-born population - Albania (%)
Place of birth for the foreign-born population - Belarus (%)
Place of birth for the foreign-born population - Bosnia and Herzegovina (%)
Place of birth for the foreign-born population - Bulgaria (%)
Place of birth for the foreign-born population - Croatia (%)
Place of birth for the foreign-born population - Czechoslovakia (%)
Place of birth for the foreign-born population - Hungary (%)
Place of birth for the foreign-born population - Latvia (%)
Place of birth for the foreign-born population - Lithuania (%)
Place of birth for the foreign-born population - North Macedonia (Macedonia) (%)
Place of birth for the foreign-born population - Moldova (%)
Place of birth for the foreign-born population - Poland (%)
Place of birth for the foreign-born population - Romania (%)
Place of birth for the foreign-born population - Russia (%)
Place of birth for the foreign-born population - Serbia (%)
Place of birth for the foreign-born population - Ukraine (%)
Place of birth for the foreign-born population - Other Eastern Europe (%)
Place of birth for the foreign-born population - China (%)
Place of birth for the foreign-born population - Hong Kong (%)
Place of birth for the foreign-born population - Taiwan (%)
Place of birth for the foreign-born population - Japan (%)
Place of birth for the foreign-born population - Korea (%)
Place of birth for the foreign-born population - Other Eastern Asia (%)
Place of birth for the foreign-born population - Afghanistan (%)
Place of birth for the foreign-born population - Bangladesh (%)
Place of birth for the foreign-born population - India (%)
Place of birth for the foreign-born population - Iran (%)
Place of birth for the foreign-born population - Kazakhstan (%)
Place of birth for the foreign-born population - Nepal (%)
Place of birth for the foreign-born population - Pakistan (%)
Place of birth for the foreign-born population - Sri Lanka (%)
Place of birth for the foreign-born population - Uzbekistan (%)
Place of birth for the foreign-born population - Other South Central Asia (%)
Place of birth for the foreign-born population - Burma (%)
Place of birth for the foreign-born population - Cambodia (%)
Place of birth for the foreign-born population - Indonesia (%)
Place of birth for the foreign-born population - Laos (%)
Place of birth for the foreign-born population - Malaysia (%)
Place of birth for the foreign-born population - Philippines (%)
Place of birth for the foreign-born population - Singapore (%)
Place of birth for the foreign-born population - Thailand (%)
Place of birth for the foreign-born population - Vietnam (%)
Place of birth for the foreign-born population - Other South Eastern Asia (%)
Place of birth for the foreign-born population - Armenia (%)
Place of birth for the foreign-born population - Iraq (%)
Place of birth for the foreign-born population - Israel (%)
Place of birth for the foreign-born population - Jordan (%)
Place of birth for the foreign-born population - Kuwait (%)
Place of birth for the foreign-born population - Lebanon (%)
Place of birth for the foreign-born population - Saudi Arabia (%)
Place of birth for the foreign-born population - Syria (%)
Place of birth for the foreign-born population - Turkey (%)
Place of birth for the foreign-born population - Yemen (%)
Place of birth for the foreign-born population - Other Western Asia (%)
Place of birth for the foreign-born population - Eritrea (%)
Place of birth for the foreign-born population - Ethiopia (%)
Place of birth for the foreign-born population - Kenya (%)
Place of birth for the foreign-born population - Somalia (%)
Place of birth for the foreign-born population - Uganda (%)
Place of birth for the foreign-born population - Zimbabwe (%)
Place of birth for the foreign-born population - Other Eastern Africa (%)
Place of birth for the foreign-born population - Cameroon (%)
Place of birth for the foreign-born population - Congo (%)
Place of birth for the foreign-born population - Democratic Republic of Congo (Zaire) (%)
Place of birth for the foreign-born population - Other Middle Africa (%)
Place of birth for the foreign-born population - Egypt (%)
Place of birth for the foreign-born population - Morocco (%)
Place of birth for the foreign-born population - Sudan (%)
Place of birth for the foreign-born population - Other Northern Africa (%)
Place of birth for the foreign-born population - South Africa (%)
Place of birth for the foreign-born population - Other Southern Africa (%)
Place of birth for the foreign-born population - Cabo Verde (%)
Place of birth for the foreign-born population - Ghana (%)
Place of birth for the foreign-born population - Liberia (%)
Place of birth for the foreign-born population - Nigeria (%)
Place of birth for the foreign-born population - Senegal (%)
Place of birth for the foreign-born population - Sierra Leone (%)
Place of birth for the foreign-born population - Other Western Africa (%)
Place of birth for the foreign-born population - Australia (%)
Place of birth for the foreign-born population - New Zealand (%)
Place of birth for the foreign-born population - Fiji (%)
Place of birth for the foreign-born population - Micronesia (%)
Place of birth for the foreign-born population - Bahamas (%)
Place of birth for the foreign-born population - Barbados (%)
Place of birth for the foreign-born population - Cuba (%)
Place of birth for the foreign-born population - Dominica (%)
Place of birth for the foreign-born population - Dominican Republic (%)
Place of birth for the foreign-born population - Grenada (%)
Place of birth for the foreign-born population - Haiti (%)
Place of birth for the foreign-born population - Jamaica (%)
Place of birth for the foreign-born population - St. Vincent and the Grenadines (%)
Place of birth for the foreign-born population - Trinidad and Tobago (%)
Place of birth for the foreign-born population - West Indies (%)
Place of birth for the foreign-born population - Other Caribbean (%)
Place of birth for the foreign-born population - Belize (%)
Place of birth for the foreign-born population - Costa Rica (%)
Place of birth for the foreign-born population - El Salvador (%)
Place of birth for the foreign-born population - Guatemala (%)
Place of birth for the foreign-born population - Honduras (%)
Place of birth for the foreign-born population - Mexico (%)
Place of birth for the foreign-born population - Nicaragua (%)
Place of birth for the foreign-born population - Panama (%)
Place of birth for the foreign-born population - Other Central America (%)
Place of birth for the foreign-born population - Argentina (%)
Place of birth for the foreign-born population - Bolivia (%)
Place of birth for the foreign-born population - Brazil (%)
Place of birth for the foreign-born population - Chile (%)
Place of birth for the foreign-born population - Colombia (%)
Place of birth for the foreign-born population - Ecuador (%)
Place of birth for the foreign-born population - Guyana (%)
Place of birth for the foreign-born population - Peru (%)
Place of birth for the foreign-born population - Uruguay (%)
Place of birth for the foreign-born population - Venezuela (%)
Place of birth for the foreign-born population - Other South America (%)
Place of birth for the foreign-born population - Canada (%)
Place of birth for the foreign-born population - Other Northern America (%)
Place of birth for the foreign-born population - Other (%)
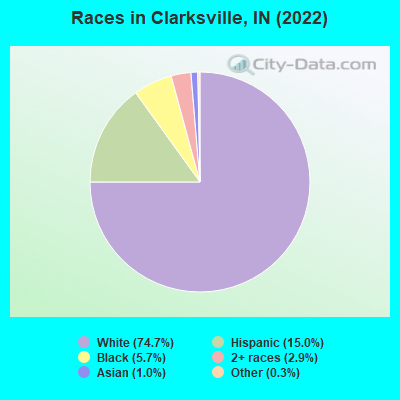
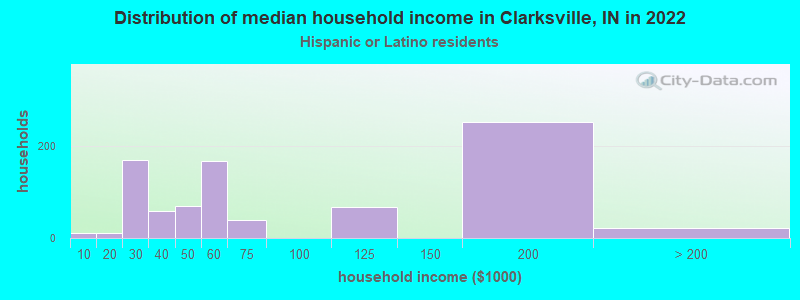
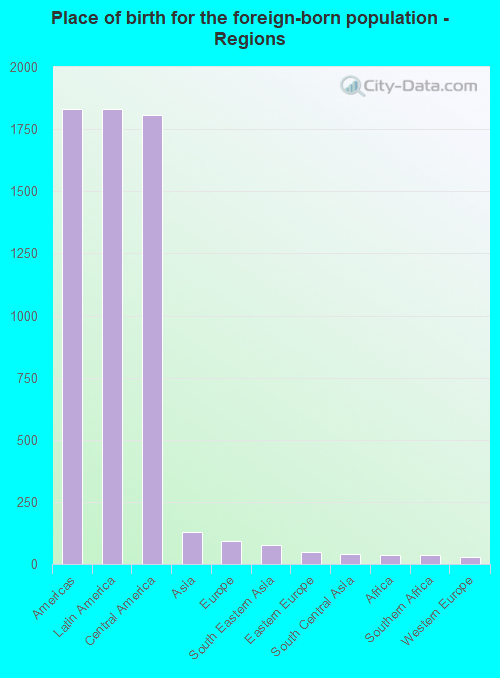
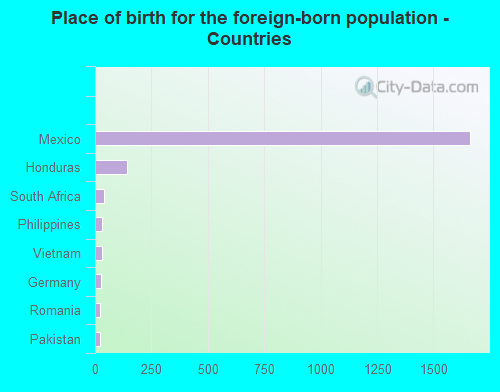
According to 2022 data, the most numerous races in Clarksville, IN are White alone (16,872 residents), Black alone (1,285 residents), and Hispanic (3,397 residents). 85.8% of Clarksville residents speak English at home. 9.3% of Clarksville, IN residents are foreign-born (7.6% born in Latin America), which is 35.2% greater than the foreign-born rate of 6.0% across the entire state of Indiana.
Race distribution in Clarksville
2000 2022
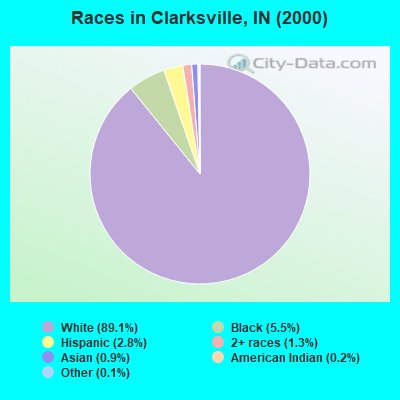
5,219,373 85.8% White alone 505,462 8.3% Black alone 214,536 3.5% Hispanic 61,115 1.0% Two or more races 58,424 1.0% Asian alone 13,654 0.2% American Indian alone 6,348 0.1% Other race alone 1,573 0.03% Native Hawaiian and Other
5,192,455 76.0% White alone 628,054 9.2% Black alone 534,528 7.8% Hispanic 263,242 3.9% Two or more races 172,880 2.5% Asian alone 33,467 0.5% Other race alone 5,866 0.09% American Indian alone 2,545 0.04% Native Hawaiian and Other
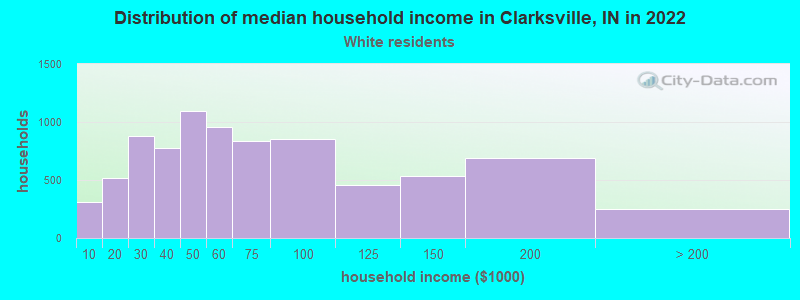
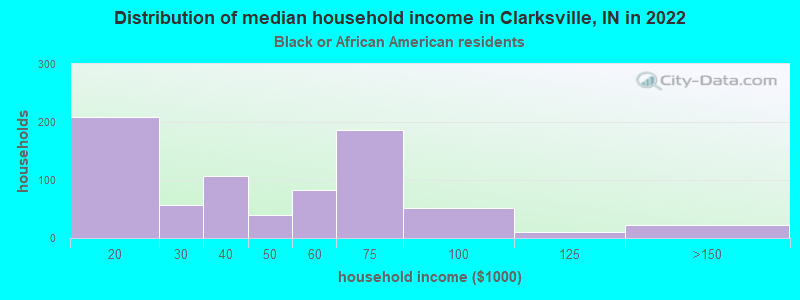
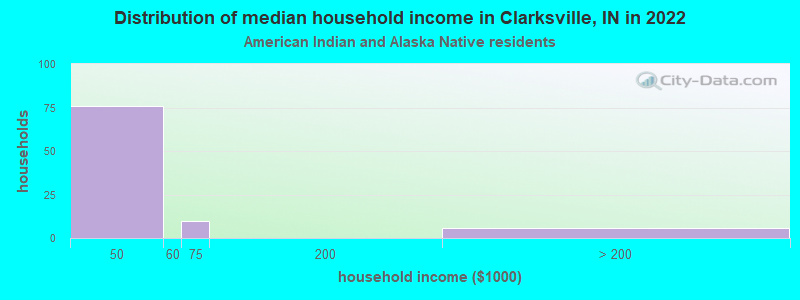
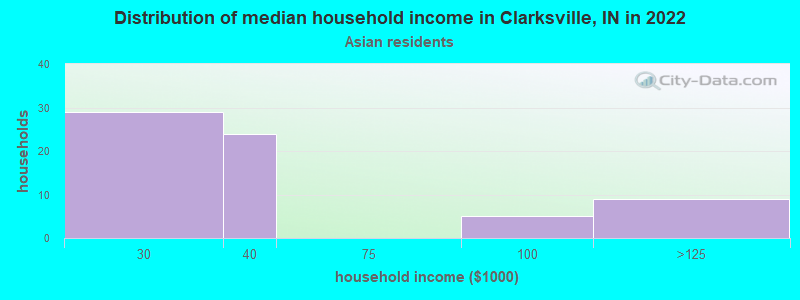
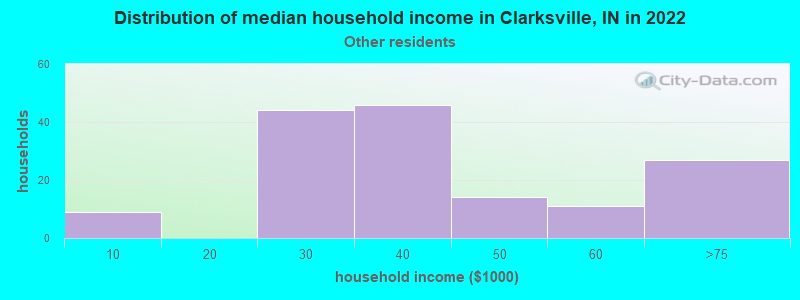
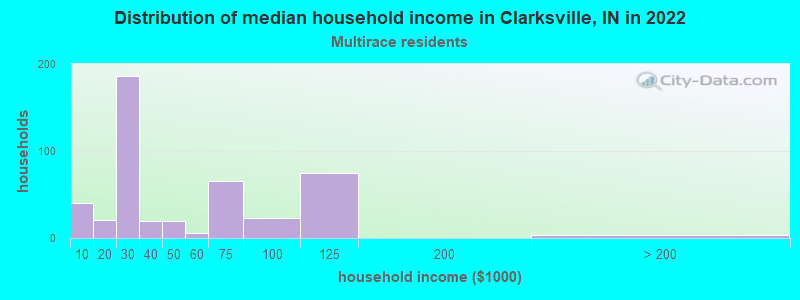
Income and house value in Clarksville Median household income in 2022 $52,908 White non-Hispanic householders$59,003 Black householders$47,602 American Indian and Alaska Native householders$31,210 Some other race householders$40,409 Hispanic or Latino race householdersMedian 2022 house value $191,342 White Non-Hispanic householders$153,627 Black or African American householders $292,979 Asian householders$131,894 Some other race householders$161,298 Two or more races householders$145,104 Hispanic or Latino householders
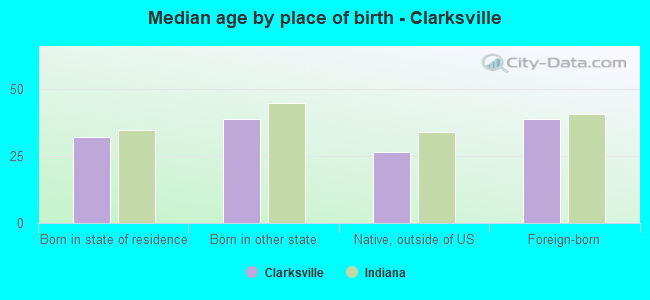
Median age by race in Clarksville
41.0 Median age for White residents37.1 43.2 34.6 Median age for Black or African American residents25.2 48.2 19.1 Median age for American Indian / Alaska Native residents22.1 17.3 53.4 Median age for Asian residents-662,813,101.5 41.7 -666,666,666.0 Median age for Native Hawaiian / Pacific Islander residents-666,666,666.0 -666,666,666.0 29.0 Median age for Other race residents31.4 15.5 25.5 Median age for Two or more races residents24.1 24.2 40.8 Median age for White alone residents36.4 44.3 23.0 Median age for Hispanic or Latino residents23.1 22.9
Owner/renter occupied households by race in Clarksville
House owners and renters - White residents 5,386 67.0% Owner occupied2,647 33.0% Renter occupiedHouse owners and renters - Black or African American residents 226 38.6% Owner occupied360 61.4% Renter occupiedHouse owners and renters - American Indian / Alaska Native residents 24 27.6% Owner occupied63 72.4% Renter occupiedHouse owners and renters - Asian residents 35 51.1% Owner occupied34 48.9% Renter occupiedHouse owners and renters - Other race residents 34 16.5% Owner occupied173 83.5% Renter occupiedHouse owners and renters - Two or more races residents 148 25.4% Owner occupied436 74.6% Renter occupiedHouse owners and renters - White alone residents 5,044 66.0% Owner occupied2,603 34.0% Renter occupiedHouse owners and renters - Hispanic or Latino residents 295 30.8% Owner occupied665 69.2% Renter occupied
Language usage in Clarksville
English speakers - Total 85.8% of residents of Clarksville speak English at home.
11.8% of residents speak Spanish at home 902 35.8% Speak English very well1,617 64.2% Speak English less than very well2.0% of residents speak other language at home 224 53.0% Speak English very well199 47.0% Speak English less than very well
English speakers - Born in the United States 94.8% of residents of Clarksville speak English at home.
4.2% of residents speak Spanish at home 325 85.1% Speak English very well57 14.9% Speak English less than very well1.2% of residents speak other language at home 112 100.0% Speak English very well
English speakers - Native, born elsewhere 44.4% of residents of Clarksville speak English at home.
34.8% of residents speak Spanish at home 72 100.0% Speak English very well17.9% of residents speak other language at home 11 29.7% Speak English very well26 70.3% Speak English less than very well
English speakers - Foreign-born 6.6% of residents of Clarksville speak English at home.
67.3% of residents speak Spanish at home 323 22.5% Speak English very well1,115 77.5% Speak English less than very well10.6% of residents speak other language at home 79 35.0% Speak English very well147 65.0% Speak English less than very well
White (Caucasian) - Speak only English Native:
96.2% (15,777)Foreign-born:
15.8% (126)
White (Caucasian) - Speak another language Native:
3.1% (503)Foreign-born:
59.7% (475)
Black or African American - Speak only English Native:
98.2% (1,397)Foreign-born:
68.2% (3)
American Indian / Alaska Native - Speak another language Native:
100.0% (214)Foreign-born:
100.0% (218)
Asian - Speak another language Native:
100.0% (58)Foreign-born:
72.2% (76)
Other race - Speak another language Native:
58.4% (105)Foreign-born:
97.7% (323)
Two or more races - Speak another language Native:
16.9% (151)Foreign-born:
100.0% (725)
White alone - Speak only English Native:
99.2% (15,641)Foreign-born:
56.2% (131)
White alone - Speak another language Native:
0.6% (100)Foreign-born:
20.0% (47)
Hispanic or Latino - Speak another language Native:
59.1% (944)Foreign-born:
100.0% (1,336)
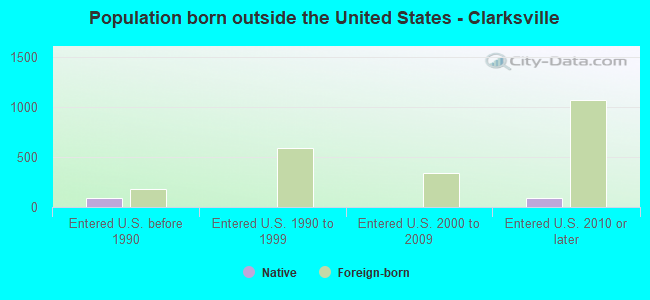
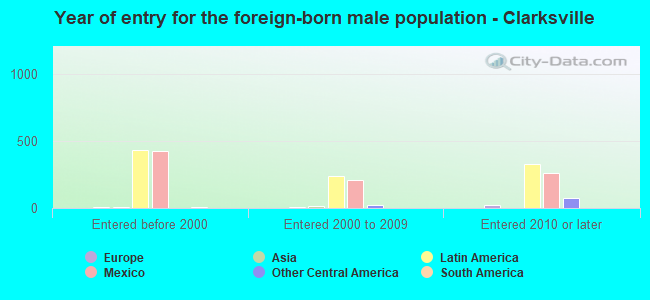
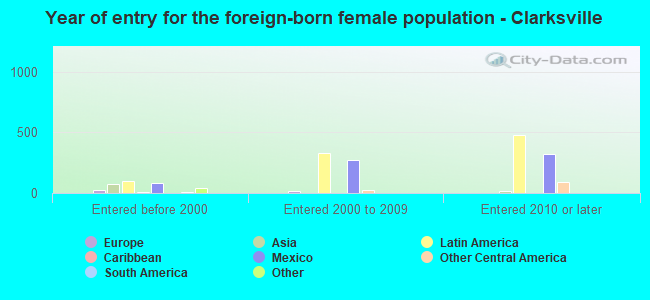
Foreign-born residents in Clarksville 2,090 residents are foreign born (7.6% Latin America ).
This city:
9.3%Indiana:
5.6%
Marital status for residents in Clarksville Marital status - White (Caucasian) population 15 years and over
Males 45.9% Never married37.1% Now married0.6% Separated2.7% Widowed13.6% DivorcedFemales 31.1% Never married37.1% Now married3.5% Separated11.0% Widowed17.2% DivorcedWomen who gave birth in the past 12 months Now married:
22.6% (70)Unmarried:
77.4% (240)
Women who did not give birth in the past 12 months Now married:
39.5% (1,536)Unmarried:
60.5% (2,353)
Marital status - Black or African American population 15 years and over
Males 61.7% Never married20.0% Now married1.4% Separated1.0% Widowed15.9% DivorcedFemales 44.6% Never married5.3% Now married5.0% Separated14.1% Widowed31.1% DivorcedWomen who did not give birth in the past 12 months Now married:
11.1% (42)Unmarried:
88.9% (337)
Marital status - American Indian / Alaska Native population 15 years and over
Males 87.5% Never married12.5% Now married0.0% Separated0.0% Widowed0.0% DivorcedFemales 62.8% Never married11.5% Now married25.6% Separated0.0% Widowed0.0% DivorcedWomen who did not give birth in the past 12 months Now married:
37.2% (137)Unmarried:
62.8% (231)
Marital status - Asian population 15 years and over
Males 0.0% Never married100.0% Now married0.0% Separated0.0% Widowed0.0% DivorcedFemales 16.0% Never married12.0% Now married0.0% Separated6.4% Widowed65.6% DivorcedWomen who did not give birth in the past 12 months Now married:
0.0% (0)Unmarried:
100.0% (79)
Marital status - Other race population 15 years and over
Males 68.6% Never married31.4% Now married0.0% Separated0.0% Widowed0.0% DivorcedFemales 60.4% Never married39.6% Now married0.0% Separated0.0% Widowed0.0% DivorcedWomen who gave birth in the past 12 months Now married:
0.0% (0)Unmarried:
100.0% (7)
Women who did not give birth in the past 12 months Now married:
25.7% (35)Unmarried:
74.3% (102)
Marital status - Two or more races population 15 years and over
Males 28.0% Never married58.6% Now married0.0% Separated3.4% Widowed10.0% DivorcedFemales 42.1% Never married44.4% Now married3.0% Separated4.2% Widowed6.3% DivorcedWomen who gave birth in the past 12 months Now married:
0.0% (0)Unmarried:
100.0% (25)
Women who did not give birth in the past 12 months Now married:
53.4% (248)Unmarried:
46.6% (216)
Marital status - White alone, not Hispanic / Latino population 15 years and over
Males 43.4% Never married38.6% Now married0.7% Separated3.0% Widowed14.3% DivorcedFemales 29.4% Never married36.5% Now married3.8% Separated11.8% Widowed18.5% DivorcedWomen who gave birth in the past 12 months Now married:
22.6% (72)Unmarried:
77.4% (245)
Women who did not give birth in the past 12 months Now married:
40.7% (1,446)Unmarried:
59.3% (2,104)
Marital status - Hispanic or Latino population 15 years and over
Males 63.0% Never married32.5% Now married0.0% Separated0.0% Widowed4.5% DivorcedFemales 50.3% Never married44.4% Now married3.8% Separated1.4% Widowed0.0% DivorcedWomen who gave birth in the past 12 months Now married:
0.0% (0)Unmarried:
100.0% (20)
Women who did not give birth in the past 12 months Now married:
40.6% (370)Unmarried:
59.4% (541)
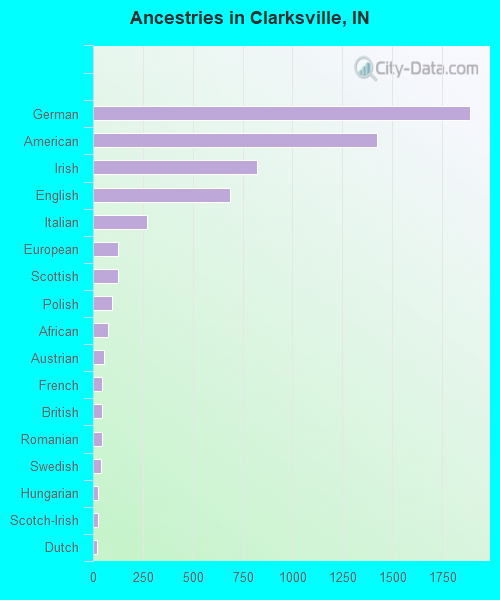
Ancestries in Clarksville
1,891 17.6% German1,423 13.2% American823 7.6% Irish687 6.4% English272 2.5% Italian126 1.2% European124 1.2% Scottish95 0.9% Polish74 0.7% African56 0.5% Austrian46 0.4% French45 0.4% British45 0.4% Romanian40 0.4% Swedish26 0.2% Hungarian23 0.2% Scotch-Irish21 0.2% Dutch14 0.1% Ukrainian14 0.1% Dutch West Indian13 0.1% Iranian13 0.1% Norwegian8 0.07% Northern European7 0.07% Russian6 0.06% Czech6 0.06% Finnish6 0.06% Welsh
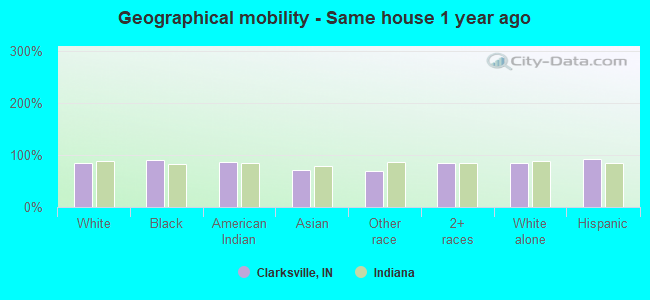
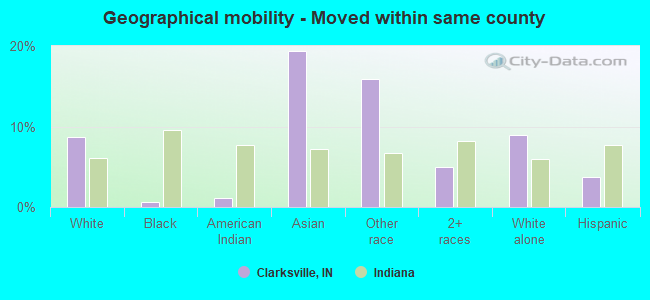
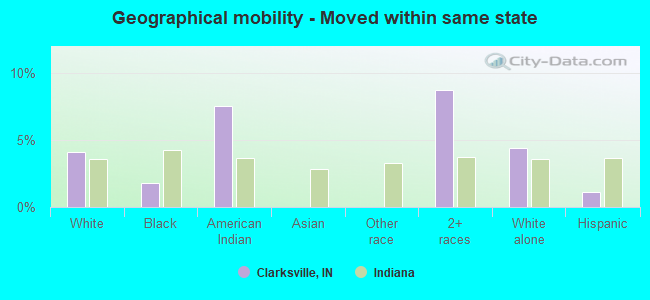
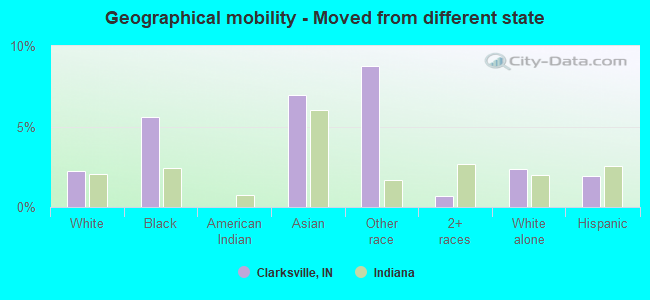
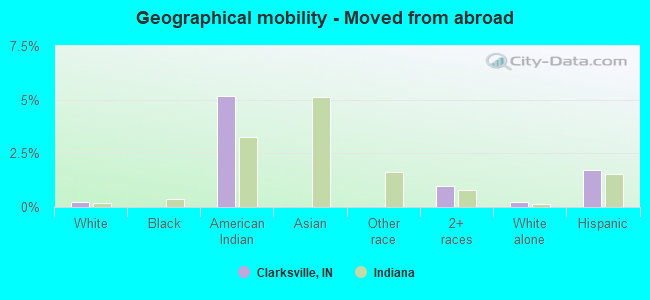
Geographical mobility in Clarksville Same house 1 year ago 15,346 85.2% White (Caucasian)1,306 90.9% Black or African American442 86.6% American Indian / Alaska Native117 72.3% Asian379 70.3% Other race1,341 84.3% Two or more races14,084 84.7% White alone, not Hispanic / Latino2,925 92.0% Hispanic or LatinoMoved within same county 1,573 8.7% White / Caucasian10 0.7% Black or African American6 1.2% American Indian / Alaska Native31 19.3% Asian85 15.8% Other race79 5.0% Two or more races1,494 9.0% White alone, not Hispanic / Latino119 3.7% Hispanic or LatinoMoved within same state 736 4.1% White / Caucasian26 1.8% Black or African American38 7.5% American Indian / Alaska Native138 8.7% Two or more races734 4.4% White alone, not Hispanic / Latino36 1.1% Hispanic or LatinoMoved from different state 400 2.2% White / Caucasian80 5.6% Black or African American11 6.9% Asian47 8.8% Other race11 0.7% Two or more races396 2.4% White alone, not Hispanic / Latino60 1.9% Hispanic or LatinoMoved from abroad 39 0.2% White26 5.2% American Indian / Alaska Native16 1.0% Two or more races36 0.2% White alone, not Hispanic / Latino54 1.7% Hispanic or Latino
Children Nativity (place of birth) in Clarksville
Children under 6 years - Living with two parents Both parents native 624 100.0% NativeBoth parents foreign-born 161 100.0% NativeOne native, one foreign-born parent 84 100.0% NativeChildren under 6 years - Living with one parent Native parent 455 100.0% NativeForeign-born parent 76 91.2% Native7 8.8% Foreign-bornChildren 6 to 17 years - Living with two parents Both parents native 1,139 100.0% NativeBoth parents foreign-born 266 79.2% Native70 20.8% Foreign-bornOne native, one foreign-born parent 44 100.0% NativeChildren 6 to 17 years - Living with one parent Native parent 1,122 100.0% NativeForeign-born parent 307 53.6% Native265 46.4% Foreign-born
Grandparents responsible for own grandchildren in Clarksville
Grandparents (30 to 59 years) White / Caucasian 147 62.7% Responsible for grandchildren87 37.3% Not responsible for grandchildrenBlack or African American 18 100.0% Not responsible for grandchildrenOther race 9 100.0% Not responsible for grandchildrenWhite alone, not Hispanic / Latino 147 62.7% Responsible for grandchildren87 37.3% Not responsible for grandchildrenHispanic or Latino 6 100.0% Not responsible for grandchildrenGrandparents (60 years and over) White / Caucasian 32 13.7% Responsible for grandchildren204 86.3% Not responsible for grandchildrenOther race 15 100.0% Not responsible for grandchildrenWhite alone, not Hispanic / Latino 32 13.7% Responsible for grandchildren204 86.3% Not responsible for grandchildrenHispanic or Latino 14 100.0% Not responsible for grandchildren