Races in Cleveland Heights, Ohio (OH) Detailed Stats
Data:
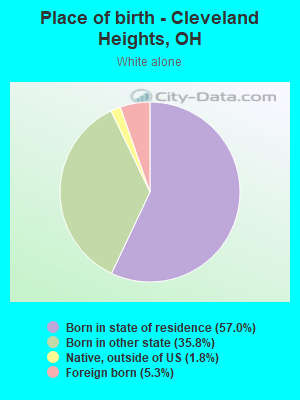
Races - White alone (%)
Races - White alone (% change since 2000)
Races - Black alone (%)
Races - Black alone (% change since 2000)
Races - American Indian alone (%)
Races - American Indian alone (% change since 2000)
Races - Asian alone (%)
Races - Asian alone (% change since 2000)
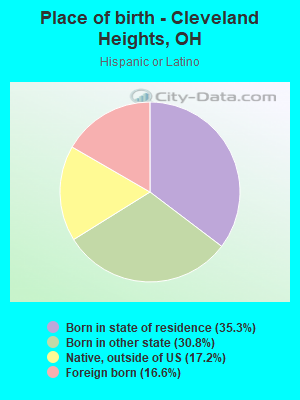
Races - Hispanic (%)
Races - Hispanic (% change since 2000)
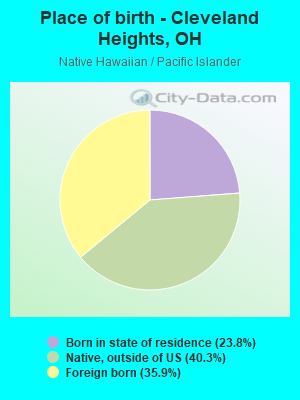
Races - Native Hawaiian and Other Pacific Islander alone (%)
Races - Native Hawaiian and Other Pacific Islander alone (% change since 2000)
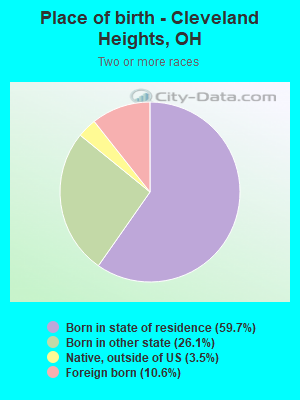
Races - Two or more races(%)
Races - Two or more races(% change since 2000)
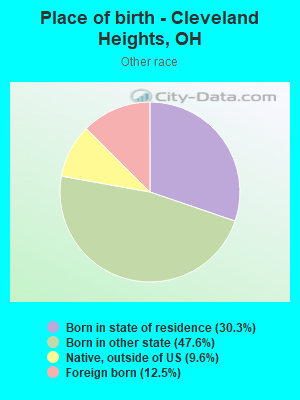
Races - Other race alone (%)
Races - Other race alone (% change since 2000)
Racial diversity
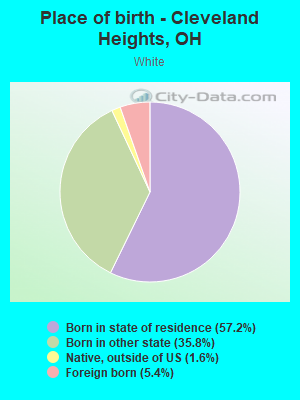
Place of birth - Born in state of residence (%)
Place of birth - Born in state of residence (%) - White
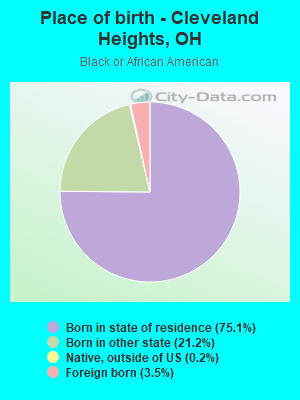
Place of birth - Born in state of residence (%) - Black or African American
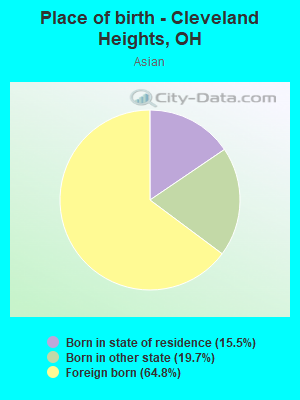
Place of birth - Born in state of residence (%) - Asian
Place of birth - Born in state of residence (%) - Hispanic or Latino
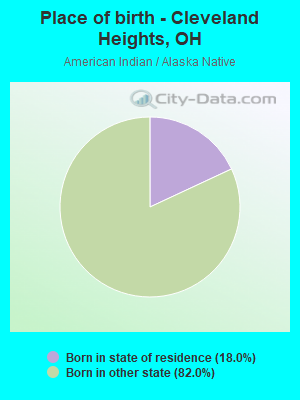
Place of birth - Born in state of residence (%) - American Indian and Alaska Native
Place of birth - Born in state of residence (%) - Multirace
Place of birth - Born in state of residence (%) - Other Race
Place of birth - Born in other state (%)
Place of birth - Born in other state (%) - White
Place of birth - Born in other state (%) - Black or African American
Place of birth - Born in other state (%) - Asian
Place of birth - Born in other state (%) - Hispanic or Latino
Place of birth - Born in other state (%) - American Indian and Alaska Native
Place of birth - Born in other state (%) - Multirace
Place of birth - Born in other state (%) - Other Race
Place of birth - Native, outside of US (%)
Place of birth - Native, outside of US (%) - White
Place of birth - Native, outside of US (%) - Black or African American
Place of birth - Native, outside of US (%) - Asian
Place of birth - Native, outside of US (%) - Hispanic or Latino
Place of birth - Native, outside of US (%) - American Indian and Alaska Native
Place of birth - Native, outside of US (%) - Multirace
Place of birth - Native, outside of US (%) - Other Race
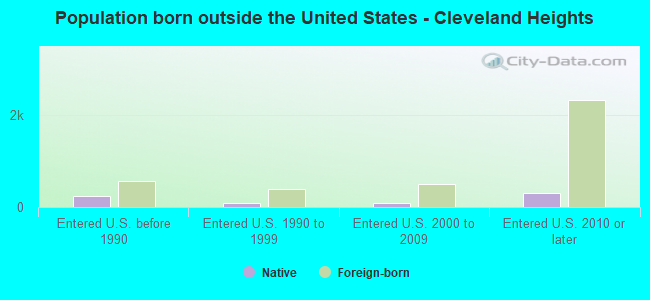
Place of birth - Foreign born (%)
Place of birth - Foreign born (%) - White
Place of birth - Foreign born (%) - Black or African American
Place of birth - Foreign born (%) - Asian
Place of birth - Foreign born (%) - Hispanic or Latino
Place of birth - Foreign born (%) - American Indian and Alaska Native
Place of birth - Foreign born (%) - Multirace
Place of birth - Foreign born (%) - Other Race
Residents speaking English at home (%)
Residents speaking English at home - Born in the United States (%)
Residents speaking English at home - Native, born elsewhere (%)
Residents speaking English at home - Foreign born (%)
Residents speaking Spanish at home (%)
Residents speaking Spanish at home - Born in the United States (%)
Residents speaking Spanish at home - Native, born elsewhere (%)
Residents speaking Spanish at home - Foreign born (%)
Residents speaking other language at home (%)
Residents speaking other language at home - Born in the United States (%)
Residents speaking other language at home - Native, born elsewhere (%)
Residents speaking other language at home - Foreign born (%)
Marital status - Never married (%)
Marital status - Now married (%)
Marital status - Separated (%)
Marital status - Widowed (%)
Marital status - Divorced (%)
Ancestries Reported - Arab (%)
Ancestries Reported - Czech (%)
Ancestries Reported - Danish (%)
Ancestries Reported - Dutch (%)
Ancestries Reported - English (%)
Ancestries Reported - French (%)
Ancestries Reported - French Canadian (%)
Ancestries Reported - German (%)
Ancestries Reported - Greek (%)
Ancestries Reported - Hungarian (%)
Ancestries Reported - Irish (%)
Ancestries Reported - Italian (%)
Ancestries Reported - Lithuanian (%)
Ancestries Reported - Norwegian (%)
Ancestries Reported - Polish (%)
Ancestries Reported - Portuguese (%)
Ancestries Reported - Russian (%)
Ancestries Reported - Scotch-Irish (%)
Ancestries Reported - Scottish (%)
Ancestries Reported - Slovak (%)
Ancestries Reported - Subsaharan African (%)
Ancestries Reported - Swedish (%)
Ancestries Reported - Swiss (%)
Ancestries Reported - Ukrainian (%)
Ancestries Reported - United States (%)
Ancestries Reported - Welsh (%)
Ancestries Reported - West Indian (%)
Ancestries Reported - Other (%)
Geographical mobility - Same house 1 year ago (%)
Geographical mobility - Same house 1 year ago (%) - White
Geographical mobility - Same house 1 year ago (%) - Black or African American
Geographical mobility - Same house 1 year ago (%) - Asian
Geographical mobility - Same house 1 year ago (%) - Hispanic or Latino
Geographical mobility - Same house 1 year ago (%) - American Indian and Alaska Native
Geographical mobility - Same house 1 year ago (%) - Multirace
Geographical mobility - Same house 1 year ago (%) - Other Race
Geographical mobility - Moved within same county (%)
Geographical mobility - Moved within same county (%) - White
Geographical mobility - Moved within same county (%) - Black or African American
Geographical mobility - Moved within same county (%) - Asian
Geographical mobility - Moved within same county (%) - Hispanic or Latino
Geographical mobility - Moved within same county (%) - American Indian and Alaska Native
Geographical mobility - Moved within same county (%) - Multirace
Geographical mobility - Moved within same county (%) - Other Race
Geographical mobility - Moved from different county within same state (%)
Geographical mobility - Moved from different county within same state (%) - White
Geographical mobility - Moved from different county within same state (%) - Black or African American
Geographical mobility - Moved from different county within same state (%) - Asian
Geographical mobility - Moved from different county within same state (%) - Hispanic or Latino
Geographical mobility - Moved from different county within same state (%) - American Indian and Alaska Native
Geographical mobility - Moved from different county within same state (%) - Multirace
Geographical mobility - Moved from different county within same state (%) - Other Race
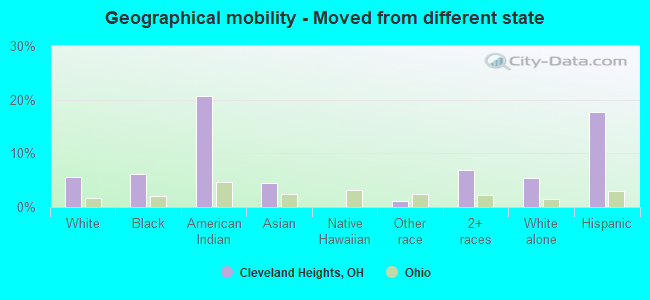
Geographical mobility - Moved from different state (%)
Geographical mobility - Moved from different state (%) - White
Geographical mobility - Moved from different state (%) - Black or African American
Geographical mobility - Moved from different state (%) - Asian
Geographical mobility - Moved from different state (%) - Hispanic or Latino
Geographical mobility - Moved from different state (%) - American Indian and Alaska Native
Geographical mobility - Moved from different state (%) - Multirace
Geographical mobility - Moved from different state (%) - Other Race
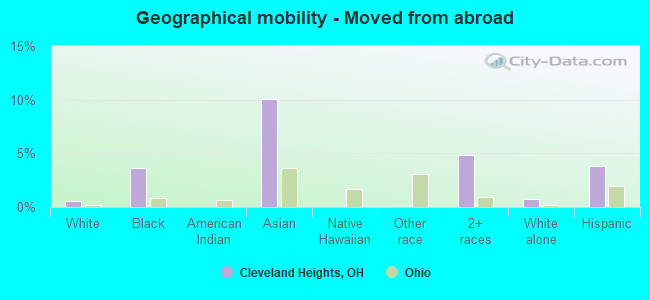
Geographical mobility - Moved from abroad (%)
Geographical mobility - Moved from abroad (%) - White
Geographical mobility - Moved from abroad (%) - Black or African American
Geographical mobility - Moved from abroad (%) - Asian
Geographical mobility - Moved from abroad (%) - Hispanic or Latino
Geographical mobility - Moved from abroad (%) - American Indian and Alaska Native
Geographical mobility - Moved from abroad (%) - Multirace
Geographical mobility - Moved from abroad (%) - Other Race
Place of birth for the foreign-born population - Ireland (%)
Place of birth for the foreign-born population - Denmark (%)
Place of birth for the foreign-born population - Norway (%)
Place of birth for the foreign-born population - Sweden (%)
Place of birth for the foreign-born population - United Kingdom (%)
Place of birth for the foreign-born population - England (%)
Place of birth for the foreign-born population - Scotland (%)
Place of birth for the foreign-born population - Other Northern Europe (%)
Place of birth for the foreign-born population - Austria (%)
Place of birth for the foreign-born population - Belgium (%)
Place of birth for the foreign-born population - France (%)
Place of birth for the foreign-born population - Germany (%)
Place of birth for the foreign-born population - Netherlands (%)
Place of birth for the foreign-born population - Switzerland (%)
Place of birth for the foreign-born population - Other Western Europe (%)
Place of birth for the foreign-born population - Greece (%)
Place of birth for the foreign-born population - Italy (%)
Place of birth for the foreign-born population - Portugal (%)
Place of birth for the foreign-born population - Spain (%)
Place of birth for the foreign-born population - Other Southern Europe (%)
Place of birth for the foreign-born population - Albania (%)
Place of birth for the foreign-born population - Belarus (%)
Place of birth for the foreign-born population - Bosnia and Herzegovina (%)
Place of birth for the foreign-born population - Bulgaria (%)
Place of birth for the foreign-born population - Croatia (%)
Place of birth for the foreign-born population - Czechoslovakia (%)
Place of birth for the foreign-born population - Hungary (%)
Place of birth for the foreign-born population - Latvia (%)
Place of birth for the foreign-born population - Lithuania (%)
Place of birth for the foreign-born population - North Macedonia (Macedonia) (%)
Place of birth for the foreign-born population - Moldova (%)
Place of birth for the foreign-born population - Poland (%)
Place of birth for the foreign-born population - Romania (%)
Place of birth for the foreign-born population - Russia (%)
Place of birth for the foreign-born population - Serbia (%)
Place of birth for the foreign-born population - Ukraine (%)
Place of birth for the foreign-born population - Other Eastern Europe (%)
Place of birth for the foreign-born population - China (%)
Place of birth for the foreign-born population - Hong Kong (%)
Place of birth for the foreign-born population - Taiwan (%)
Place of birth for the foreign-born population - Japan (%)
Place of birth for the foreign-born population - Korea (%)
Place of birth for the foreign-born population - Other Eastern Asia (%)
Place of birth for the foreign-born population - Afghanistan (%)
Place of birth for the foreign-born population - Bangladesh (%)
Place of birth for the foreign-born population - India (%)
Place of birth for the foreign-born population - Iran (%)
Place of birth for the foreign-born population - Kazakhstan (%)
Place of birth for the foreign-born population - Nepal (%)
Place of birth for the foreign-born population - Pakistan (%)
Place of birth for the foreign-born population - Sri Lanka (%)
Place of birth for the foreign-born population - Uzbekistan (%)
Place of birth for the foreign-born population - Other South Central Asia (%)
Place of birth for the foreign-born population - Burma (%)
Place of birth for the foreign-born population - Cambodia (%)
Place of birth for the foreign-born population - Indonesia (%)
Place of birth for the foreign-born population - Laos (%)
Place of birth for the foreign-born population - Malaysia (%)
Place of birth for the foreign-born population - Philippines (%)
Place of birth for the foreign-born population - Singapore (%)
Place of birth for the foreign-born population - Thailand (%)
Place of birth for the foreign-born population - Vietnam (%)
Place of birth for the foreign-born population - Other South Eastern Asia (%)
Place of birth for the foreign-born population - Armenia (%)
Place of birth for the foreign-born population - Iraq (%)
Place of birth for the foreign-born population - Israel (%)
Place of birth for the foreign-born population - Jordan (%)
Place of birth for the foreign-born population - Kuwait (%)
Place of birth for the foreign-born population - Lebanon (%)
Place of birth for the foreign-born population - Saudi Arabia (%)
Place of birth for the foreign-born population - Syria (%)
Place of birth for the foreign-born population - Turkey (%)
Place of birth for the foreign-born population - Yemen (%)
Place of birth for the foreign-born population - Other Western Asia (%)
Place of birth for the foreign-born population - Eritrea (%)
Place of birth for the foreign-born population - Ethiopia (%)
Place of birth for the foreign-born population - Kenya (%)
Place of birth for the foreign-born population - Somalia (%)
Place of birth for the foreign-born population - Uganda (%)
Place of birth for the foreign-born population - Zimbabwe (%)
Place of birth for the foreign-born population - Other Eastern Africa (%)
Place of birth for the foreign-born population - Cameroon (%)
Place of birth for the foreign-born population - Congo (%)
Place of birth for the foreign-born population - Democratic Republic of Congo (Zaire) (%)
Place of birth for the foreign-born population - Other Middle Africa (%)
Place of birth for the foreign-born population - Egypt (%)
Place of birth for the foreign-born population - Morocco (%)
Place of birth for the foreign-born population - Sudan (%)
Place of birth for the foreign-born population - Other Northern Africa (%)
Place of birth for the foreign-born population - South Africa (%)
Place of birth for the foreign-born population - Other Southern Africa (%)
Place of birth for the foreign-born population - Cabo Verde (%)
Place of birth for the foreign-born population - Ghana (%)
Place of birth for the foreign-born population - Liberia (%)
Place of birth for the foreign-born population - Nigeria (%)
Place of birth for the foreign-born population - Senegal (%)
Place of birth for the foreign-born population - Sierra Leone (%)
Place of birth for the foreign-born population - Other Western Africa (%)
Place of birth for the foreign-born population - Australia (%)
Place of birth for the foreign-born population - New Zealand (%)
Place of birth for the foreign-born population - Fiji (%)
Place of birth for the foreign-born population - Micronesia (%)
Place of birth for the foreign-born population - Bahamas (%)
Place of birth for the foreign-born population - Barbados (%)
Place of birth for the foreign-born population - Cuba (%)
Place of birth for the foreign-born population - Dominica (%)
Place of birth for the foreign-born population - Dominican Republic (%)
Place of birth for the foreign-born population - Grenada (%)
Place of birth for the foreign-born population - Haiti (%)
Place of birth for the foreign-born population - Jamaica (%)
Place of birth for the foreign-born population - St. Vincent and the Grenadines (%)
Place of birth for the foreign-born population - Trinidad and Tobago (%)
Place of birth for the foreign-born population - West Indies (%)
Place of birth for the foreign-born population - Other Caribbean (%)
Place of birth for the foreign-born population - Belize (%)
Place of birth for the foreign-born population - Costa Rica (%)
Place of birth for the foreign-born population - El Salvador (%)
Place of birth for the foreign-born population - Guatemala (%)
Place of birth for the foreign-born population - Honduras (%)
Place of birth for the foreign-born population - Mexico (%)
Place of birth for the foreign-born population - Nicaragua (%)
Place of birth for the foreign-born population - Panama (%)
Place of birth for the foreign-born population - Other Central America (%)
Place of birth for the foreign-born population - Argentina (%)
Place of birth for the foreign-born population - Bolivia (%)
Place of birth for the foreign-born population - Brazil (%)
Place of birth for the foreign-born population - Chile (%)
Place of birth for the foreign-born population - Colombia (%)
Place of birth for the foreign-born population - Ecuador (%)
Place of birth for the foreign-born population - Guyana (%)
Place of birth for the foreign-born population - Peru (%)
Place of birth for the foreign-born population - Uruguay (%)
Place of birth for the foreign-born population - Venezuela (%)
Place of birth for the foreign-born population - Other South America (%)
Place of birth for the foreign-born population - Canada (%)
Place of birth for the foreign-born population - Other Northern America (%)
Place of birth for the foreign-born population - Other (%)
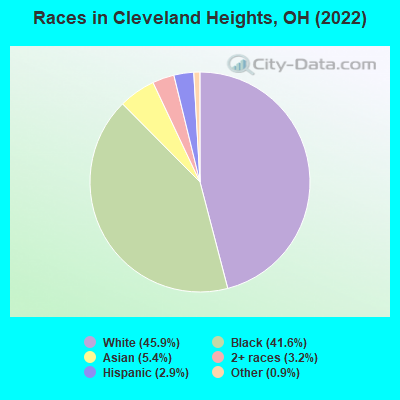
According to 2022 data, the most numerous races in Cleveland Heights, OH are White alone (20,309 residents), Black alone (18,408 residents), and Two or more races (1,429 residents). 89.2% of Cleveland Heights residents speak English at home. 8.4% of Cleveland Heights, OH residents are foreign-born (4.3% born in Asia, 1.4% born in Europe, 1.0% born in Africa), which is 52.3% greater than the foreign-born rate of 4.0% across the entire state of Ohio.
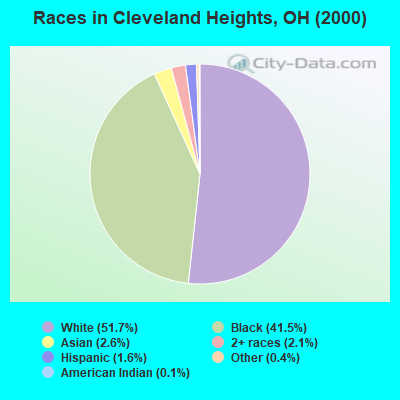
Race distribution in Cleveland Heights
2000 2022
9,538,111 84.0% White alone 1,290,662 11.4% Black alone 217,123 1.9% Hispanic 137,770 1.2% Two or more races 131,670 1.2% Asian alone 21,985 0.2% American Indian alone 13,483 0.1% Other race alone 2,336 0.02% Native Hawaiian and Other
8,948,793 76.1% White alone 1,401,403 11.9% Black alone 529,291 4.5% Two or more races 517,232 4.4% Hispanic 293,387 2.5% Asian alone 52,805 0.4% Other race alone 9,785 0.08% American Indian alone 3,362 0.03% Native Hawaiian and Other
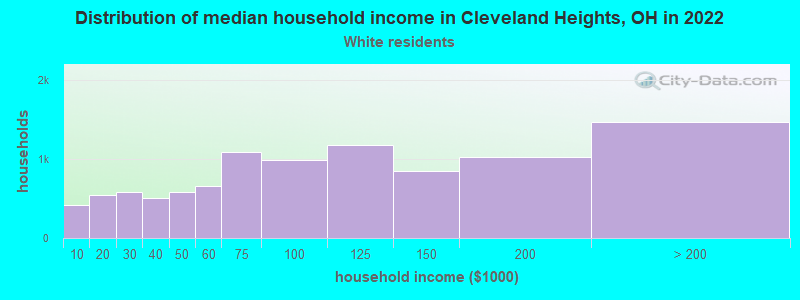
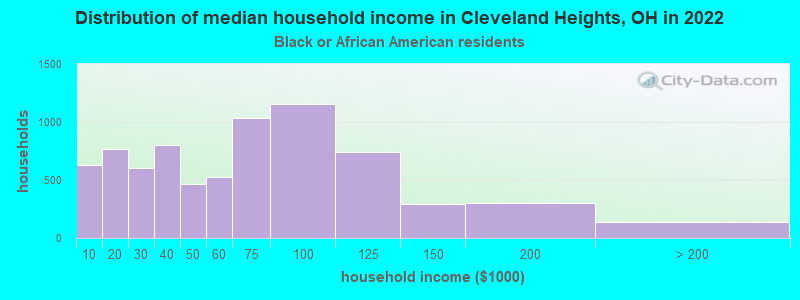
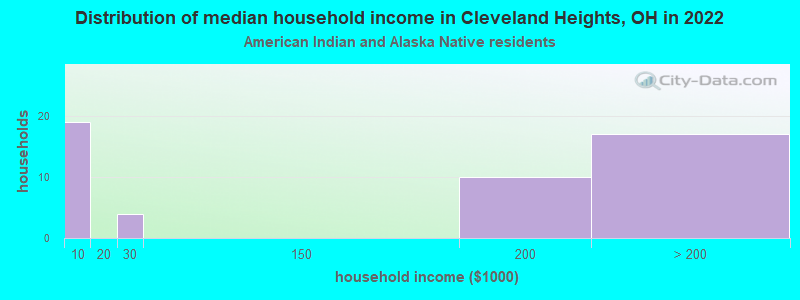
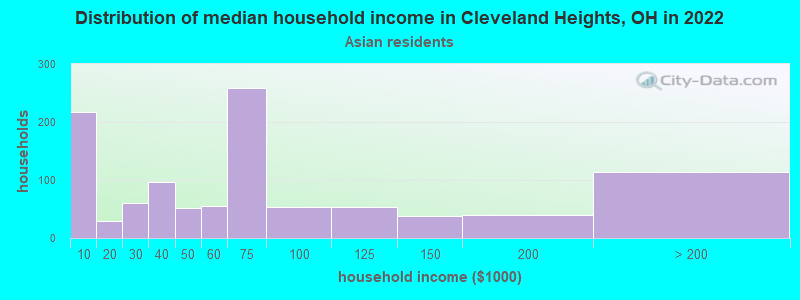
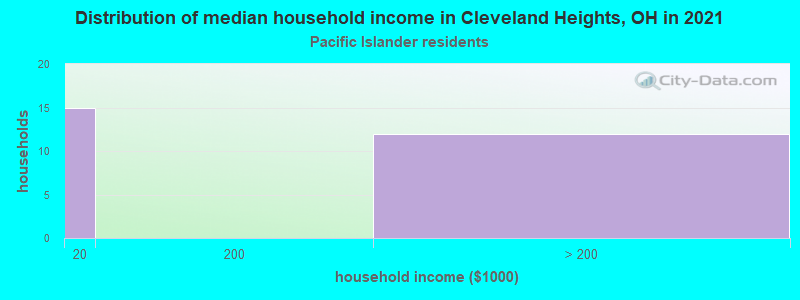
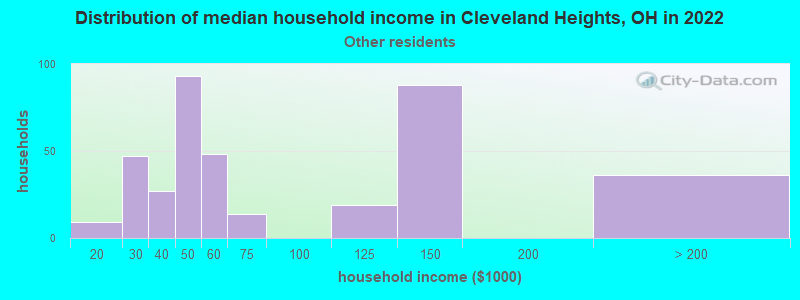
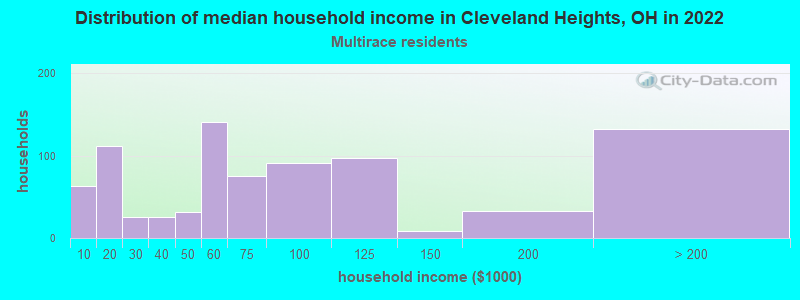
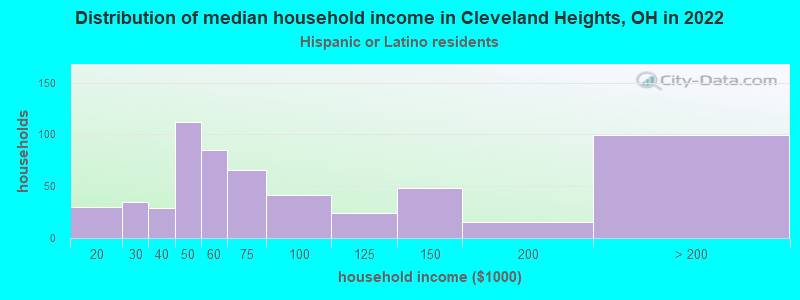
Income and house value in Cleveland Heights Median household income in 2022 $89,606 White non-Hispanic householders$56,343 Black householders$55,591 Asian householders$63,201 Two or more races householders$67,507 Hispanic or Latino race householdersMedian 2022 house value $203,426 White Non-Hispanic householders$158,880 Black or African American householders$148,486 American Indian or Alaska Native householders $195,672 Asian householders$144,032 Some other race householders$163,005 Two or more races householders$181,483 Hispanic or Latino householders
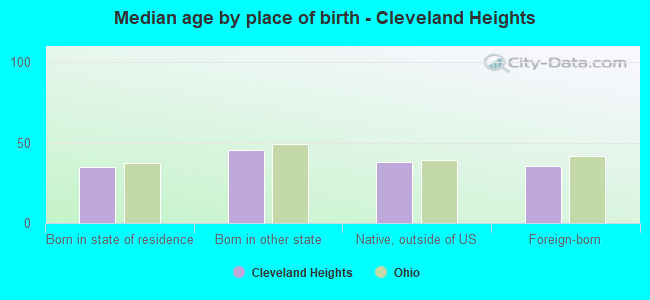
Median age by race in Cleveland Heights
39.2 Median age for White residents40.0 38.4 36.4 Median age for Black or African American residents34.3 40.4 34.8 Median age for American Indian / Alaska Native residents46.3 49.2 29.4 Median age for Asian residents31.8 27.6 69.6 Median age for Native Hawaiian / Pacific Islander residents-750,242,953.6 79.4 43.6 Median age for Other race residents38.3 43.9 30.3 Median age for Two or more races residents29.5 31.5 39.3 Median age for White alone residents39.8 38.6 32.5 Median age for Hispanic or Latino residents32.5 31.2
Owner/renter occupied households by race in Cleveland Heights
House owners and renters - White residents 6,656 67.4% Owner occupied3,225 32.6% Renter occupiedHouse owners and renters - Black or African American residents 4,243 56.7% Owner occupied3,241 43.3% Renter occupiedHouse owners and renters - American Indian / Alaska Native residents 15 45.2% Owner occupied18 54.8% Renter occupiedHouse owners and renters - Asian residents 283 29.0% Owner occupied694 71.0% Renter occupiedHouse owners and renters - Native Hawaiian / Pacific Islander residents 27 100.0% Owner occupiedHouse owners and renters - Other race residents 200 55.5% Owner occupied160 44.5% Renter occupiedHouse owners and renters - Two or more races residents 381 46.3% Owner occupied442 53.7% Renter occupiedHouse owners and renters - White alone residents 6,590 67.1% Owner occupied3,236 32.9% Renter occupiedHouse owners and renters - Hispanic or Latino residents 272 43.7% Owner occupied350 56.3% Renter occupied
Language usage in Cleveland Heights
English speakers - Total 89.2% of residents of Cleveland Heights speak English at home.
2.1% of residents speak Spanish at home 667 75.7% Speak English very well214 24.3% Speak English less than very well8.9% of residents speak other language at home 2,956 78.8% Speak English very well796 21.2% Speak English less than very well
English speakers - Born in the United States 93.0% of residents of Cleveland Heights speak English at home.
2.0% of residents speak Spanish at home 209 83.9% Speak English very well40 16.1% Speak English less than very well5.3% of residents speak other language at home 616 93.8% Speak English very well41 6.2% Speak English less than very well
English speakers - Native, born elsewhere 69.0% of residents of Cleveland Heights speak English at home.
23.1% of residents speak Spanish at home 125 80.6% Speak English very well30 19.4% Speak English less than very well7.2% of residents speak other language at home 33 68.8% Speak English very well15 31.2% Speak English less than very well
English speakers - Foreign-born 21.9% of residents of Cleveland Heights speak English at home.
5.1% of residents speak Spanish at home 70 39.1% Speak English very well109 60.9% Speak English less than very well73.7% of residents speak other language at home 1,892 72.8% Speak English very well706 27.2% Speak English less than very well
White (Caucasian) - Speak only English Native:
96.6% (17,820)Foreign-born:
35.6% (382)
White (Caucasian) - Speak another language Native:
3.5% (644)Foreign-born:
64.8% (696)
Black or African American - Speak only English Native:
99.4% (17,022)Foreign-born:
16.3% (104)
Black or African American - Speak another language Native:
1.0% (172)Foreign-born:
88.3% (562)
Asian - Speak only English Native:
33.3% (257)Foreign-born:
16.8% (262)
Asian - Speak another language Native:
68.5% (530)Foreign-born:
83.3% (1,300)
Native Hawaiian / Pacific Islander - Speak another language Native:
62.2% (21)Foreign-born:
100.0% (16)
Other race - Speak only English Native:
56.3% (363)Foreign-born:
4.6% (5)
Other race - Speak another language Native:
35.4% (228)Foreign-born:
100.0% (103)
Two or more races - Speak only English Native:
88.0% (1,472)Foreign-born:
15.5% (33)
Two or more races - Speak another language Native:
9.7% (163)Foreign-born:
84.6% (178)
White alone - Speak only English Native:
96.4% (17,697)Foreign-born:
35.5% (378)
White alone - Speak another language Native:
3.6% (668)Foreign-born:
64.4% (687)
Hispanic or Latino - Speak only English Native:
54.3% (529)Foreign-born:
6.9% (15)
Hispanic or Latino - Speak another language Native:
45.9% (448)Foreign-born:
92.6% (196)
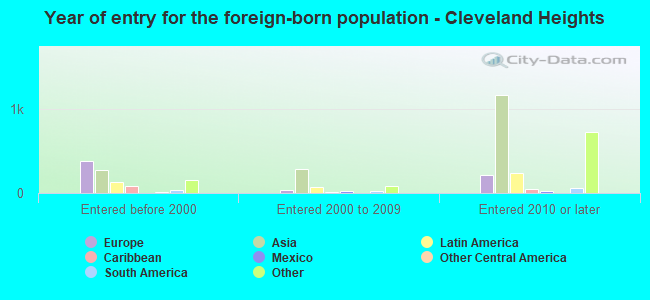
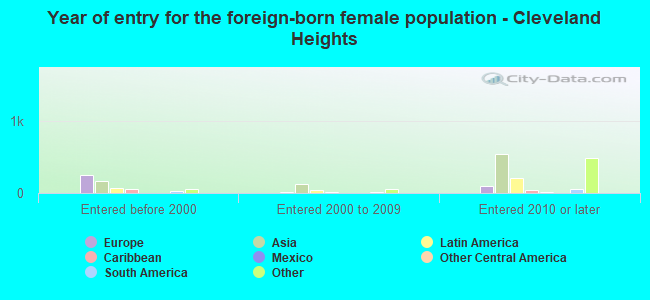
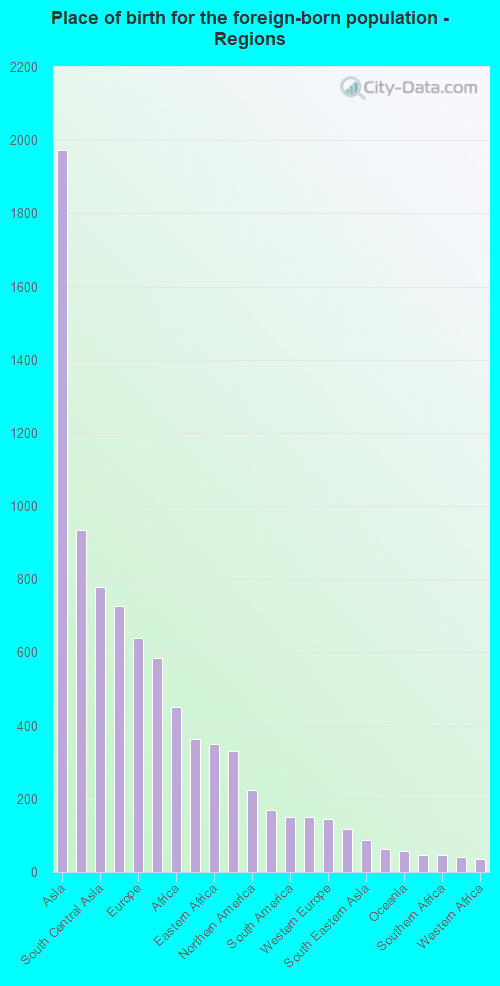
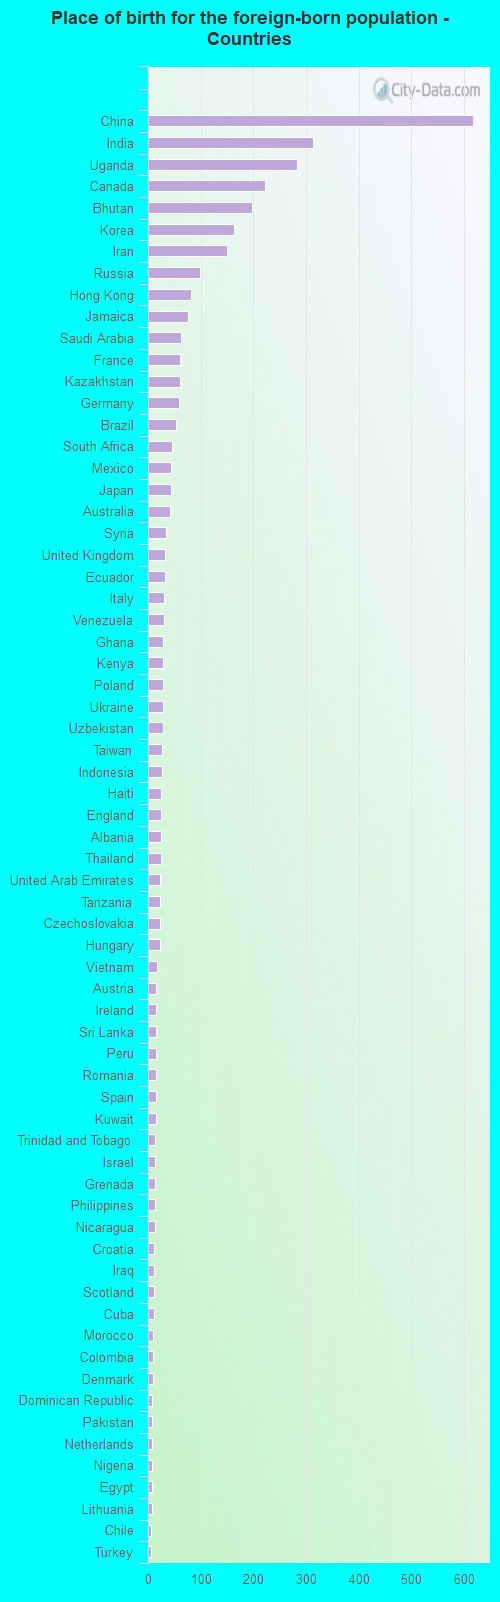
Foreign-born residents in Cleveland Heights 3,710 residents are foreign born (4.3% Asia , 1.4% Europe , 1.0% Africa ).
Marital status for residents in Cleveland Heights Marital status - White (Caucasian) population 15 years and over
Males 37.9% Never married51.8% Now married0.6% Separated3.1% Widowed6.6% DivorcedFemales 38.2% Never married43.1% Now married0.2% Separated6.3% Widowed12.1% DivorcedWomen who gave birth in the past 12 months Now married:
90.7% (165)Unmarried:
9.3% (17)
Women who did not give birth in the past 12 months Now married:
36.3% (1,815)Unmarried:
63.7% (3,191)
Marital status - Black or African American population 15 years and over
Males 53.8% Never married31.4% Now married1.1% Separated3.2% Widowed10.4% DivorcedFemales 44.4% Never married25.2% Now married2.4% Separated9.0% Widowed19.0% DivorcedWomen who gave birth in the past 12 months Now married:
27.6% (37)Unmarried:
72.4% (96)
Women who did not give birth in the past 12 months Now married:
17.2% (724)Unmarried:
82.8% (3,476)
Marital status - American Indian / Alaska Native population 15 years and over
Males 42.1% Never married57.9% Now married0.0% Separated0.0% Widowed0.0% DivorcedFemales 32.0% Never married28.0% Now married0.0% Separated40.0% Widowed0.0% DivorcedWomen who did not give birth in the past 12 months Now married:
100.0% (9)Unmarried:
0.0% (0)
Marital status - Asian population 15 years and over
Males 62.5% Never married32.9% Now married0.0% Separated3.0% Widowed1.6% DivorcedFemales 57.9% Never married40.7% Now married0.0% Separated0.0% Widowed1.4% DivorcedWomen who gave birth in the past 12 months Now married:
100.0% (33)Unmarried:
0.0% (0)
Women who did not give birth in the past 12 months Now married:
33.5% (274)Unmarried:
66.5% (545)
Marital status - Other race population 15 years and over
Males 26.8% Never married68.1% Now married0.0% Separated0.0% Widowed5.1% DivorcedFemales 42.8% Never married51.6% Now married0.0% Separated0.0% Widowed5.7% DivorcedWomen who gave birth in the past 12 months Now married:
0.0% (0)Unmarried:
100.0% (16)
Women who did not give birth in the past 12 months Now married:
26.7% (72)Unmarried:
73.3% (199)
Marital status - Two or more races population 15 years and over
Males 62.3% Never married34.2% Now married0.7% Separated2.0% Widowed0.7% DivorcedFemales 43.6% Never married31.1% Now married9.1% Separated2.9% Widowed13.3% DivorcedWomen who gave birth in the past 12 months Now married:
100.0% (43)Unmarried:
0.0% (0)
Women who did not give birth in the past 12 months Now married:
23.3% (103)Unmarried:
76.7% (338)
Marital status - White alone, not Hispanic / Latino population 15 years and over
Males 37.7% Never married51.9% Now married0.6% Separated3.1% Widowed6.7% DivorcedFemales 38.1% Never married43.3% Now married0.2% Separated6.4% Widowed12.0% DivorcedWomen who gave birth in the past 12 months Now married:
90.7% (170)Unmarried:
9.3% (17)
Women who did not give birth in the past 12 months Now married:
36.7% (1,828)Unmarried:
63.3% (3,159)
Marital status - Hispanic or Latino population 15 years and over
Males 61.1% Never married35.9% Now married0.0% Separated0.0% Widowed3.0% DivorcedFemales 48.6% Never married31.7% Now married0.0% Separated3.0% Widowed16.8% DivorcedWomen who gave birth in the past 12 months Now married:
0.0% (0)Unmarried:
100.0% (11)
Women who did not give birth in the past 12 months Now married:
23.8% (93)Unmarried:
76.2% (297)
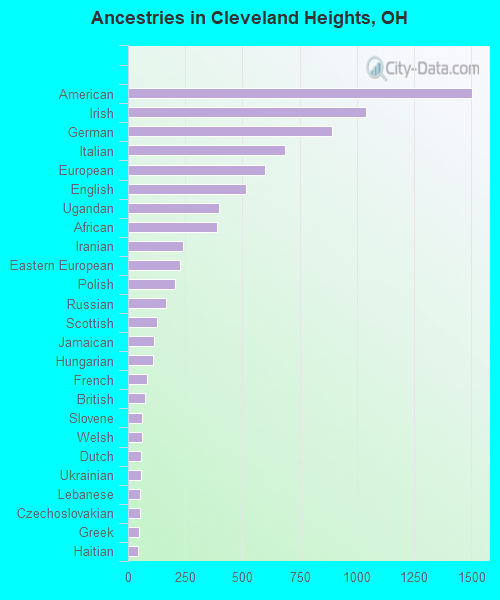
Ancestries in Cleveland Heights
1,503 6.0% American1,039 4.2% Irish890 3.6% German685 2.7% Italian600 2.4% European518 2.1% English396 1.6% Ugandan387 1.5% African240 1.0% Iranian228 0.9% Eastern European206 0.8% Polish168 0.7% Russian126 0.5% Scottish114 0.5% Jamaican110 0.4% Hungarian84 0.3% French76 0.3% British62 0.2% Slovene62 0.2% Welsh59 0.2% Dutch55 0.2% Ukrainian52 0.2% Lebanese51 0.2% Czechoslovakian50 0.2% Greek44 0.2% Haitian43 0.2% Scotch-Irish42 0.2% Slovak40 0.2% Swedish37 0.1% Canadian36 0.1% Australian36 0.1% Nigerian33 0.1% Finnish29 0.1% Albanian28 0.1% Serbian24 0.10% French Canadian24 0.10% Norwegian24 0.10% Northern European23 0.09% Czech21 0.08% Syrian21 0.08% Kenyan18 0.07% Austrian16 0.06% Danish15 0.06% Lithuanian15 0.06% Croatian12 0.05% Israeli12 0.05% Bermudan10 0.04% Trinidadian and Tobagonian9 0.04% Brazilian9 0.04% Portuguese6 0.02% Romanian6 0.02% Scandinavian5 0.02% Ethiopian5 0.02% Swiss5 0.02% Celtic4 0.02% Latvian4 0.02% Zimbabwean3 0.01% Slavic3 0.01% Macedonian2 0.01% Egyptian
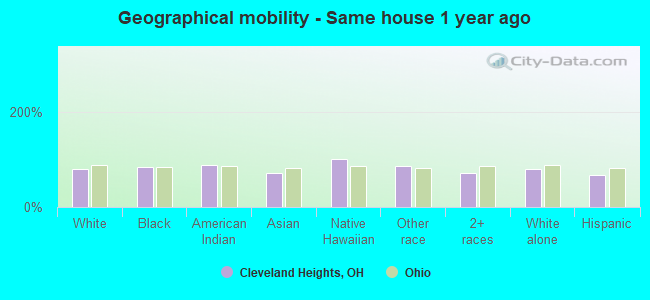
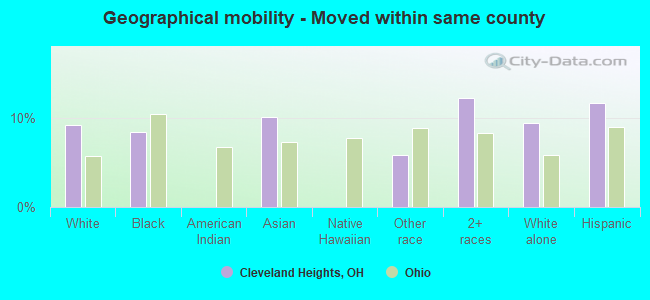
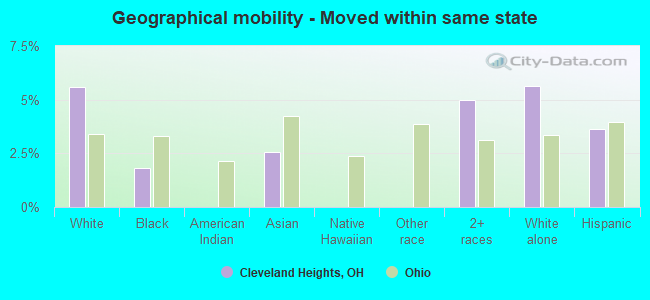
Geographical mobility in Cleveland Heights Same house 1 year ago 16,121 79.6% White (Caucasian)15,429 83.8% Black or African American50 87.8% American Indian / Alaska Native1,715 72.3% Asian51 100.0% Native Hawaiian / Pacific Islander642 86.1% Other race1,451 72.4% Two or more races16,023 79.6% White alone, not Hispanic / Latino853 68.4% Hispanic or LatinoMoved within same county 1,856 9.2% White / Caucasian1,534 8.3% Black or African American239 10.1% Asian43 5.8% Other race244 12.2% Two or more races1,900 9.4% White alone, not Hispanic / Latino145 11.6% Hispanic or LatinoMoved within same state 1,135 5.6% White / Caucasian334 1.8% Black or African American61 2.6% Asian100 5.0% Two or more races1,136 5.6% White alone, not Hispanic / Latino46 3.7% Hispanic or LatinoMoved from different state 1,141 5.6% White / Caucasian1,118 6.1% Black or African American12 20.7% American Indian / Alaska Native106 4.5% Asian9 1.2% Other race139 7.0% Two or more races1,099 5.5% White alone, not Hispanic / Latino222 17.8% Hispanic or LatinoMoved from abroad 119 0.6% White669 3.6% Black or African American239 10.1% Asian97 4.8% Two or more races154 0.8% White alone, not Hispanic / Latino48 3.9% Hispanic or Latino
Children Nativity (place of birth) in Cleveland Heights
Children under 6 years - Living with two parents Both parents native 961 100.0% NativeBoth parents foreign-born 45 72.4% Native17 27.6% Foreign-bornOne native, one foreign-born parent 496 100.0% NativeChildren under 6 years - Living with one parent Native parent 1,004 100.0% NativeChildren 6 to 17 years - Living with two parents Both parents native 2,412 100.0% NativeBoth parents foreign-born 277 92.9% Native21 7.1% Foreign-bornOne native, one foreign-born parent 439 99.3% Native3 0.7% Foreign-bornChildren 6 to 17 years - Living with one parent Native parent 2,907 97.9% Native62 2.1% Foreign-bornForeign-born parent 90 70.4% Native38 29.6% Foreign-born
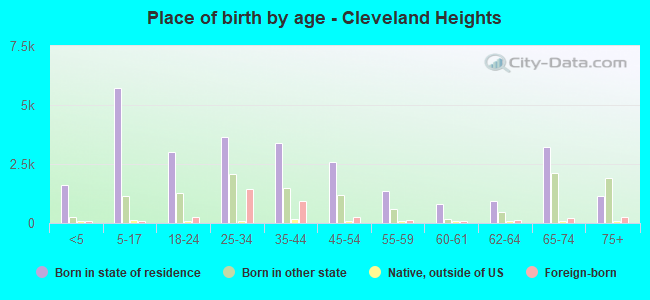
Place of birth for residents in Cleveland Heights
Grandparents responsible for own grandchildren in Cleveland Heights
Grandparents (30 to 59 years) White / Caucasian 57 92.9% Responsible for grandchildren4 7.1% Not responsible for grandchildrenBlack or African American 124 62.7% Responsible for grandchildren74 37.3% Not responsible for grandchildrenWhite alone, not Hispanic / Latino 60 93.3% Responsible for grandchildren4 6.7% Not responsible for grandchildrenGrandparents (60 years and over) White / Caucasian 34 100.0% Not responsible for grandchildrenBlack or African American 57 31.9% Responsible for grandchildren121 68.1% Not responsible for grandchildrenWhite alone, not Hispanic / Latino 36 100.0% Not responsible for grandchildren