Races in Coral Gables, Florida (FL) Detailed Stats
Data:
Races - White alone (%)
Races - White alone (% change since 2000)
Races - Black alone (%)
Races - Black alone (% change since 2000)
Races - American Indian alone (%)
Races - American Indian alone (% change since 2000)
Races - Asian alone (%)
Races - Asian alone (% change since 2000)
Races - Hispanic (%)
Races - Hispanic (% change since 2000)
Races - Native Hawaiian and Other Pacific Islander alone (%)
Races - Native Hawaiian and Other Pacific Islander alone (% change since 2000)
Races - Two or more races(%)
Races - Two or more races(% change since 2000)
Races - Other race alone (%)
Races - Other race alone (% change since 2000)
Racial diversity
Place of birth - Born in state of residence (%)
Place of birth - Born in state of residence (%) - White
Place of birth - Born in state of residence (%) - Black or African American
Place of birth - Born in state of residence (%) - Asian
Place of birth - Born in state of residence (%) - Hispanic or Latino
Place of birth - Born in state of residence (%) - American Indian and Alaska Native
Place of birth - Born in state of residence (%) - Multirace
Place of birth - Born in state of residence (%) - Other Race
Place of birth - Born in other state (%)
Place of birth - Born in other state (%) - White
Place of birth - Born in other state (%) - Black or African American
Place of birth - Born in other state (%) - Asian
Place of birth - Born in other state (%) - Hispanic or Latino
Place of birth - Born in other state (%) - American Indian and Alaska Native
Place of birth - Born in other state (%) - Multirace
Place of birth - Born in other state (%) - Other Race
Place of birth - Native, outside of US (%)
Place of birth - Native, outside of US (%) - White
Place of birth - Native, outside of US (%) - Black or African American
Place of birth - Native, outside of US (%) - Asian
Place of birth - Native, outside of US (%) - Hispanic or Latino
Place of birth - Native, outside of US (%) - American Indian and Alaska Native
Place of birth - Native, outside of US (%) - Multirace
Place of birth - Native, outside of US (%) - Other Race
Place of birth - Foreign born (%)
Place of birth - Foreign born (%) - White
Place of birth - Foreign born (%) - Black or African American
Place of birth - Foreign born (%) - Asian
Place of birth - Foreign born (%) - Hispanic or Latino
Place of birth - Foreign born (%) - American Indian and Alaska Native
Place of birth - Foreign born (%) - Multirace
Place of birth - Foreign born (%) - Other Race
Residents speaking English at home (%)
Residents speaking English at home - Born in the United States (%)
Residents speaking English at home - Native, born elsewhere (%)
Residents speaking English at home - Foreign born (%)
Residents speaking Spanish at home (%)
Residents speaking Spanish at home - Born in the United States (%)
Residents speaking Spanish at home - Native, born elsewhere (%)
Residents speaking Spanish at home - Foreign born (%)
Residents speaking other language at home (%)
Residents speaking other language at home - Born in the United States (%)
Residents speaking other language at home - Native, born elsewhere (%)
Residents speaking other language at home - Foreign born (%)
Marital status - Never married (%)
Marital status - Now married (%)
Marital status - Separated (%)
Marital status - Widowed (%)
Marital status - Divorced (%)
Ancestries Reported - Arab (%)
Ancestries Reported - Czech (%)
Ancestries Reported - Danish (%)
Ancestries Reported - Dutch (%)
Ancestries Reported - English (%)
Ancestries Reported - French (%)
Ancestries Reported - French Canadian (%)
Ancestries Reported - German (%)
Ancestries Reported - Greek (%)
Ancestries Reported - Hungarian (%)
Ancestries Reported - Irish (%)
Ancestries Reported - Italian (%)
Ancestries Reported - Lithuanian (%)
Ancestries Reported - Norwegian (%)
Ancestries Reported - Polish (%)
Ancestries Reported - Portuguese (%)
Ancestries Reported - Russian (%)
Ancestries Reported - Scotch-Irish (%)
Ancestries Reported - Scottish (%)
Ancestries Reported - Slovak (%)
Ancestries Reported - Subsaharan African (%)
Ancestries Reported - Swedish (%)
Ancestries Reported - Swiss (%)
Ancestries Reported - Ukrainian (%)
Ancestries Reported - United States (%)
Ancestries Reported - Welsh (%)
Ancestries Reported - West Indian (%)
Ancestries Reported - Other (%)
Geographical mobility - Same house 1 year ago (%)
Geographical mobility - Same house 1 year ago (%) - White
Geographical mobility - Same house 1 year ago (%) - Black or African American
Geographical mobility - Same house 1 year ago (%) - Asian
Geographical mobility - Same house 1 year ago (%) - Hispanic or Latino
Geographical mobility - Same house 1 year ago (%) - American Indian and Alaska Native
Geographical mobility - Same house 1 year ago (%) - Multirace
Geographical mobility - Same house 1 year ago (%) - Other Race
Geographical mobility - Moved within same county (%)
Geographical mobility - Moved within same county (%) - White
Geographical mobility - Moved within same county (%) - Black or African American
Geographical mobility - Moved within same county (%) - Asian
Geographical mobility - Moved within same county (%) - Hispanic or Latino
Geographical mobility - Moved within same county (%) - American Indian and Alaska Native
Geographical mobility - Moved within same county (%) - Multirace
Geographical mobility - Moved within same county (%) - Other Race
Geographical mobility - Moved from different county within same state (%)
Geographical mobility - Moved from different county within same state (%) - White
Geographical mobility - Moved from different county within same state (%) - Black or African American
Geographical mobility - Moved from different county within same state (%) - Asian
Geographical mobility - Moved from different county within same state (%) - Hispanic or Latino
Geographical mobility - Moved from different county within same state (%) - American Indian and Alaska Native
Geographical mobility - Moved from different county within same state (%) - Multirace
Geographical mobility - Moved from different county within same state (%) - Other Race
Geographical mobility - Moved from different state (%)
Geographical mobility - Moved from different state (%) - White
Geographical mobility - Moved from different state (%) - Black or African American
Geographical mobility - Moved from different state (%) - Asian
Geographical mobility - Moved from different state (%) - Hispanic or Latino
Geographical mobility - Moved from different state (%) - American Indian and Alaska Native
Geographical mobility - Moved from different state (%) - Multirace
Geographical mobility - Moved from different state (%) - Other Race
Geographical mobility - Moved from abroad (%)
Geographical mobility - Moved from abroad (%) - White
Geographical mobility - Moved from abroad (%) - Black or African American
Geographical mobility - Moved from abroad (%) - Asian
Geographical mobility - Moved from abroad (%) - Hispanic or Latino
Geographical mobility - Moved from abroad (%) - American Indian and Alaska Native
Geographical mobility - Moved from abroad (%) - Multirace
Geographical mobility - Moved from abroad (%) - Other Race
Place of birth for the foreign-born population - Ireland (%)
Place of birth for the foreign-born population - Denmark (%)
Place of birth for the foreign-born population - Norway (%)
Place of birth for the foreign-born population - Sweden (%)
Place of birth for the foreign-born population - United Kingdom (%)
Place of birth for the foreign-born population - England (%)
Place of birth for the foreign-born population - Scotland (%)
Place of birth for the foreign-born population - Other Northern Europe (%)
Place of birth for the foreign-born population - Austria (%)
Place of birth for the foreign-born population - Belgium (%)
Place of birth for the foreign-born population - France (%)
Place of birth for the foreign-born population - Germany (%)
Place of birth for the foreign-born population - Netherlands (%)
Place of birth for the foreign-born population - Switzerland (%)
Place of birth for the foreign-born population - Other Western Europe (%)
Place of birth for the foreign-born population - Greece (%)
Place of birth for the foreign-born population - Italy (%)
Place of birth for the foreign-born population - Portugal (%)
Place of birth for the foreign-born population - Spain (%)
Place of birth for the foreign-born population - Other Southern Europe (%)
Place of birth for the foreign-born population - Albania (%)
Place of birth for the foreign-born population - Belarus (%)
Place of birth for the foreign-born population - Bosnia and Herzegovina (%)
Place of birth for the foreign-born population - Bulgaria (%)
Place of birth for the foreign-born population - Croatia (%)
Place of birth for the foreign-born population - Czechoslovakia (%)
Place of birth for the foreign-born population - Hungary (%)
Place of birth for the foreign-born population - Latvia (%)
Place of birth for the foreign-born population - Lithuania (%)
Place of birth for the foreign-born population - North Macedonia (Macedonia) (%)
Place of birth for the foreign-born population - Moldova (%)
Place of birth for the foreign-born population - Poland (%)
Place of birth for the foreign-born population - Romania (%)
Place of birth for the foreign-born population - Russia (%)
Place of birth for the foreign-born population - Serbia (%)
Place of birth for the foreign-born population - Ukraine (%)
Place of birth for the foreign-born population - Other Eastern Europe (%)
Place of birth for the foreign-born population - China (%)
Place of birth for the foreign-born population - Hong Kong (%)
Place of birth for the foreign-born population - Taiwan (%)
Place of birth for the foreign-born population - Japan (%)
Place of birth for the foreign-born population - Korea (%)
Place of birth for the foreign-born population - Other Eastern Asia (%)
Place of birth for the foreign-born population - Afghanistan (%)
Place of birth for the foreign-born population - Bangladesh (%)
Place of birth for the foreign-born population - India (%)
Place of birth for the foreign-born population - Iran (%)
Place of birth for the foreign-born population - Kazakhstan (%)
Place of birth for the foreign-born population - Nepal (%)
Place of birth for the foreign-born population - Pakistan (%)
Place of birth for the foreign-born population - Sri Lanka (%)
Place of birth for the foreign-born population - Uzbekistan (%)
Place of birth for the foreign-born population - Other South Central Asia (%)
Place of birth for the foreign-born population - Burma (%)
Place of birth for the foreign-born population - Cambodia (%)
Place of birth for the foreign-born population - Indonesia (%)
Place of birth for the foreign-born population - Laos (%)
Place of birth for the foreign-born population - Malaysia (%)
Place of birth for the foreign-born population - Philippines (%)
Place of birth for the foreign-born population - Singapore (%)
Place of birth for the foreign-born population - Thailand (%)
Place of birth for the foreign-born population - Vietnam (%)
Place of birth for the foreign-born population - Other South Eastern Asia (%)
Place of birth for the foreign-born population - Armenia (%)
Place of birth for the foreign-born population - Iraq (%)
Place of birth for the foreign-born population - Israel (%)
Place of birth for the foreign-born population - Jordan (%)
Place of birth for the foreign-born population - Kuwait (%)
Place of birth for the foreign-born population - Lebanon (%)
Place of birth for the foreign-born population - Saudi Arabia (%)
Place of birth for the foreign-born population - Syria (%)
Place of birth for the foreign-born population - Turkey (%)
Place of birth for the foreign-born population - Yemen (%)
Place of birth for the foreign-born population - Other Western Asia (%)
Place of birth for the foreign-born population - Eritrea (%)
Place of birth for the foreign-born population - Ethiopia (%)
Place of birth for the foreign-born population - Kenya (%)
Place of birth for the foreign-born population - Somalia (%)
Place of birth for the foreign-born population - Uganda (%)
Place of birth for the foreign-born population - Zimbabwe (%)
Place of birth for the foreign-born population - Other Eastern Africa (%)
Place of birth for the foreign-born population - Cameroon (%)
Place of birth for the foreign-born population - Congo (%)
Place of birth for the foreign-born population - Democratic Republic of Congo (Zaire) (%)
Place of birth for the foreign-born population - Other Middle Africa (%)
Place of birth for the foreign-born population - Egypt (%)
Place of birth for the foreign-born population - Morocco (%)
Place of birth for the foreign-born population - Sudan (%)
Place of birth for the foreign-born population - Other Northern Africa (%)
Place of birth for the foreign-born population - South Africa (%)
Place of birth for the foreign-born population - Other Southern Africa (%)
Place of birth for the foreign-born population - Cabo Verde (%)
Place of birth for the foreign-born population - Ghana (%)
Place of birth for the foreign-born population - Liberia (%)
Place of birth for the foreign-born population - Nigeria (%)
Place of birth for the foreign-born population - Senegal (%)
Place of birth for the foreign-born population - Sierra Leone (%)
Place of birth for the foreign-born population - Other Western Africa (%)
Place of birth for the foreign-born population - Australia (%)
Place of birth for the foreign-born population - New Zealand (%)
Place of birth for the foreign-born population - Fiji (%)
Place of birth for the foreign-born population - Micronesia (%)
Place of birth for the foreign-born population - Bahamas (%)
Place of birth for the foreign-born population - Barbados (%)
Place of birth for the foreign-born population - Cuba (%)
Place of birth for the foreign-born population - Dominica (%)
Place of birth for the foreign-born population - Dominican Republic (%)
Place of birth for the foreign-born population - Grenada (%)
Place of birth for the foreign-born population - Haiti (%)
Place of birth for the foreign-born population - Jamaica (%)
Place of birth for the foreign-born population - St. Vincent and the Grenadines (%)
Place of birth for the foreign-born population - Trinidad and Tobago (%)
Place of birth for the foreign-born population - West Indies (%)
Place of birth for the foreign-born population - Other Caribbean (%)
Place of birth for the foreign-born population - Belize (%)
Place of birth for the foreign-born population - Costa Rica (%)
Place of birth for the foreign-born population - El Salvador (%)
Place of birth for the foreign-born population - Guatemala (%)
Place of birth for the foreign-born population - Honduras (%)
Place of birth for the foreign-born population - Mexico (%)
Place of birth for the foreign-born population - Nicaragua (%)
Place of birth for the foreign-born population - Panama (%)
Place of birth for the foreign-born population - Other Central America (%)
Place of birth for the foreign-born population - Argentina (%)
Place of birth for the foreign-born population - Bolivia (%)
Place of birth for the foreign-born population - Brazil (%)
Place of birth for the foreign-born population - Chile (%)
Place of birth for the foreign-born population - Colombia (%)
Place of birth for the foreign-born population - Ecuador (%)
Place of birth for the foreign-born population - Guyana (%)
Place of birth for the foreign-born population - Peru (%)
Place of birth for the foreign-born population - Uruguay (%)
Place of birth for the foreign-born population - Venezuela (%)
Place of birth for the foreign-born population - Other South America (%)
Place of birth for the foreign-born population - Canada (%)
Place of birth for the foreign-born population - Other Northern America (%)
Place of birth for the foreign-born population - Other (%)
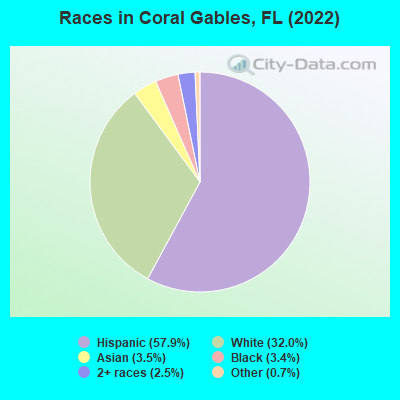
According to 2022 data, the most numerous races in Coral Gables, FL are White alone (15,837 residents), Hispanic (28,615 residents), and Black alone (1,666 residents). 38.6% of Coral Gables residents speak English at home. 39.1% of Coral Gables, FL residents are foreign-born (31.9% born in Latin America), which is 46.3% greater than the foreign-born rate of 21.0% across the entire state of Florida.
Race distribution in Coral Gables
2000 2022
10,458,509 65.4% White alone 2,682,715 16.8% Hispanic 2,264,268 14.2% Black alone 261,693 1.6% Asian alone 236,954 1.5% Two or more races 42,358 0.3% American Indian alone 28,994 0.2% Other race alone 6,887 0.04% Native Hawaiian and Other
11,309,403 50.8% White alone 6,025,039 27.1% Hispanic 3,241,015 14.6% Black alone 861,630 3.9% Two or more races 623,692 2.8% Asian alone 152,054 0.7% Other race alone 22,504 0.1% American Indian alone 9,486 0.04% Native Hawaiian and Other
Income and house value in Coral Gables Median household income in 2022 $141,415 White non-Hispanic householders$69,719 Black householders$102,996 Some other race householders$118,981 Two or more races householders$118,990 Hispanic or Latino race householdersMedian 2022 house value over $1,000,000 White Non-Hispanic householders$324,822 Black or African American householders$797,002 American Indian or Alaska Native householders $708,446 Asian householdersover $1,000,000 Some other race householders$743,868 Two or more races householdersover $1,000,000 Hispanic or Latino householders
Median age by race in Coral Gables
35.2 Median age for White residents35.9 34.7 21.3 Median age for Black or African American residents22.7 20.4 -653,446,647.1 Median age for American Indian / Alaska Native residents-543,352,600.6 -762,696,213.5 28.8 Median age for Asian residents31.8 26.8 -679,849,340.2 Median age for Native Hawaiian / Pacific Islander residents-858,307,848.3 -443,298,968.6 38.5 Median age for Other race residents39.5 37.3 49.9 Median age for Two or more races residents48.2 51.9 31.1 Median age for White alone residents34.1 27.4 46.2 Median age for Hispanic or Latino residents45.9 46.8
Owner/renter occupied households by race in Coral Gables
House owners and renters - White residents 4,484 65.4% Owner occupied2,368 34.6% Renter occupiedHouse owners and renters - Black or African American residents 115 41.3% Owner occupied164 58.7% Renter occupiedHouse owners and renters - Asian residents 278 46.9% Owner occupied315 53.1% Renter occupiedHouse owners and renters - Other race residents 264 38.0% Owner occupied431 62.0% Renter occupiedHouse owners and renters - Two or more races residents 7,463 71.5% Owner occupied2,979 28.5% Renter occupiedHouse owners and renters - White alone residents 3,816 61.4% Owner occupied2,403 38.6% Renter occupiedHouse owners and renters - Hispanic or Latino residents 8,140 67.5% Owner occupied3,927 32.5% Renter occupied
Language usage in Coral Gables
English speakers - Total 38.6% of residents of Coral Gables speak English at home.
53.0% of residents speak Spanish at home 18,711 75.2% Speak English very well6,156 24.8% Speak English less than very well8.0% of residents speak other language at home 2,910 77.3% Speak English very well854 22.7% Speak English less than very well
English speakers - Born in the United States 75.6% of residents of Coral Gables speak English at home.
19.8% of residents speak Spanish at home 2,337 92.6% Speak English very well188 7.4% Speak English less than very well4.7% of residents speak other language at home 523 88.2% Speak English very well70 11.8% Speak English less than very well
English speakers - Native, born elsewhere 29.6% of residents of Coral Gables speak English at home.
68.0% of residents speak Spanish at home 1,135 83.3% Speak English very well228 16.7% Speak English less than very well2.2% of residents speak other language at home 32 72.7% Speak English very well12 27.3% Speak English less than very well
English speakers - Foreign-born 8.5% of residents of Coral Gables speak English at home.
76.6% of residents speak Spanish at home 9,763 66.4% Speak English very well4,936 33.6% Speak English less than very well13.9% of residents speak other language at home 1,901 71.4% Speak English very well763 28.6% Speak English less than very well
White (Caucasian) - Speak only English Native:
84.7% (12,106)Foreign-born:
13.5% (547)
White (Caucasian) - Speak another language Native:
25.6% (3,665)Foreign-born:
87.9% (3,571)
Black or African American - Speak only English Native:
89.3% (1,511)Foreign-born:
37.6% (60)
Black or African American - Speak another language Native:
10.7% (181)Foreign-born:
63.4% (101)
Asian - Speak only English Native:
63.2% (362)Foreign-born:
27.5% (335)
Asian - Speak another language Native:
37.2% (213)Foreign-born:
70.8% (861)
Other race - Speak only English Native:
34.4% (244)Foreign-born:
3.9% (43)
Other race - Speak another language Native:
65.7% (466)Foreign-born:
96.1% (1,054)
Two or more races - Speak only English Native:
22.5% (2,050)Foreign-born:
3.5% (426)
Two or more races - Speak another language Native:
77.4% (7,034)Foreign-born:
96.4% (11,720)
White alone - Speak only English Native:
89.5% (11,337)Foreign-born:
27.2% (574)
White alone - Speak another language Native:
11.4% (1,439)Foreign-born:
73.0% (1,540)
Hispanic or Latino - Speak only English Native:
23.9% (2,891)Foreign-born:
3.9% (598)
Hispanic or Latino - Speak another language Native:
76.4% (9,258)Foreign-born:
96.1% (14,718)
Foreign-born residents in Coral Gables 19,343 residents are foreign born (31.9% Latin America ).
This city:
39.1%Florida:
21.1%
Marital status for residents in Coral Gables Marital status - White (Caucasian) population 15 years and over
Males 37.8% Never married53.1% Now married1.2% Separated2.4% Widowed5.5% DivorcedFemales 39.4% Never married42.1% Now married0.8% Separated7.3% Widowed10.4% DivorcedWomen who gave birth in the past 12 months Now married:
91.3% (115)Unmarried:
8.7% (11)
Women who did not give birth in the past 12 months Now married:
31.2% (1,364)Unmarried:
68.8% (3,013)
Marital status - Black or African American population 15 years and over
Males 73.6% Never married21.5% Now married4.1% Separated0.0% Widowed0.7% DivorcedFemales 79.7% Never married15.3% Now married0.5% Separated4.3% Widowed0.2% DivorcedWomen who gave birth in the past 12 months Now married:
0.0% (0)Unmarried:
100.0% (2)
Women who did not give birth in the past 12 months Now married:
8.0% (63)Unmarried:
92.0% (729)
Marital status - Asian population 15 years and over
Males 51.5% Never married46.4% Now married2.1% Separated0.0% Widowed0.0% DivorcedFemales 54.1% Never married34.8% Now married0.0% Separated1.4% Widowed9.7% DivorcedWomen who gave birth in the past 12 months Now married:
100.0% (13)Unmarried:
0.0% (0)
Women who did not give birth in the past 12 months Now married:
21.6% (148)Unmarried:
78.4% (538)
Marital status - Other race population 15 years and over
Males 38.7% Never married57.7% Now married0.0% Separated0.0% Widowed3.6% DivorcedFemales 35.3% Never married46.2% Now married0.0% Separated2.7% Widowed15.8% DivorcedWomen who gave birth in the past 12 months Now married:
100.0% (36)Unmarried:
0.0% (0)
Women who did not give birth in the past 12 months Now married:
49.9% (304)Unmarried:
50.1% (305)
Marital status - Two or more races population 15 years and over
Males 35.1% Never married50.1% Now married0.5% Separated2.2% Widowed12.0% DivorcedFemales 28.0% Never married41.7% Now married1.2% Separated17.4% Widowed11.8% DivorcedWomen who gave birth in the past 12 months Now married:
89.0% (103)Unmarried:
11.0% (13)
Women who did not give birth in the past 12 months Now married:
35.3% (1,559)Unmarried:
64.7% (2,855)
Marital status - White alone, not Hispanic / Latino population 15 years and over
Males 43.7% Never married47.7% Now married1.4% Separated2.0% Widowed5.2% DivorcedFemales 47.2% Never married36.4% Now married0.3% Separated8.4% Widowed7.7% DivorcedWomen who gave birth in the past 12 months Now married:
85.9% (70)Unmarried:
14.1% (12)
Women who did not give birth in the past 12 months Now married:
23.6% (961)Unmarried:
76.4% (3,115)
Marital status - Hispanic or Latino population 15 years and over
Males 32.5% Never married56.5% Now married0.7% Separated2.5% Widowed7.8% DivorcedFemales 30.0% Never married44.9% Now married1.3% Separated11.1% Widowed12.6% DivorcedWomen who gave birth in the past 12 months Now married:
92.0% (200)Unmarried:
8.0% (18)
Women who did not give birth in the past 12 months Now married:
38.2% (2,553)Unmarried:
61.8% (4,123)
Ancestries in Coral Gables
1,111 4.1% American964 3.6% Italian555 2.1% German542 2.0% English401 1.5% European353 1.3% Irish276 1.0% Brazilian264 1.0% French255 0.9% British240 0.9% Polish207 0.8% Lebanese201 0.7% Russian145 0.5% Greek145 0.5% Iranian132 0.5% Portuguese113 0.4% Eastern European109 0.4% Swiss84 0.3% French Canadian76 0.3% Scottish71 0.3% Austrian59 0.2% Turkish54 0.2% Belgian50 0.2% Arab44 0.2% Iraqi43 0.2% Welsh41 0.2% Canadian39 0.1% Guyanese38 0.1% West Indian37 0.1% Romanian36 0.1% African33 0.1% Ukrainian32 0.1% Israeli32 0.1% Dutch29 0.1% Swedish25 0.09% Northern European25 0.09% Haitian22 0.08% Moroccan22 0.08% Scotch-Irish22 0.08% Yugoslavian21 0.08% Latvian21 0.08% Bulgarian21 0.08% Jamaican17 0.06% Trinidadian and Tobagonian17 0.06% Bahamian16 0.06% Scandinavian16 0.06% Sudanese15 0.06% Norwegian14 0.05% Hungarian14 0.05% Kenyan13 0.05% Slovak11 0.04% Armenian7 0.03% South African6 0.02% Slavic6 0.02% British West Indian4 0.01% Czech
Geographical mobility in Coral Gables Same house 1 year ago 13,561 78.0% White (Caucasian)1,162 62.6% Black or African American1,074 59.3% Asian1,561 81.5% Other race18,954 85.5% Two or more races11,451 73.3% White alone, not Hispanic / Latino24,558 86.2% Hispanic or LatinoMoved within same county 1,877 10.8% White / Caucasian190 10.2% Black or African American196 10.8% Asian126 6.6% Other race1,923 8.7% Two or more races1,988 12.7% White alone, not Hispanic / Latino2,405 8.4% Hispanic or LatinoMoved within same state 607 3.5% White / Caucasian154 8.3% Black or African American184 10.1% Asian141 0.6% Two or more races506 3.2% White alone, not Hispanic / Latino356 1.2% Hispanic or LatinoMoved from different state 1,507 8.7% White / Caucasian379 20.4% Black or African American13 78.3% American Indian / Alaska Native142 7.9% Asian212 11.1% Other race376 1.7% Two or more races1,578 10.1% White alone, not Hispanic / Latino350 1.2% Hispanic or LatinoMoved from abroad 479 2.8% White30 1.6% Black or African American291 16.1% Asian31 1.6% Other race518 2.3% Two or more races361 2.3% White alone, not Hispanic / Latino629 2.2% Hispanic or Latino
Children Nativity (place of birth) in Coral Gables
Children under 6 years - Living with two parents Both parents native 980 100.0% NativeBoth parents foreign-born 483 83.3% Native97 16.7% Foreign-bornOne native, one foreign-born parent 853 100.0% NativeChildren under 6 years - Living with one parent Native parent 288 100.0% NativeForeign-born parent 78 100.0% NativeChildren 6 to 17 years - Living with two parents Both parents native 1,505 97.7% Native35 2.3% Foreign-bornBoth parents foreign-born 810 60.6% Native526 39.4% Foreign-bornOne native, one foreign-born parent 1,000 95.0% Native53 5.0% Foreign-bornChildren 6 to 17 years - Living with one parent Native parent 559 100.0% NativeForeign-born parent 484 60.1% Native322 39.9% Foreign-born
Place of birth for residents in Coral Gables 16,093 Americas15,865 Latin America7,799 Caribbean6,053 South America2,013 Central America1,772 Europe1,402 Asia775 Southern Europe590 Eastern Asia474 China433 Western Europe356 South Central Asia321 Northern Europe253 Western Asia241 Eastern Europe227 Northern America201 South Eastern Asia53 Africa20 Western Africa19 Northern Africa19 Oceania19 Australia and New Zealand Subregion8 Eastern Africa3 Southern Africa7,149 Cuba2,425 Venezuela1,505 Colombia849 Mexico619 Argentina619 Brazil565 Nicaragua541 Spain408 China381 Dominican Republic323 Peru295 India241 Ecuador227 Canada213 France192 Italy170 Jamaica160 Panama143 Costa Rica133 Guatemala129 United Kingdom126 Chile120 England108 Korea106 Bolivia91 Philippines86 Honduras69 Russia65 Taiwan65 Turkey60 Belgium60 Iran60 El Salvador59 Switzerland57 Lebanon56 Romania44 Germany44 Vietnam40 Kuwait39 Israel33 Austria33 Hungary31 Denmark29 Ukraine29 Haiti28 Bahamas28 Greece26 Indonesia22 Iraq20 Nigeria20 Singapore19 Morocco19 Australia19 Czechoslovakia19 Netherlands16 Scotland15 Uruguay14 Thailand12 Bulgaria11 Portugal11 Belize10 Poland10 Trinidad and Tobago10 Sweden10 Ireland8 Kenya7 Azerbaijan7 Guyana6 Japan6 Croatia6 Saudi Arabia3 South Africa1 Malaysia
Grandparents responsible for own grandchildren in Coral Gables
Grandparents (30 to 59 years) White / Caucasian 9 100.0% Not responsible for grandchildrenTwo or more races 49 100.0% Responsible for grandchildrenHispanic or Latino 26 65.4% Responsible for grandchildren14 34.6% Not responsible for grandchildrenGrandparents (60 years and over) White / Caucasian 27 25.8% Responsible for grandchildren76 74.2% Not responsible for grandchildrenTwo or more races 206 100.0% Not responsible for grandchildrenHispanic or Latino 21 11.2% Responsible for grandchildren164 88.8% Not responsible for grandchildren