Coral Gables, Florida
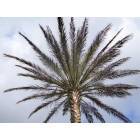
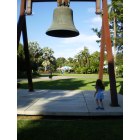
Coral Gables: skyrocket
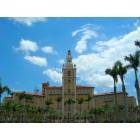
Coral Gables: The Biltmore Hotel
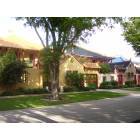
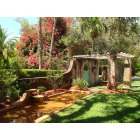
Coral Gables: Asian home Coral Gables
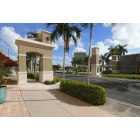
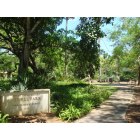
Coral Gables: Ponce Entrance

Coral Gables: January Farmers' Market
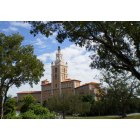
Coral Gables: Biltmore Hotel looking from Malaga Avenue
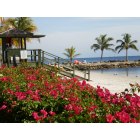
Coral Gables: Matheson Hammock
Coral Gables: Coral Way and Granada Boulevards meet
Coral Gables: Fewell Park on Coral Way
Coral Gables: Fairchild Tropical Garden
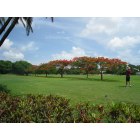
Coral Gables: Granada Golf Course
- see
23
more - add
your


Submit your own pictures of this city and show them to the world
- OSM Map
- General Map
- Google Map
- MSN Map
Population change since 2000: +16.4%
 |
| Males: 22,956 | |
| Females: 26,237 |
| Median resident age: | 39.6 years |
| Florida median age: | 42.7 years |
Zip codes: 33133, 33134, 33135, 33143, 33146, 33155, 33156, 33157, 33158.
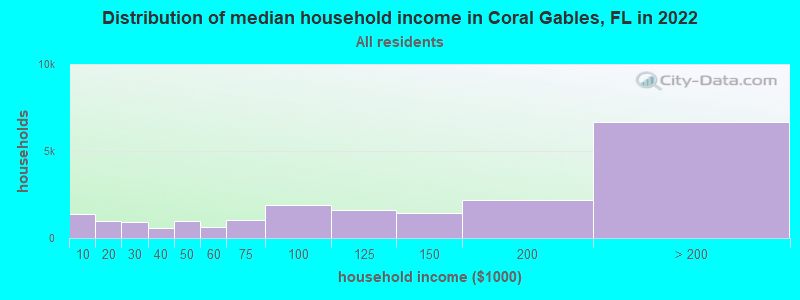
Coral Gables Zip Code Map| Coral Gables: | $123,814 |
| FL: | $69,303 |
Estimated per capita income in 2022: $80,035 (it was $46,163 in 2000)
Coral Gables city income, earnings, and wages data
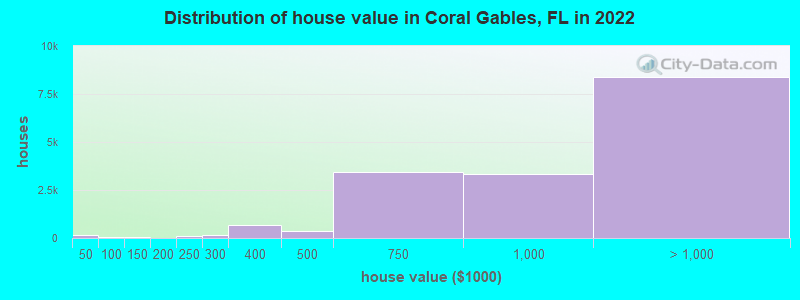
Estimated median house or condo value in 2022: over $1,000,000 (it was $314,800 in 2000)
| Coral Gables: | over $1,000,000 |
| FL: | $354,100 |
Mean prices in 2022: all housing units: over $1,000,000; detached houses: over $1,000,000; townhouses or other attached units: over $1,000,000; in 2-unit structures: $799,515; in 3-to-4-unit structures: $600,065; in 5-or-more-unit structures: over $1,000,000; mobile homes: $98,211
Median gross rent in 2022: $2,004.
(8.6% for White Non-Hispanic residents, 48.7% for Black residents, 8.0% for Hispanic or Latino residents, 11.4% for other race residents, 7.3% for two or more races residents)
Detailed information about poverty and poor residents in Coral Gables, FL


- 28,61557.9%Hispanic
- 15,83732.0%White alone
- 1,7313.5%Asian alone
- 1,6663.4%Black alone
- 1,2312.5%Two or more races
- 3360.7%Other race alone
- 90.02%American Indian alone
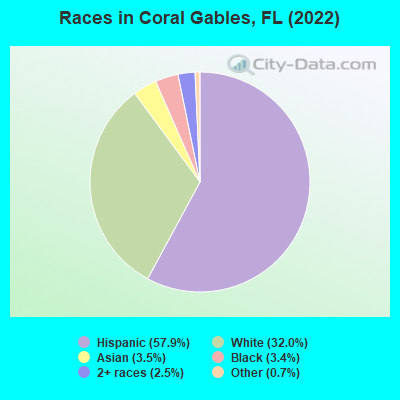
Races in Coral Gables detailed stats: ancestries, foreign born residents, place of birth
According to our research of Florida and other state lists, there were 10 registered sex offenders living in Coral Gables, Florida as of April 26, 2024.
The ratio of all residents to sex offenders in Coral Gables is 5,145 to 1.
The ratio of registered sex offenders to all residents in this city is much lower than the state average.
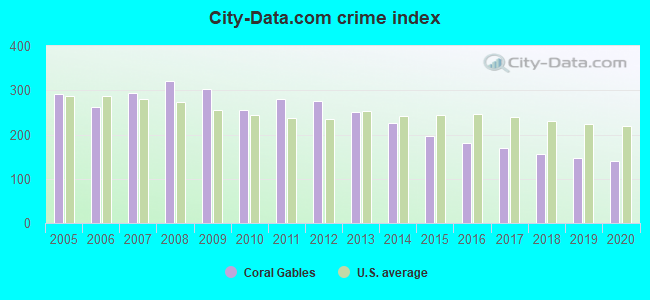
The City-Data.com crime index weighs serious crimes and violent crimes more heavily. Higher means more crime, U.S. average is 246.1. It adjusts for the number of visitors and daily workers commuting into cities.
- means the value is smaller than the state average.- means the value is about the same as the state average.
- means the value is bigger than the state average.
- means the value is much bigger than the state average.
Crime rate in Coral Gables detailed stats: murders, rapes, robberies, assaults, burglaries, thefts, arson
Full-time law enforcement employees in 2021, including police officers: 283 (193 officers - 158 male; 35 female).
| Officers per 1,000 residents here: | 3.91 |
| Florida average: | 2.33 |
 Recent articles from our blog. Our writers, many of them Ph.D. graduates or candidates, create easy-to-read articles on a wide variety of topics.


Latest news from Coral Gables, FL collected exclusively by city-data.com from local newspapers, TV, and radio stations
Ancestries: American (5.1%), Italian (2.9%), German (1.7%), European (1.5%), Irish (1.3%), British (1.2%).
Current Local Time: EST time zone
Elevation: 10 feet
Land area: 13.1 square miles.
Population density: 3,746 people per square mile (average).
19,343 residents are foreign born (31.9% Latin America).
| This city: | 39.1% |
| Florida: | 21.1% |
Median real estate property taxes paid for housing units with mortgages in 2022: $10,286 (0.9%)
Median real estate property taxes paid for housing units with no mortgage in 2022: $8,628 (0.8%)
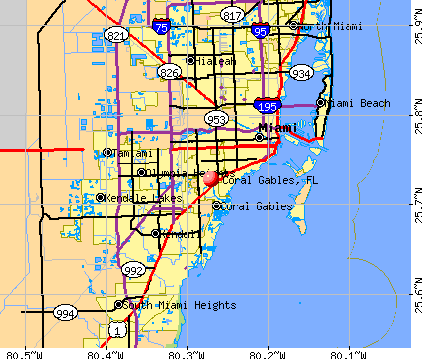
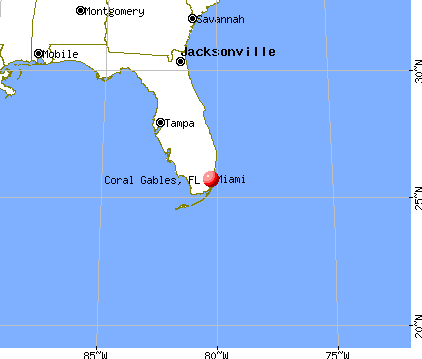
Nearest city with pop. 50,000+: Miami, FL  (5.0 miles , pop. 362,470).
Nearest city with pop. 1,000,000+: Houston, TX (965.4 miles , pop. 1,953,631).
Nearest cities:
), ), ), ), ), ), Latitude: 25.73 N, Longitude: 80.27 W
Daytime population change due to commuting: +30,467 (+61.6%)
Workers who live and work in this city: 10,282 (44.8%)
Property values in Coral Gables, FL
Coral Gables tourist attractions:
- Miracle Mile - Coral Gables, Florida - Outdoors Shopping, Food, Entertainment
- Fairchild Tropical Botanic Garden is a Coral Gables Favorite
- Hyatt Regency Coral Gables
- The Westin Colonnade Coral Gables
- Biltmore Hotel
- Razzledazzle
- Alhambra Water Tower
- Coral Gables City Hall
- Coral Gables Merrick House and Gardens
- Florida Philharmonic Orchestra
- Lowe Art Museum
- Matheson Hammock Park
- The Venetian Pool in Coral Gables is a Unique Historic Attraction
Coral Gables, Florida accommodation & food services, waste management - Economy and Business Data
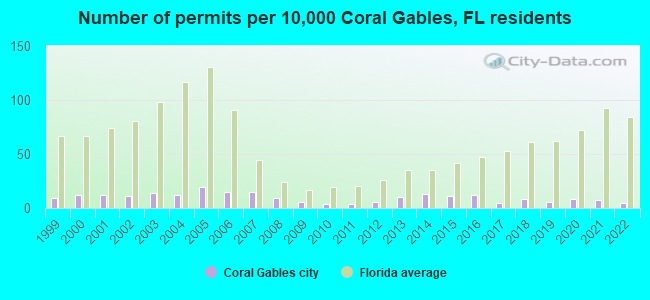
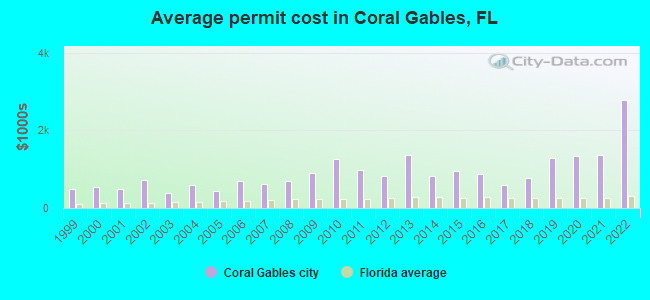
Single-family new house construction building permits:
- 2022: 20 buildings, average cost: $2,779,600
- 2021: 28 buildings, average cost: $1,376,300
- 2020: 33 buildings, average cost: $1,334,500
- 2019: 26 buildings, average cost: $1,296,300
- 2018: 35 buildings, average cost: $770,800
- 2017: 21 buildings, average cost: $598,300
- 2016: 49 buildings, average cost: $877,200
- 2015: 48 buildings, average cost: $945,000
- 2014: 56 buildings, average cost: $820,700
- 2013: 41 buildings, average cost: $1,356,500
- 2012: 27 buildings, average cost: $836,400
- 2011: 16 buildings, average cost: $973,500
- 2010: 17 buildings, average cost: $1,257,800
- 2009: 25 buildings, average cost: $902,200
- 2008: 38 buildings, average cost: $687,100
- 2007: 63 buildings, average cost: $628,300
- 2006: 63 buildings, average cost: $691,200
- 2005: 82 buildings, average cost: $438,600
- 2004: 50 buildings, average cost: $590,300
- 2003: 61 buildings, average cost: $391,000
- 2002: 45 buildings, average cost: $724,500
- 2001: 52 buildings, average cost: $499,800
- 2000: 50 buildings, average cost: $552,300
- 1999: 37 buildings, average cost: $493,800
| Here: | 1.6% |
| Florida: | 2.9% |
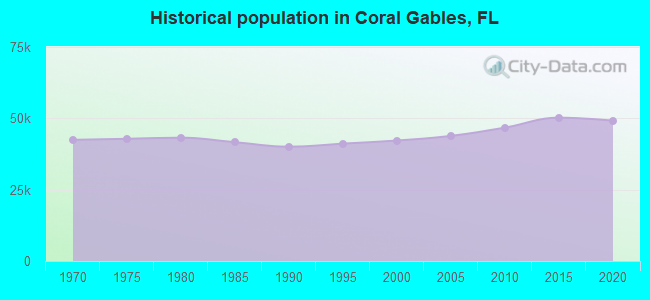
Population change in the 1990s: +614 (+1.5%).
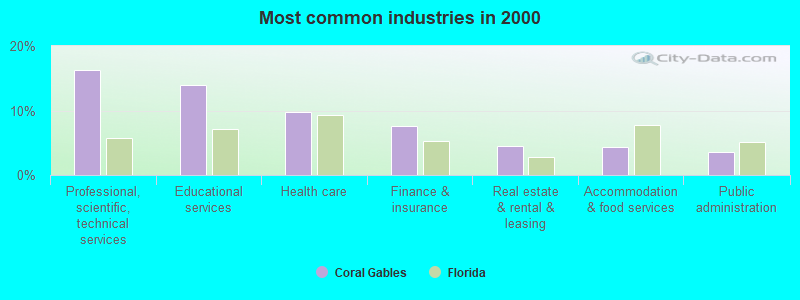
- Professional, scientific, technical services (16.4%)
- Educational services (14.0%)
- Health care (9.7%)
- Finance & insurance (7.5%)
- Real estate & rental & leasing (4.6%)
- Accommodation & food services (4.3%)
- Public administration (3.5%)
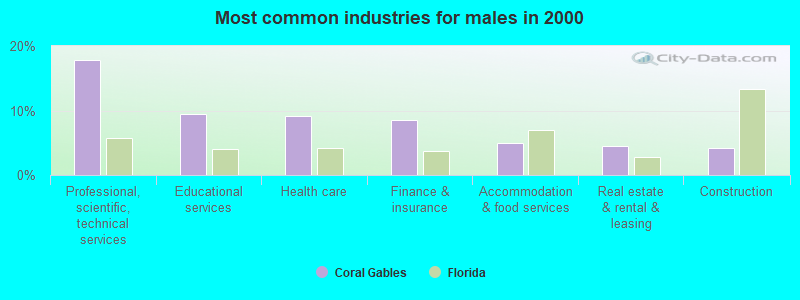
- Professional, scientific, technical services (17.9%)
- Educational services (9.4%)
- Health care (9.1%)
- Finance & insurance (8.5%)
- Accommodation & food services (4.9%)
- Real estate & rental & leasing (4.5%)
- Construction (4.1%)
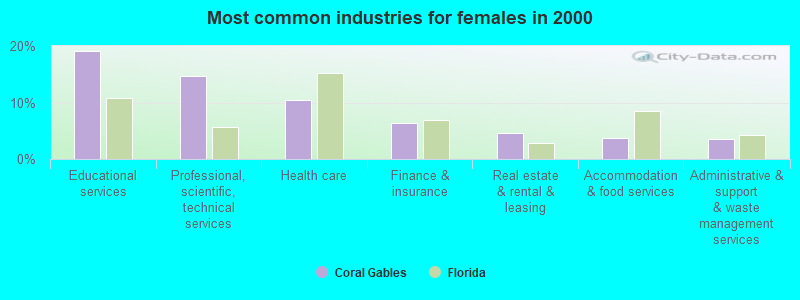
- Educational services (19.2%)
- Professional, scientific, technical services (14.6%)
- Health care (10.4%)
- Finance & insurance (6.4%)
- Real estate & rental & leasing (4.7%)
- Accommodation & food services (3.7%)
- Administrative & support & waste management services (3.5%)
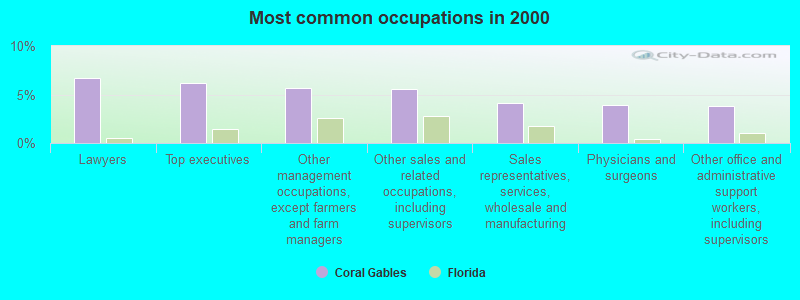
- Lawyers (6.8%)
- Top executives (6.1%)
- Other management occupations, except farmers and farm managers (5.7%)
- Other sales and related occupations, including supervisors (5.6%)
- Sales representatives, services, wholesale and manufacturing (4.1%)
- Physicians and surgeons (3.9%)
- Other office and administrative support workers, including supervisors (3.8%)
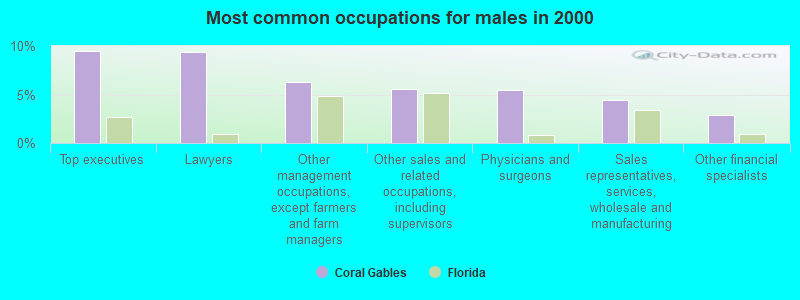
- Top executives (9.5%)
- Lawyers (9.4%)
- Other management occupations, except farmers and farm managers (6.3%)
- Other sales and related occupations, including supervisors (5.5%)
- Physicians and surgeons (5.4%)
- Sales representatives, services, wholesale and manufacturing (4.4%)
- Other financial specialists (2.9%)
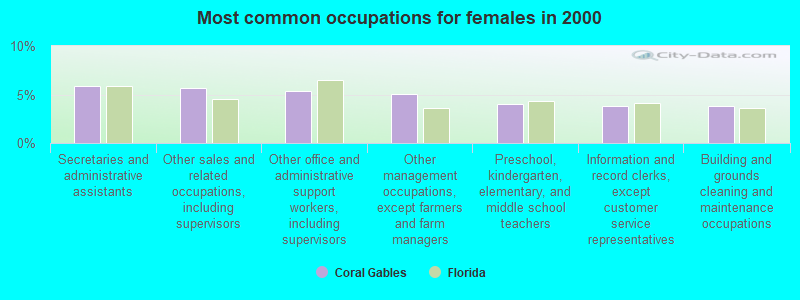
- Secretaries and administrative assistants (5.9%)
- Other sales and related occupations, including supervisors (5.7%)
- Other office and administrative support workers, including supervisors (5.4%)
- Other management occupations, except farmers and farm managers (5.0%)
- Preschool, kindergarten, elementary, and middle school teachers (4.0%)
- Information and record clerks, except customer service representatives (3.9%)
- Building and grounds cleaning and maintenance occupations (3.8%)
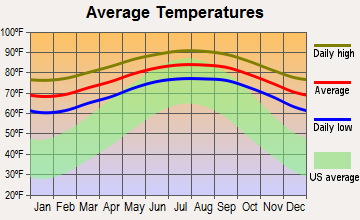
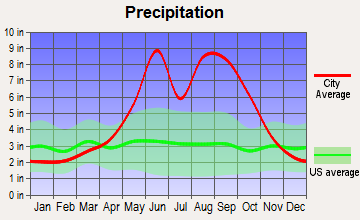
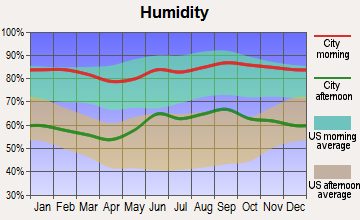
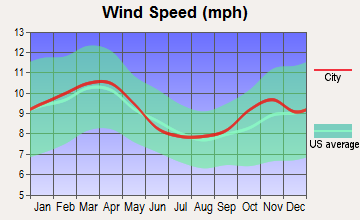
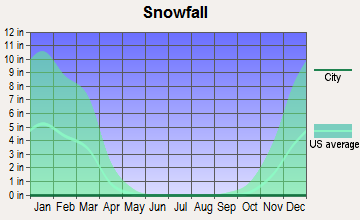
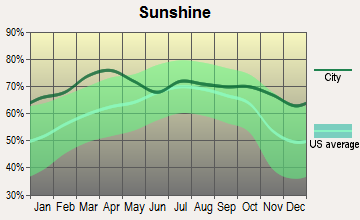
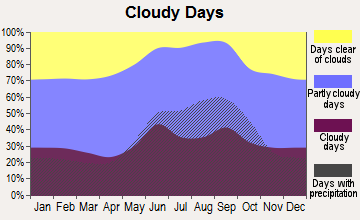
Average climate in Coral Gables, Florida
Based on data reported by over 4,000 weather stations
|
|

(lower is better)
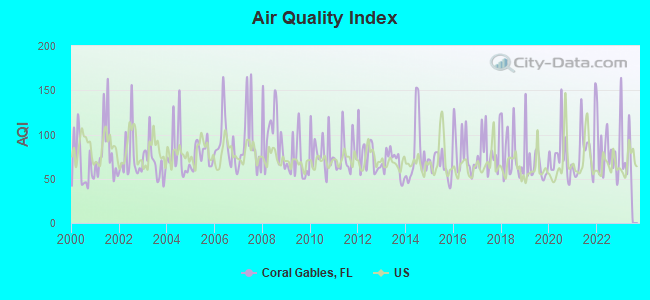
Air Quality Index (AQI) level in 2022 was 79.1. This is about average.
| City: | 79.1 |
| U.S.: | 72.6 |
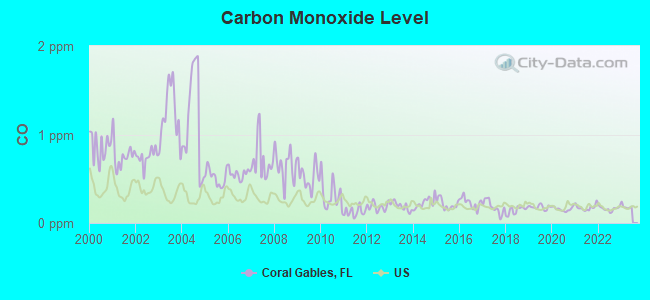
Carbon Monoxide (CO) [ppm] level in 2022 was 0.162. This is significantly better than average. Closest monitor was 0.4 miles away from the city center.
| City: | 0.162 |
| U.S.: | 0.251 |
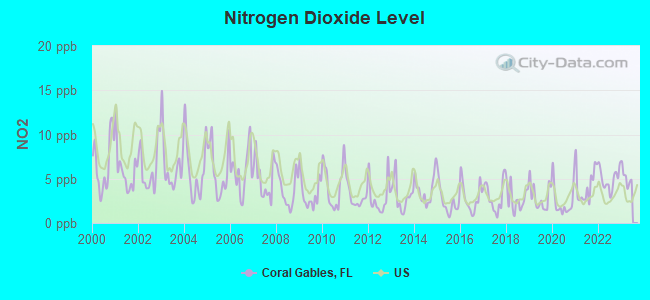
Nitrogen Dioxide (NO2) [ppb] level in 2022 was 4.95. This is about average. Closest monitor was 4.6 miles away from the city center.
| City: | 4.95 |
| U.S.: | 5.11 |
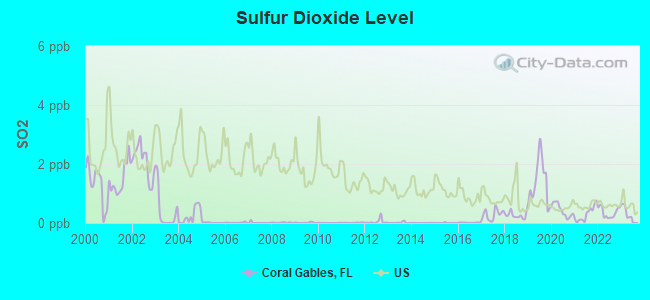
Sulfur Dioxide (SO2) [ppb] level in 2022 was 0.354. This is significantly better than average. Closest monitor was 4.6 miles away from the city center.
| City: | 0.354 |
| U.S.: | 1.515 |
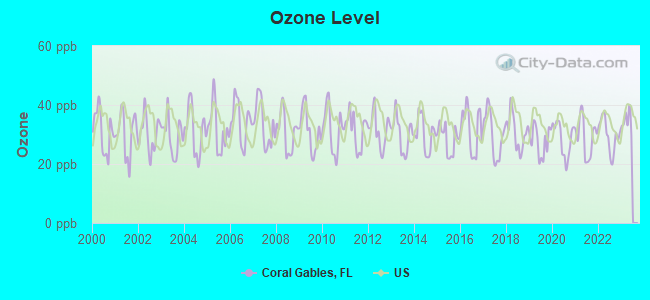
Ozone [ppb] level in 2022 was 29.8. This is about average. Closest monitor was 6.2 miles away from the city center.
| City: | 29.8 |
| U.S.: | 33.3 |
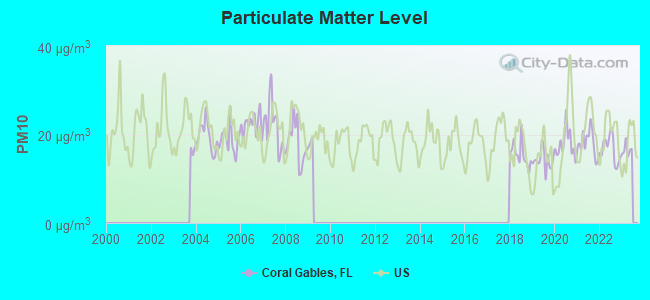
Particulate Matter (PM10) [µg/m3] level in 2022 was 16.7. This is about average. Closest monitor was 5.9 miles away from the city center.
| City: | 16.7 |
| U.S.: | 19.2 |
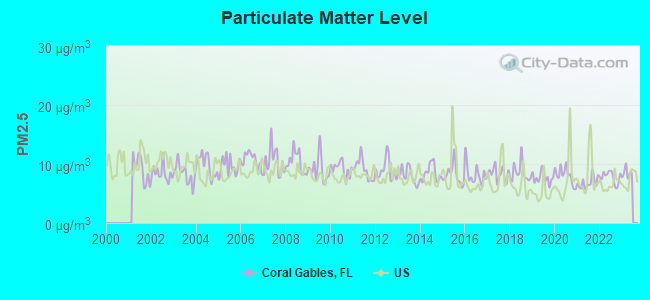
Particulate Matter (PM2.5) [µg/m3] level in 2022 was 7.76. This is about average. Closest monitor was 5.7 miles away from the city center.
| City: | 7.76 |
| U.S.: | 8.11 |
Tornado activity:
Coral Gables-area historical tornado activity is below Florida state average. It is 39% smaller than the overall U.S. average.
On 6/17/1959, a category F3 (max. wind speeds 158-206 mph) tornado 0.6 miles away from the Coral Gables city center injured 77 people and caused between $500,000 and $5,000,000 in damages.
On 4/10/1956, a category F3 tornado 19.0 miles away from the city center injured 20 people and caused between $500,000 and $5,000,000 in damages.
Earthquake activity:
Coral Gables-area historical earthquake activity is significantly below Florida state average. It is 99% smaller than the overall U.S. average.On 9/10/2006 at 14:56:08, a magnitude 5.9 (5.9 MB, 5.5 MS, 5.8 MW, Class: Moderate, Intensity: VI - VII) earthquake occurred 397.0 miles away from the city center
On 2/22/1992 at 04:21:34, a magnitude 3.2 (3.2 MB, Depth: 6.2 mi, Class: Light, Intensity: II - III) earthquake occurred 96.3 miles away from Coral Gables center
On 6/23/2016 at 17:20:29, a magnitude 3.8 (3.8 ML) earthquake occurred 299.4 miles away from Coral Gables center
On 7/16/2016 at 20:00:10, a magnitude 3.7 (3.7 MB) earthquake occurred 283.9 miles away from Coral Gables center
On 9/21/2016 at 16:30:52, a magnitude 3.8 (3.8 ML) earthquake occurred 304.2 miles away from Coral Gables center
On 9/4/2016 at 18:29:29, a magnitude 3.8 (3.8 ML) earthquake occurred 305.3 miles away from Coral Gables center
Magnitude types: body-wave magnitude (MB), local magnitude (ML), surface-wave magnitude (MS), moment magnitude (MW)
Natural disasters:
The number of natural disasters in Miami-Dade County (10) is smaller than the US average (15).Major Disasters (Presidential) Declared: 5
Emergencies Declared: 3
Causes of natural disasters: Hurricanes: 7, Tropical Storms: 2, Tornado: 1, Other: 1 (Note: some incidents may be assigned to more than one category).
Main business address for: NATIONAL RESIDENTIAL PROPERTIES NV INC (GEN BUILDING CONTRACTORS - RESIDENTIAL BUILDINGS), AVATAR HOLDINGS INC (OPERATIVE BUILDERS), BANKUNITED FINANCIAL CORP (SAVINGS INSTITUTION, FEDERALLY CHARTERED), MASTEC INC (WATER, SEWER, PIPELINE, COMM AND POWER LINE CONSTRUCTION), STEINER LEISURE LTD (SERVICES-PERSONAL SERVICES), RICA FOODS INC (POULTRY SLAUGHTERING AND PROCESSING).
Hospitals in Coral Gables:
- CORAL GABLES HOSPITAL (Proprietary, provides emergency services, 3100 DOUGLAS RD)
- DOCTORS HOSPITAL INC (Voluntary non-profit - Other, provides emergency services, 5000 UNIVERSITY DR)
- VENCOR HOSPITAL CORAL GABLES (5190 SW 8TH STREET)
Home Health Centers in Coral Gables:
- CORAL HOME CARE INC (1149 SW 27TH AVE SUITE 303)
- FATIMA HOME CARE (1454 SW 1ST ST SUITE 120)
- FINETECH HOME HEALTH INC (1350 SW 57TH AVENUE STE 208)
- GABLES HOME HEALTH INC (3446 SW 8TH ST SUITE 209)
- LONG LIFE HOME CARE INC (5545 SW 8TH ST STE 202)
- MED-CARE HOME HEALTH SVCS (760 PONCE DE LEON BLVD STE 102)
- OCHA HOME HEALTH SERVICES CORP (5545 SW 18TH STREET SUITE 107)
- REGION HEALTH (1000 PONCE DE LEON BLVD STE 312)
- ST FRANCIS HOME HEALTH INC (3735 SW 8 STREET, SUITE 205)
- USA HOME CARE SOLUTIONS AGENCY CORP (145 MADEIRA AVE STE 205)
Nursing Homes in Coral Gables:
Amtrak stations near Coral Gables:
- 5 miles: MIAMI INT'L AIRPORT (MIAMI, TRANSIT BUS LOADING AREA) - Bus Station
- 9 miles: MIAMI (8303 N.W. 37TH AVE.) . Services: ticket office, fully wheelchair accessible, enclosed waiting area, public restrooms, public payphones, vending machines, free short-term parking, call for car rental service, taxi stand, public transit connection.
College/University in Coral Gables:
Other colleges/universities with over 2000 students near Coral Gables:
- Miami Dade College (about 7 miles; Miami, FL; Full-time enrollment: 53,787)
- Florida Career College-Miami (about 7 miles; Miami, FL; FT enrollment: 10,133)
- AI Miami International University of Art and Design (about 7 miles; Miami, FL; FT enrollment: 3,578)
- Florida International University (about 7 miles; Miami, FL; FT enrollment: 41,234)
- Florida National University-Main Campus (about 10 miles; Hialeah, FL; FT enrollment: 4,106)
- Barry University (about 12 miles; Miami, FL; FT enrollment: 7,181)
- Johnson & Wales University-North Miami (about 14 miles; North Miami, FL; FT enrollment: 2,051)
Public high schools in Coral Gables:
- CORAL GABLES SENIOR HIGH SCHOOL (Students: 231, Location: 450 BIRD RD, Grades: 9-12)
- INTERNATIONAL STUDIES PREPARATORY ACADEMY (Location: 1570 MADRUGA AVE, Grades: 9-12)
Private high school in Coral Gables:
Public elementary/middle schools in Coral Gables:
- GEORGE W. CARVER ELEMENTARY SCHOOL (Students: 1,333, Location: 238 GRAND AVE, Grades: PK-5)
- PONCE DE LEON MIDDLE SCHOOL (Students: 1,181, Location: 5801 AUGUSTO ST, Grades: 6-8)
- GEORGE WASHINGTON CARVER MIDDLE SCHOOL (Students: 992, Location: 4901 LINCOLN DR, Grades: 6-8)
- HENRY S. WEST LABORATORY SCHOOL (Students: 123, Location: 5300 CARILLO ST, Grades: PK-6)
- CORAL GABLES PREPARATORY ACADEMY (Location: 105 MINORCA AVE, Grades: PK-8)
- SOMERSET GABLES ACADEMY (Location: 624 ANASTASIA AVE, Grades: KG-6, Charter school)
Private elementary/middle schools in Coral Gables:
- GULLIVER ACADEMY (Students: 1,098, Location: 12595 SW 57TH AVE, Grades: PK-8)
- ST THERESA SCHOOL (Students: 883, Location: 2701 INDIAN MOUND TRL, Grades: PK-8)
- ST THOMAS EPISCOPAL PARISH SCHOOL (Students: 425, Location: 5692 N KENDALL DR, Grades: PK-5)
- INTERNATIONAL CHRISTIAN SCHOOL-CORAL GABLES (Students: 60, Location: 414 VELARDE AVE, Grades: PK-1)
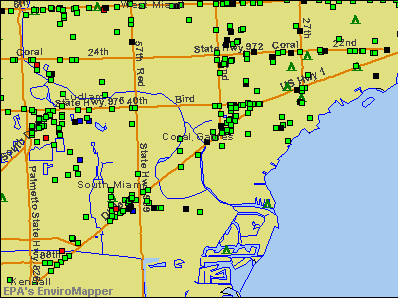
Points of interest:
Notable locations in Coral Gables: Cocoplum Plaza (A), Granada Golf Course (B), Cimarrone Golf Club (C), Champions Club at Summerfield (D), Champions Club at Julington Creek (E), Kings Bay Country Club (F), Isla Marina (G), Perrine Plaza (H), Biltmore Golf Course (I), Matheson Hammock Marina (J), Village of Merrick Park (K), Coral Gables Youth Center (L), University Station (M), Ara Gallery Cultural Center (N), University of Miami Canterbury Child Care Center (O), University Baptist Child Development Center (P), The Growing Place Day Care Center (Q), University of Miami (R), Saint Alban's Day Nursery (S), Ring Theater (T). Display/hide their locations on the map
Shopping Centers: West Miami Shopping Center (1), Suniland Shopping Center (2), South Miami Shopping Center (3). Display/hide their locations on the map
Main business address in Coral Gables include: NATIONAL RESIDENTIAL PROPERTIES NV INC (A), AVATAR HOLDINGS INC (B), BANKUNITED FINANCIAL CORP (C), MASTEC INC (D), STEINER LEISURE LTD (E), RICA FOODS INC (F). Display/hide their locations on the map
Churches in Coral Gables include: Saint Thomas Church (A), Temple Judea (B), El Redentor Presbyterian Church (C), Saint Athanasios Greek Orthodox Church (D), Unity Center of Practical Christianity (E), Saint Germain Foundation (F). Display/hide their locations on the map
Lakes and reservoirs: Lago Maggiore (A), Lago Minore (B), Lago Monaco (C), University Lake (D), Hammock Lake (E), Ixlater Lake (F), Venetian Pool (G). Display/hide their locations on the map
Parks in Coral Gables include: Fairchild Tropical Garden (1), Phillips Park (2), I T T - Snapper Creek Park (3), Chapman Field Park (4), Banyan Drive Park (5), Sunrise Park (6), Cartagena Plaza (7), Ingraham Terrace (8), Gifford Arboretum (9). Display/hide their locations on the map
Tourist attractions: Casa Bacardi (Museums; 1531 Brescia Ave) (1), Coral Way Antiques (Museums; 3131 Coral Way) (2), Cuban Museum Inc (214 Giralda Avenue) (3), Centro Cultural Espanol de Cooperacion IBRO Amrcna (Museums; 800 South Douglas Road Suite 170) (4). Display/hide their approximate locations on the map
Hotels: Biltmore Hotel (1200 Anastasia Avenue) (1), Burke's Motel (4445 Southwest 8th Street) (2), Colonade Hotel (180 Aragon Ave) (3), Best Western Chateaubleau Hotel (1111 Ponce De Leon Boulevard) (4). Display/hide their approximate locations on the map
Birthplace of: Bob Graham - Politician, Bob Lazar - Photo processor, Gail Edwards - Actress, Thurston Moore - Experimental musician, Carlos Huerta - College football player, Frank Gore - 2005 NFL player (San Francisco 49ers, born: May 14, 1983), Jonathan Vilma - 2005 NFL player (New York Jets, born: Apr 16, 1982), Mimi Rogers - (born 1956), actress, Pat Ruel - Football player and coach, Chris Corchiani - Basketball player.
| This city: | 2.4 people |
| Florida: | 2.5 people |
| This city: | 62.4% |
| Whole state: | 65.2% |
| This city: | 5.2% |
| Whole state: | 7.3% |
Likely homosexual households (counted as self-reported same-sex unmarried-partner households)
- Lesbian couples: 0.5% of all households
- Gay men: 0.8% of all households
People in group quarters in Coral Gables in 2010:
- 4,510 people in college/university student housing
- 11 people in group homes intended for adults
- 10 people in emergency and transitional shelters (with sleeping facilities) for people experiencing homelessness
- 8 people in workers' group living quarters and job corps centers
People in group quarters in Coral Gables in 2000:
- 3,384 people in college dormitories (includes college quarters off campus)
- 51 people in nursing homes
- 46 people in wards in general hospitals for patients who have no usual home elsewhere
- 15 people in religious group quarters
- 14 people in other noninstitutional group quarters
Banks with most branches in Coral Gables (2011 data):
- JPMorgan Chase Bank, National Association: Coral Gables Branch, North Gables Banking Center, Coral Gables - Ponce De Leon. Info updated 2011/11/10: Bank assets: $1,811,678.0 mil, Deposits: $1,190,738.0 mil, headquarters in Columbus, OH, positive income, International Specialization, 5577 total offices, Holding Company: Jpmorgan Chase & Co.
- Wells Fargo Bank, National Association: Coral Gables Main Branch, South Miami Branch, Ponce Branch. Info updated 2011/04/05: Bank assets: $1,161,490.0 mil, Deposits: $905,653.0 mil, headquarters in Sioux Falls, SD, positive income, 6395 total offices, Holding Company: Wells Fargo & Company
- SunTrust Bank: Ponce Branch, Miracle Mile Branch, Coral Gables Drive-In Branch. Info updated 2010/05/27: Bank assets: $171,291.7 mil, Deposits: $129,833.2 mil, headquarters in Atlanta, GA, positive income, Commercial Lending Specialization, 1716 total offices, Holding Company: Suntrust Banks, Inc.
- Bank of America, National Association: South Miami Branch, Douglas Centre Branch, Coral Gables Branch. Info updated 2009/11/18: Bank assets: $1,451,969.3 mil, Deposits: $1,077,176.8 mil, headquarters in Charlotte, NC, positive income, 5782 total offices, Holding Company: Bank Of America Corporation
- U. S. Century Bank: Coral Gables Branch, Merrick Park Branch, Granada Branch. Info updated 2007/12/12: Bank assets: $1,345.6 mil, Deposits: $1,261.7 mil, headquarters in Doral, FL, negative income in the last year, Commercial Lending Specialization, 24 total offices
- Regions Bank: Coral Gables Branch, Coral Gables Banking Center Branch, South Miami Branch. Info updated 2011/02/24: Bank assets: $123,368.2 mil, Deposits: $98,301.3 mil, headquarters in Birmingham, AL, positive income, Commercial Lending Specialization, 1778 total offices, Holding Company: Regions Financial Corporation
- HSBC Bank USA, National Association: Latin America International Center B at 55 Miracle Mile, branch established on 2006/06/26; Coral Gables Branch at 2199 Ponce De Leon Boulevard, branch established on 2001/03/19. Info updated 2010/11/30: Bank assets: $206,009.7 mil, Deposits: $149,026.8 mil, headquarters in Mc Lean, VA, positive income, 474 total offices, Holding Company: Hsbc Holdings Plc
- Capital Bank, National Association: Coral Gables Branch at 1390 South Dixie Highway, branch established on 1988/11/28; Coral Gables Branch at 221 Aragon Avenue, branch established on 1998/07/28. Info updated 2011/09/21: Bank assets: $6,448.0 mil, Deposits: $5,135.4 mil, headquarters in Miami, FL, positive income, Commercial Lending Specialization, 152 total offices, Holding Company: North American Financial Holdings, Inc.
- TotalBank: Red Sunset Center at 6939 Red Road, branch established on 2011/08/29; Coral Gables Branch at 2020 Ponce De Leon Boulevard, Unit 101, branch established on 2011/10/24. Info updated 2006/11/03: Bank assets: $2,256.9 mil, Deposits: $1,470.2 mil, headquarters in Miami, FL, positive income, Commercial Lending Specialization, 18 total offices, Holding Company: Banco Popular Espanol, S.A.
- 32 other banks with 37 local branches
For population 15 years and over in Coral Gables:
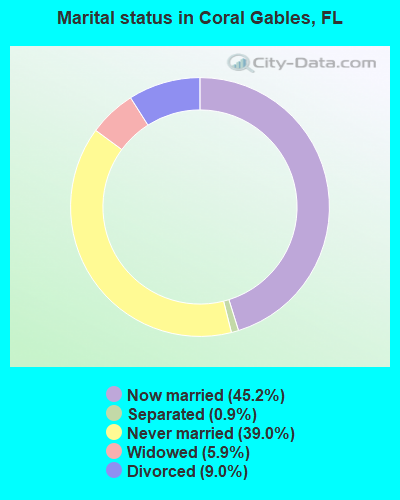
- Never married: 39.0%
- Now married: 45.2%
- Separated: 0.9%
- Widowed: 5.9%
- Divorced: 9.0%
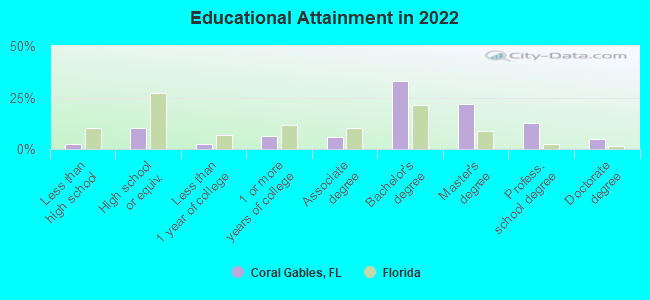
For population 25 years and over in Coral Gables:
- High school or higher: 97.0%
- Bachelor's degree or higher: 70.1%
- Graduate or professional degree: 37.4%
- Unemployed: 1.6%
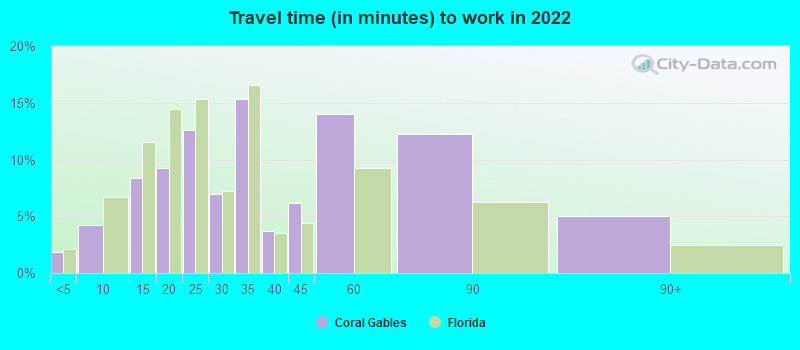
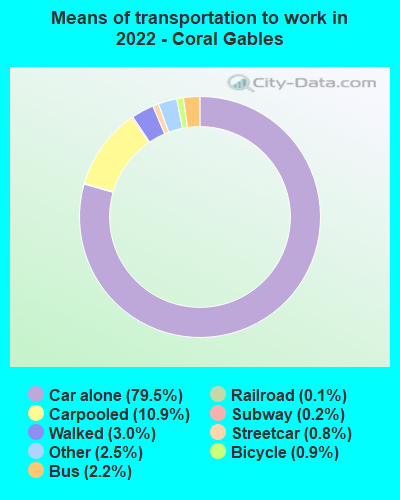
- Mean travel time to work (commute): 18.7 minutes
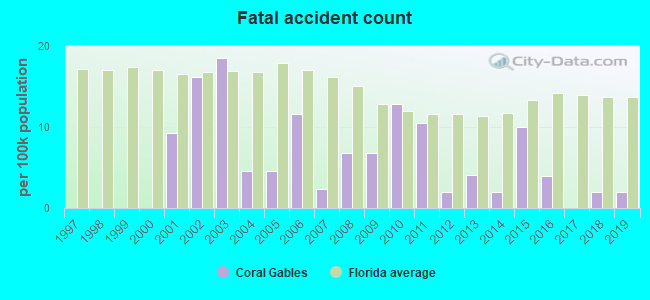
| Here: | 9.8 |
| Florida average: | 12.2 |
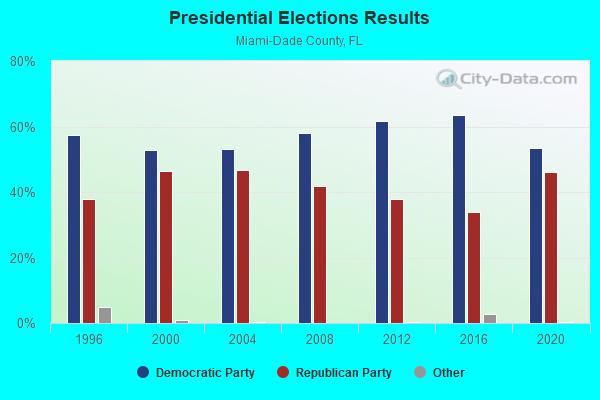
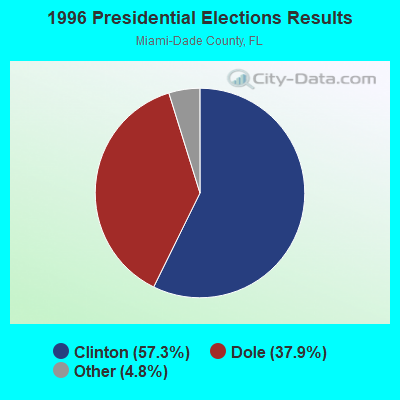
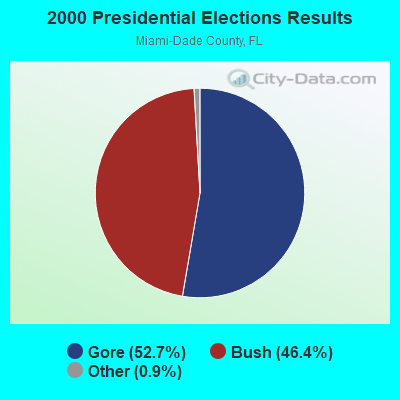
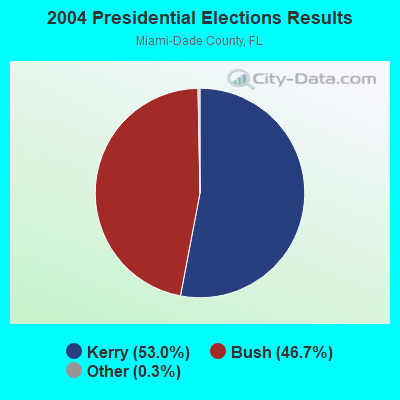
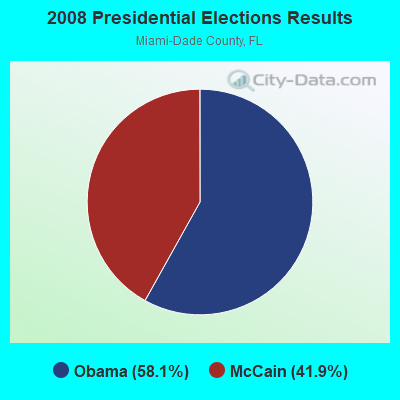
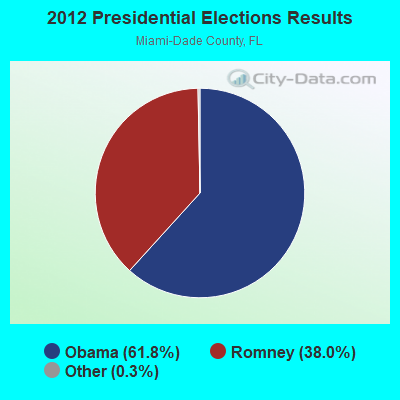
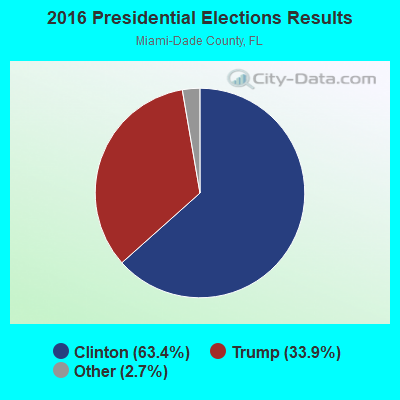
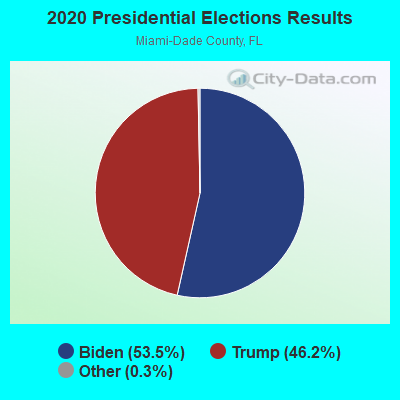
Graphs represent county-level data. Detailed 2008 Election Results
Religion statistics for Coral Gables, FL (based on Miami-Dade County data)
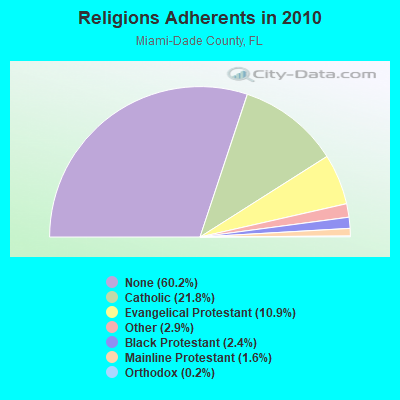
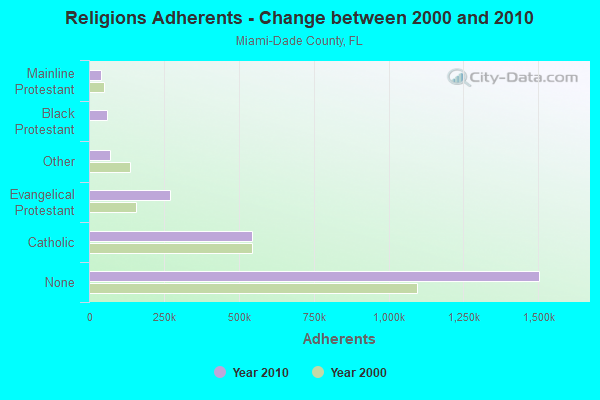
| Religion | Adherents | Congregations |
|---|---|---|
| Catholic | 544,449 | 65 |
| Evangelical Protestant | 271,814 | 922 |
| Other | 71,458 | 200 |
| Black Protestant | 60,074 | 94 |
| Mainline Protestant | 40,287 | 146 |
| Orthodox | 4,440 | 10 |
| None | 1,503,913 | - |
Food Environment Statistics:
| Miami-Dade County: | 2.51 / 10,000 pop. |
| State: | 2.04 / 10,000 pop. |
| Miami-Dade County: | 0.06 / 10,000 pop. |
| Florida: | 0.11 / 10,000 pop. |
| Here: | 1.20 / 10,000 pop. |
| Florida: | 1.28 / 10,000 pop. |
| Miami-Dade County: | 1.98 / 10,000 pop. |
| Florida: | 3.04 / 10,000 pop. |
| Miami-Dade County: | 6.76 / 10,000 pop. |
| State: | 7.45 / 10,000 pop. |
| Miami-Dade County: | 7.9% |
| Florida: | 9.2% |
| Miami-Dade County: | 20.5% |
| State: | 23.7% |
| This county: | 15.8% |
| Florida: | 14.0% |
Health and Nutrition:
| Coral Gables: | 54.3% |
| Florida: | 51.4% |
| Coral Gables: | 57.5% |
| Florida: | 49.4% |
| This city: | 28.0 |
| State: | 28.6 |
| Coral Gables: | 16.1% |
| Florida: | 19.5% |
| This city: | 8.6% |
| Florida: | 10.7% |
| Coral Gables: | 6.9 |
| Florida: | 6.9 |
| Coral Gables: | 35.4% |
| Florida: | 34.7% |
| Coral Gables: | 61.4% |
| State: | 57.0% |
| Coral Gables: | 82.1% |
| State: | 79.2% |
More about Health and Nutrition of Coral Gables, FL Residents
| Local government employment and payroll (March 2022) | |||||
| Function | Full-time employees | Monthly full-time payroll | Average yearly full-time wage | Part-time employees | Monthly part-time payroll |
|---|---|---|---|---|---|
| Police Protection - Officers | 191 | $1,622,644 | $101,946 | 22 | $77,084 |
| Firefighters | 136 | $1,167,396 | $103,006 | 1 | $6,810 |
| Other Government Administration | 86 | $626,134 | $87,368 | 24 | $79,094 |
| Other and Unallocable | 78 | $433,906 | $66,755 | 17 | $40,054 |
| Solid Waste Management | 75 | $336,424 | $53,828 | 0 | $0 |
| Police - Other | 71 | $401,710 | $67,895 | 0 | $0 |
| Parks and Recreation | 51 | $301,789 | $71,009 | 63 | $101,929 |
| Financial Administration | 42 | $313,083 | $89,452 | 15 | $46,943 |
| Streets and Highways | 25 | $176,927 | $84,925 | 5 | $27,748 |
| Sewerage | 15 | $85,351 | $68,281 | 0 | $0 |
| Fire - Other | 13 | $51,224 | $47,284 | 0 | $0 |
| Judicial and Legal | 7 | $71,681 | $122,882 | 0 | $0 |
| Water Supply | 6 | $34,916 | $69,832 | 1 | $926 |
| Transit | 1 | $6,517 | $78,204 | 0 | $0 |
| Totals for Government | 797 | $5,629,703 | $84,763 | 148 | $380,588 |
Coral Gables government finances - Expenditure in 2021 (per resident):
- Construction - Police Protection: $33,720,000 ($685.46)
Parks and Recreation: $3,830,000 ($77.86)
Regular Highways: $2,593,000 ($52.71)
Sewerage: $1,789,000 ($36.37)
Parking Facilities: $534,000 ($10.86)
- Current Operations - Police Protection: $47,569,000 ($966.99)
Local Fire Protection: $29,643,000 ($602.59)
General - Other: $27,297,000 ($554.90)
Natural Resources - Other: $12,498,000 ($254.06)
Solid Waste Management: $11,632,000 ($236.46)
Parks and Recreation: $10,525,000 ($213.95)
Sewerage: $8,795,000 ($178.79)
Financial Administration: $6,647,000 ($135.12)
Central Staff Services: $6,429,000 ($130.69)
Protective Inspection and Regulation - Other: $6,072,000 ($123.43)
Parking Facilities: $5,420,000 ($110.18)
Regular Highways: $4,425,000 ($89.95)
Judicial and Legal Services: $2,338,000 ($47.53)
Transit Utilities: $2,192,000 ($44.56)
- General - Interest on Debt: $4,426,000 ($89.97)
- Other Capital Outlay - Local Fire Protection: $11,015,000 ($223.91)
General - Other: $6,619,000 ($134.55)
Natural Resources - Other: $1,017,000 ($20.67)
Solid Waste Management: $148,000 ($3.01)
Transit Utilities: $143,000 ($2.91)
Central Staff Services: $14,000 ($0.28)
Coral Gables government finances - Revenue in 2021 (per resident):
- Charges - Sewerage: $15,996,000 ($325.17)
Parking Facilities: $11,192,000 ($227.51)
Solid Waste Management: $9,900,000 ($201.25)
Other: $9,412,000 ($191.33)
Parks and Recreation: $1,996,000 ($40.57)
Natural Resources - Other: $12,000 ($0.24)
- Federal Intergovernmental - Other: $9,406,000 ($191.21)
- Local Intergovernmental - Other: $1,807,000 ($36.73)
General Local Government Support: $111,000 ($2.26)
- Miscellaneous - Special Assessments: $6,877,000 ($139.80)
Rents: $5,193,000 ($105.56)
Interest Earnings: $4,138,000 ($84.12)
Fines and Forfeits: $2,892,000 ($58.79)
General Revenue - Other: $1,781,000 ($36.20)
Sale of Property: $1,740,000 ($35.37)
Donations From Private Sources: $508,000 ($10.33)
- State Intergovernmental - General Local Government Support: $4,973,000 ($101.09)
Other: $1,964,000 ($39.92)
Highways: $256,000 ($5.20)
- Tax - Property: $90,002,000 ($1829.57)
Public Utilities Sales: $11,187,000 ($227.41)
Occupation and Business License - Other: $10,362,000 ($210.64)
Other License: $9,925,000 ($201.76)
General Sales and Gross Receipts: $1,893,000 ($38.48)
Motor Fuels Sales: $1,055,000 ($21.45)
Coral Gables government finances - Debt in 2021 (per resident):
- Long Term Debt - Beginning Outstanding - Unspecified Public Purpose: $144,182,000 ($2930.95)
Outstanding Unspecified Public Purpose: $125,765,000 ($2556.56)
Retired Unspecified Public Purpose: $9,883,000 ($200.90)
Coral Gables government finances - Cash and Securities in 2021 (per resident):
- Bond Funds - Cash and Securities: $59,340,000 ($1206.27)
- Other Funds - Cash and Securities: $159,750,000 ($3247.41)
4.04% of this county's 2021 resident taxpayers lived in other counties in 2020 ($229,296 average adjusted gross income)
| Here: | 4.04% |
| Florida average: | 8.80% |
0.03% of residents moved from foreign countries ($357 average AGI)
Miami-Dade County: 0.03% Florida average: 0.05%
Top counties from which taxpayers relocated into this county between 2020 and 2021:
| from Broward County, FL | |
| from New York County, NY | |
| from Palm Beach County, FL |
5.24% of this county's 2020 resident taxpayers moved to other counties in 2021 ($66,399 average adjusted gross income)
| Here: | 5.24% |
| Florida average: | 7.45% |
0.03% of residents moved to foreign countries ($505 average AGI)
Miami-Dade County: 0.03% Florida average: 0.04%
Top counties to which taxpayers relocated from this county between 2020 and 2021:
| to Broward County, FL | |
| to Palm Beach County, FL | |
| to Lee County, FL |
| Businesses in Coral Gables, FL | ||||
| Name | Count | Name | Count | |
|---|---|---|---|---|
| 7-Eleven | 2 | Motherhood Maternity | 1 | |
| AT&T | 4 | Nordstrom | 1 | |
| Ann Taylor | 1 | OfficeMax | 1 | |
| Audi | 1 | Panda Express | 1 | |
| Baja Fresh Mexican Grill | 1 | Panera Bread | 1 | |
| Banana Republic | 1 | PetSmart | 1 | |
| Barnes & Noble | 1 | Pier 1 Imports | 1 | |
| Bebe | 1 | Pottery Barn | 1 | |
| Ben & Jerry's | 1 | Pottery Barn Kids | 1 | |
| Burger King | 1 | Publix Super Markets | 4 | |
| CVS | 1 | Quiznos | 1 | |
| Chico's | 1 | RadioShack | 2 | |
| Cold Stone Creamery | 1 | Sears | 1 | |
| DHL | 8 | Sprint Nextel | 1 | |
| Dennys | 2 | Staples | 1 | |
| Domino's Pizza | 2 | Starbucks | 4 | |
| FedEx | 12 | T-Mobile | 5 | |
| GNC | 1 | T.G.I. Driday's | 1 | |
| H&R Block | 3 | True Value | 1 | |
| Holiday Inn | 1 | U-Haul | 1 | |
| Jamba Juice | 2 | UPS | 24 | |
| Jimmy John's | 1 | Vans | 1 | |
| JoS. A. Bank | 1 | Verizon Wireless | 1 | |
| Jones New York | 1 | Victoria's Secret | 1 | |
| Juicy Couture | 1 | Walgreens | 1 | |
| Marshalls | 1 | Wendy's | 1 | |
| McDonald's | 1 | Westin | 1 | |
| Men's Wearhouse | 1 | Whole Foods Market | 1 | |
Strongest AM radio stations in Coral Gables:
- WSUA (1260 AM; 50 kW; MIAMI, FL; Owner: WSUA BROADCASTING CORPORATION)
- WWFE (670 AM; 50 kW; MIAMI, FL; Owner: FENIX BROADCASTING CORP.)
- WQBA (1140 AM; 50 kW; MIAMI, FL; Owner: WQBA-AM LICENSE CORP.)
- WNMA (1210 AM; 49 kW; MIAMI SPRINGS, FL; Owner: RADIO UNICA OF MIAMI LICENSE CORP.)
- WAQI (710 AM; 50 kW; MIAMI, FL; Owner: LICENSE CORPORATION #1)
- WRFX (940 AM; 50 kW; MIAMI, FL; Owner: CLEAR CHANNEL BROADCASTING LICENSES, INC.)
- WVCG (1080 AM; 50 kW; CORAL GABLES, FL; Owner: RADIO ONE LICENSES, LLC)
- WQAM (560 AM; 5 kW; MIAMI, FL; Owner: WQAM LICENSE LIMITED PARTNERSHIP)
- WRHC (1550 AM; 45 kW; CORAL GABLES, FL; Owner: WRHC BROADCASTING CORP.)
- WKAT (1360 AM; 5 kW; NORTH MIAMI, FL; Owner: SPANISH MEDIA BROADCASTING, L.L.C.)
- WIOD (610 AM; 5 kW; MIAMI, FL; Owner: CLEAR CHANNEL BROADCASTING LICENSES, INC.)
- WACC (830 AM; 5 kW; HIALEAH, FL; Owner: RADIO PEACE CATHOLIC BROADCASTING, INC.)
- WWNN (1470 AM; 50 kW; POMPANO BEACH, FL; Owner: WWNN LICENSE, LLC)
Strongest FM radio stations in Coral Gables:
- WVUM (90.5 FM; CORAL GABLES, FL; Owner: WVUM, INC.)
- WDNA (88.9 FM; MIAMI, FL; Owner: BASCOMB MEMORIAL BROADCASTING FOUNDATION)
- WXDJ (95.7 FM; NORTH MIAMI BEACH, FL; Owner: WXDJ LICENSING, INC.)
- WAMR-FM (107.5 FM; MIAMI, FL; Owner: WQBA-FM LICENSE CORP.)
- WCMQ-FM (92.3 FM; HIALEAH, FL; Owner: WCMQ LICENSING, INC.)
- WRTO (98.3 FM; GOULDS, FL; Owner: LICENSE CORPORATION #2)
- WMCU (89.7 FM; MIAMI, FL; Owner: TRINITY INTERNATIONAL FOUNDATION, INC.)
- WHQT (105.1 FM; CORAL GABLES, FL; Owner: COX RADIO, INC.)
- WLVE (93.9 FM; MIAMI BEACH, FL; Owner: CLEAR CHANNEL BROADCASTING LICENSES, INC.)
- WMIB (103.5 FM; FORT LAUDERDALE, FL; Owner: CLEAR CHANNEL BROADCASTING LICENSES, INC.)
- WMXJ (102.7 FM; POMPANO BEACH, FL; Owner: JEFFERSON-PILOT COMMUNICATIONS CO. OF FLORIDA)
- WPOW (96.5 FM; MIAMI, FL; Owner: WPOW LICENSE LIMITED PARTNERSHIP)
- WZTA (94.9 FM; MIAMI BEACH, FL; Owner: CLEAR CHANNEL BROADCASTING LICENSES, INC.)
- WFLC (97.3 FM; MIAMI, FL; Owner: COX RADIO, INC.)
- WPYM (93.1 FM; MIAMI, FL; Owner: COX RADIO-MIAMI, LLC)
- WBGG-FM (105.9 FM; FORT LAUDERDALE, FL; Owner: CLEAR CHANNEL BROADCASTING LICENSES, INC.)
- WLRN-FM (91.3 FM; MIAMI, FL; Owner: THE SCHOOL BOARD OF MIAMI - DADE COUNTY, FL)
- WHYI-FM (100.7 FM; FORT LAUDERDALE, FL; Owner: CLEAR CHANNEL BROADCASTING LICENSES, INC.)
- WKIS (99.9 FM; BOCA RATON, FL; Owner: WKIS LICENSE LIMITED PARTNERSHIP)
- WRMA (106.7 FM; FORT LAUDERDALE, FL; Owner: WRMA LICENSING, INC.)
TV broadcast stations around Coral Gables:
- WIMP-CA (Channel 25; MIAMI, FL; Owner: SUNSHINE BROADCASTING COMPANY, INC.)
- WJAN-CA (Channel 41; MIAMI, FL; Owner: SHERJAN BROADCASTING COMPANY, INC.)
- WVEB-CA (Channel 21; MIAMI, ETC., FL; Owner: HISPANIC KEYS BROADCASTING CORPORATION)
- WTVJ (Channel 6; MIAMI, FL; Owner: NBC STATIONS MANAGEMENT, INC.)
- WPBT (Channel 2; MIAMI, FL; Owner: COMMUNITY TV FOUNDATION OF S. FLORIDA, INC.)
- WGEN-LP (Channel 55; MIAMI, FL; Owner: WDLP BROADCASTING COMPANY, LLC)
- WSVN (Channel 7; MIAMI, FL; Owner: SUNBEAM TELEVISION CORP.)
- WPLG (Channel 10; MIAMI, FL; Owner: POST-NEWSWEEK STATIONS, FLORIDA, INC.)
- WLTV (Channel 23; MIAMI, FL; Owner: WLTV LICENSE PARTNERSHIP, G.P.)
- WLRN-TV (Channel 17; MIAMI, FL; Owner: THE SCHOOL BOARD OF MIAMI - DADE COUNTY, FL)
- WBFS-TV (Channel 33; MIAMI, FL; Owner: VIACOM STATIONS GROUP OF MIAMI INC.)
- WPXM (Channel 35; MIAMI, FL; Owner: PAXSON COMMUNICATIONS LICENSE COMPANY, LLC)
- WAMI-TV (Channel 69; HOLLYWOOD, FL; Owner: TELEFUTURA MIAMI LLC)
- WBZL (Channel 39; MIAMI, FL; Owner: CHANNEL 39, INC.)
- WSCV (Channel 51; FORT LAUDERDALE, FL; Owner: TELEMUNDO OF FLORIDA LICENSE CORP.)
- WLMF-LP (Channel 53; MIAMI, FL; Owner: PAGING SYSTEMS, INC.)
- WPPB-TV (Channel 63; BOCA RATON, FL; Owner: THE SCHOOL BOARD OF BROWARD COUNTY, FLORIDA)
- W58BU (Channel 58; HALLANDALE, FL; Owner: NBC STATIONS MANAGEMENT,INC.)
- WHFT-TV (Channel 45; MIAMI, FL; Owner: TRINITY BROADCASTING OF FLORIDA, INC.)
- W24CA (Channel 24; MARATHON, FL; Owner: KEY COMMUNICATIONS OF TEXAS)
- WPMF-LP (Channel 31; MIAMI, FL; Owner: JAMES J. CHLADEK)
- WFUN-CA (Channel 48; MIAMI, ETC., FL; Owner: LOCALONE TEXAS, LTD.)
- W54BB (Channel 54; ROCK HARBOR, FL; Owner: WDLP BROADCASTING COMPANY, LLC)
- WEYS-LP (Channel 56; ROCK HARBOR, FL; Owner: CAYO HUESO NETWORKS, LLC)
- WHDT-LP (Channel 44; MIAMI, FL; Owner: GUENTER MARKSTEINER)
- National Bridge Inventory (NBI) Statistics
- 20Number of bridges
- 164ft / 50.1mTotal length
- $1,870,000Total costs
- 268,122Total average daily traffic
- 7,631Total average daily truck traffic
- 439,727Total future (year 2036) average daily traffic
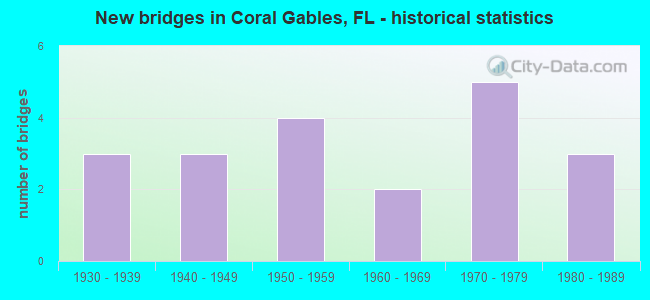
- New bridges - historical statistics
- 31930-1939
- 31940-1949
- 41950-1959
- 21960-1969
- 51970-1979
- 31980-1989
FCC Registered Broadcast Land Mobile Towers: 61 (See the full list of FCC Registered Broadcast Land Mobile Towers in Coral Gables, FL)
FCC Registered Microwave Towers: 37 (See the full list of FCC Registered Microwave Towers in this town)
FCC Registered Paging Towers: 1 (See the full list of FCC Registered Paging Towers)
FCC Registered Maritime Coast & Aviation Ground Towers: 3 (See the full list of FCC Registered Maritime Coast & Aviation Ground Towers)
FCC Registered Amateur Radio Licenses: 171 (See the full list of FCC Registered Amateur Radio Licenses in Coral Gables)
FAA Registered Aircraft Manufacturers and Dealers: 2 (See the full list of FAA Registered Manufacturers and Dealers in Coral Gables)
FAA Registered Aircraft: 219 (See the full list of FAA Registered Aircraft)
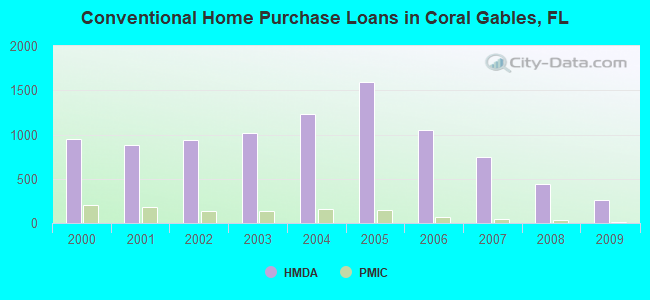
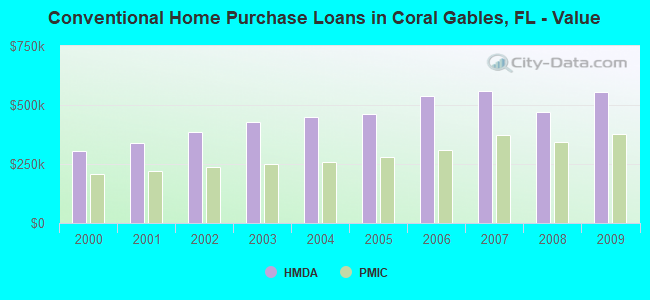
| Home Mortgage Disclosure Act Aggregated Statistics For Year 2009 (Based on 7 full and 6 partial tracts) | ||||||||||||||
| A) FHA, FSA/RHS & VA Home Purchase Loans | B) Conventional Home Purchase Loans | C) Refinancings | D) Home Improvement Loans | E) Loans on Dwellings For 5+ Families | F) Non-occupant Loans on < 5 Family Dwellings (A B C & D) | G) Loans On Manufactured Home Dwelling (A B C & D) | ||||||||
|---|---|---|---|---|---|---|---|---|---|---|---|---|---|---|
| Number | Average Value | Number | Average Value | Number | Average Value | Number | Average Value | Number | Average Value | Number | Average Value | Number | Average Value | |
| LOANS ORIGINATED | 36 | $295,554 | 259 | $553,503 | 480 | $431,834 | 20 | $563,790 | 1 | $1,500,930 | 52 | $586,424 | 0 | $0 |
| APPLICATIONS APPROVED, NOT ACCEPTED | 1 | $417,000 | 40 | $659,235 | 67 | $514,291 | 4 | $355,295 | 2 | $36,000 | 12 | $303,804 | 0 | $0 |
| APPLICATIONS DENIED | 9 | $271,767 | 97 | $505,902 | 246 | $479,017 | 23 | $170,530 | 2 | $191,600 | 37 | $403,688 | 1 | $4,000 |
| APPLICATIONS WITHDRAWN | 6 | $282,050 | 66 | $630,662 | 126 | $410,893 | 2 | $231,005 | 1 | $453,420 | 19 | $242,248 | 0 | $0 |
| FILES CLOSED FOR INCOMPLETENESS | 1 | $163,470 | 22 | $598,010 | 32 | $468,404 | 0 | $0 | 0 | $0 | 2 | $163,940 | 0 | $0 |
Detailed mortgage data for all 13 tracts in Coral Gables, FL
| Private Mortgage Insurance Companies Aggregated Statistics For Year 2009 (Based on 5 full and 5 partial tracts) | ||||||
| A) Conventional Home Purchase Loans | B) Refinancings | C) Non-occupant Loans on < 5 Family Dwellings (A & B) | ||||
|---|---|---|---|---|---|---|
| Number | Average Value | Number | Average Value | Number | Average Value | |
| LOANS ORIGINATED | 9 | $377,961 | 1 | $355,530 | 0 | $0 |
| APPLICATIONS APPROVED, NOT ACCEPTED | 11 | $378,896 | 0 | $0 | 0 | $0 |
| APPLICATIONS DENIED | 3 | $338,363 | 3 | $311,913 | 0 | $0 |
| APPLICATIONS WITHDRAWN | 2 | $221,675 | 1 | $266,000 | 0 | $0 |
| FILES CLOSED FOR INCOMPLETENESS | 1 | $291,840 | 0 | $0 | 1 | $291,840 |
2003 - 2018 National Fire Incident Reporting System (NFIRS) incidents
- Fire incident types reported to NFIRS in Coral Gables, FL
- 46437.0%Outside Fires
- 36629.2%Structure Fires
- 23118.4%Mobile Property/Vehicle Fires
- 19215.3%Other
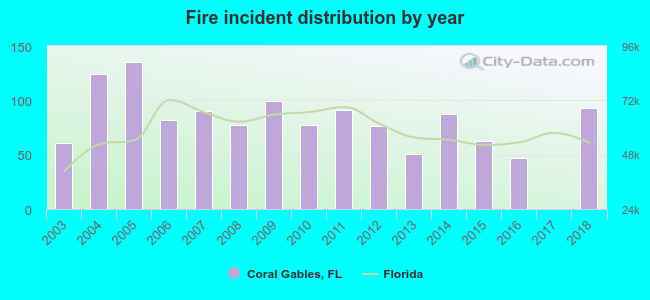 According to the data from the years 2003 - 2018 the average number of fires per year is 78. The highest number of fires - 135 took place in 2005, and the least - 0 in 2017. The data has an increasing trend.
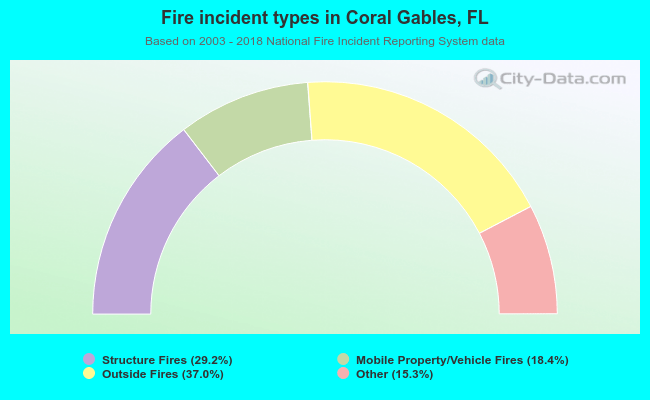 When looking into fire subcategories, the most reports belonged to: Outside Fires (37.0%), and Structure Fires (29.2%).
Fire-safe hotels and motels in Coral Gables, Florida:
- Courtyard Miami Coral Gables, 2051 S Le Jeune Rd, Coral Gables, Florida 33134 , Phone: (305) 443-2301, Fax: (305) 446-6827
- Gables Inn, 730 S Dixie Hwy, Coral Gables, Florida 33146 , Phone: (305) 661-7999, Fax: (305) 593-8349
- Villa Cortez Motel, 4700 SW 8TH St, Coral Gables, Florida 33134
- Riviera Court Motel, 5100 Riviera Dr, Coral Gables, Florida 33146
- Chateaubleau Inn South, 1211 E Ponce De Leon, Coral Gables, Florida 33134
- The Biltmore Hotel, 1200 Anastasia Ave, Coral Gables, Florida 33134 , Phone: (305) 445-1926, Fax: (786) 924-0670
- Hotel Colonnade Coral Gables, a Tribute Portfolio Hotel, 180 Aragon Ave, Coral Gables, Florida 33134 , Phone: (305) 441-2600, Fax: (305) 444-9706
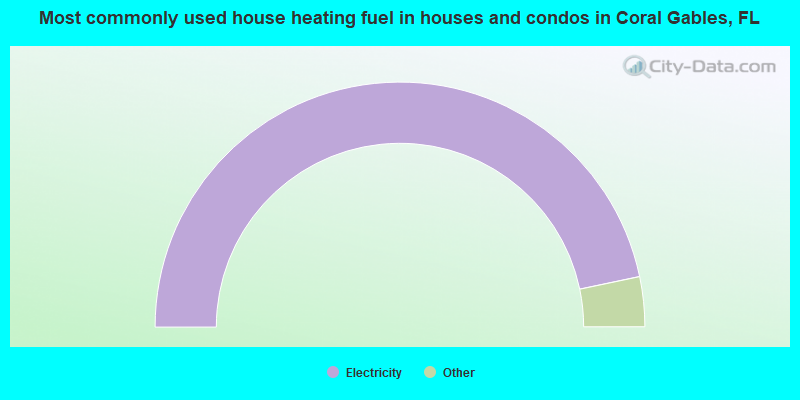
- 93.4%Electricity
- 3.8%No fuel used
- 1.4%Bottled, tank, or LP gas
- 0.8%Utility gas
- 0.5%Solar energy
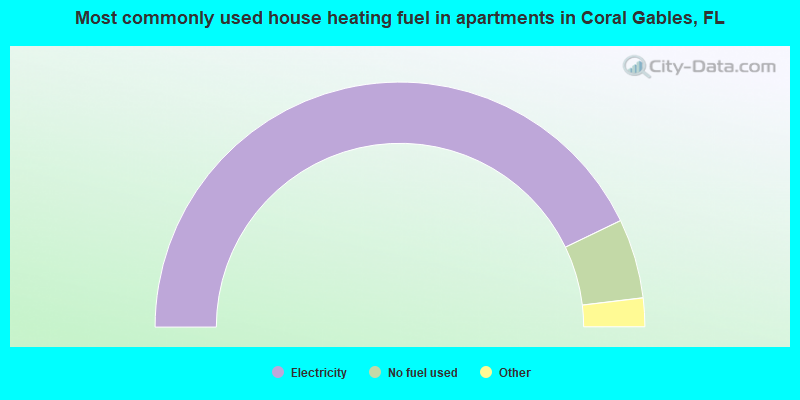
- 85.7%Electricity
- 10.5%No fuel used
- 3.4%Utility gas
- 0.3%Other fuel
- 0.2%Bottled, tank, or LP gas
Coral Gables compared to Florida state average:
- Median household income above state average.
- Median house value significantly above state average.
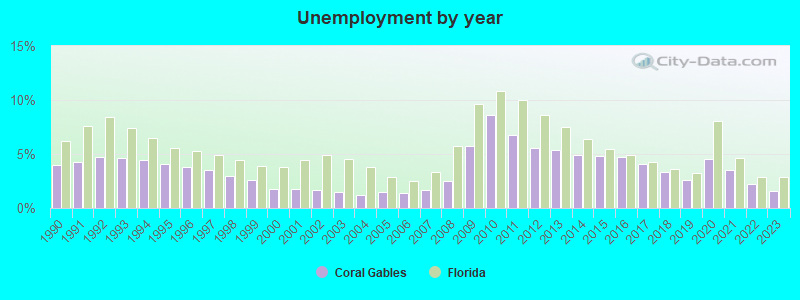
- Unemployed percentage significantly below state average.
- Black race population percentage significantly below state average.
- Hispanic race population percentage above state average.
- Foreign-born population percentage above state average.
- Length of stay since moving in significantly above state average.
- House age above state average.
- Number of college students above state average.
- Percentage of population with a bachelor's degree or higher significantly above state average.
Coral Gables on our top lists:
- #12 on the list of "Top 101 cities with the largest percentage of elementary and middle school students in private schools (1,000+ students)"
- #14 on the list of "Top 101 cities with the largest percentage of high school students in private schools (500+ students)"
- #19 on the list of "Top 101 cities with the most local government spending on current operations of parking facilities per resident (population 10,000+)"
- #21 on the list of "Top 101 cities with the most residents born in Born at sea (population 500+)"
- #27 on the list of "Top 100 cities with highest percentage of college students (pop. 50,000+)"
- #36 on the list of "Top 100 cities with highest median house value (pop. 50,000+)"
- #44 on the list of "Top 101 cities with the most residents born in Cuba (population 500+)"
- #46 on the list of "Top 100 best educated cities (highest percentage of bachelor degree holding residents) (pop. 50,000+)"
- #48 on the list of "Top 101 cities with the most residents born in Spain (population 500+)"
- #48 on the list of "Top 101 cities with the most residents born in Venezuela (population 500+)"
- #56 on the list of "Top 101 cities with the highest cost per building permit(population 5,000+)"
- #71 on the list of "Top 100 cities with highest percentage of foreign-born residents (pop. 50,000+)"
- #72 on the list of "Top 101 cities with largest percentage of males in occupations: legal occupations (population 5,000+)"
- #81 on the list of "Top 100 cities with highest median household income (pop. 50,000+)"
- #83 on the list of "Top 100 cities with highest ratio of median house value to median household income (pop. 50,000+)"
- #87 on the list of "Top 100 cities with the largest percentage of females (pop. 50,000+)"
- #96 on the list of "Top 101 cities with the most residents born in Caribbean (population 500+)"
- #100 on the list of "Top 101 cities with largest percentage of females in occupations: legal occupations (population 5,000+)"
- #100 on the list of "Top 101 cities with the most full-time firefighters per 1000 residents (population 5,000+)"
- #6 (33134) on the list of "Top 101 zip codes with the most offices of lawyers in 2005"
- #10 (33134) on the list of "Top 101 zip codes with the most beauty salons in 2005"
- #10 (33135) on the list of "Top 101 zip codes with the largest percentage of taxpayers reporting profit/loss from business in 2012 (pop 5,000+)"
- #27 (33134) on the list of "Top 101 zip codes with the most finance and insurance companies in 2005"
- #38 (33134) on the list of "Top 101 zip codes with the most offices of physicians in 2005"
- #61 (33143) on the list of "Top 101 zip codes with the highest 2012 average taxable interest for individuals (pop 5,000+)"
- #98 (33134) on the list of "Top 101 zip codes with the most museums in 2005"
- #101 (33133) on the list of "Top 101 zip codes with the highest 2012 average net capital gain/loss (pop 5,000+)"
- #2 on the list of "Top 101 counties with the highest ground withdrawal of fresh water for public supply"
- #8 on the list of "Top 101 counties with the most Evangelical Protestant congregations"
- #9 on the list of "Top 101 counties with the most Black Protestant adherents"
- #11 on the list of "Top 101 counties with the highest total withdrawal of fresh water for public supply (pop. 50,000+)"
- #12 on the list of "Top 101 counties with the most Evangelical Protestant adherents (pop. 50,000+)"
State forum archive:
- Florida Pages: 2 3 4 5 6 7 8 9 10 11 12 13 14 15 16 17 18 19 20 21 22 23 24 25 26 27 28 29 30 31 32 33 34 35 36 37 38 39 40 41 42 43 44 45 46 47 48 49 50 51 52 53 54 55 56 57 58 59 60 61 62 63 64 65 66 67 68 69 70 71 72 73 74 75 76 77 78 79 80 81
- Brevard County Pages: 2 3 4 5 6 7 8 9 10
- Fort Lauderdale area Pages: 2 3 4 5 6 7 8 9 10 11 12 13 14 15 16 17 18 19 20 21 22 23 24 25 26 27 28 29 30 31
- Fort Myers - Cape Coral area Pages: 2 3 4 5 6 7 8 9 10 11 12 13 14 15 16 17 18 19 20 21 22 23 24
- Jacksonville Pages: 2 3 4 5 6 7 8 9 10 11 12 13 14 15 16 17 18 19 20 21 22 23 24 25 26 27 28 29 30 31 32 33 34 35 36 37 38 39 40 41 42 43 44 45 46 47 48 49 50 51 52 53 54 55 56
- Miami Pages: 2 3 4 5 6 7 8 9 10 11 12 13 14 15 16 17 18 19 20 21 22 23 24 25 26 27 28 29 30 31 32 33 34 35 36 37 38 39 40 41 42 43 44 45 46 47 48 49 50 51 52
- Naples Pages: 2 3 4 5 6 7 8 9 10 11
- Ocala Pages: 2 3 4 5 6 7
- Orlando Pages: 2 3 4 5 6 7 8 9 10 11 12 13 14 15 16 17 18 19 20 21 22 23 24 25 26 27 28 29 30 31 32 33 34 35 36 37 38 39 40 41 42 43 44 45 46 47 48 49 50 51 52 53 54 55 56 57 58 59 60 61 62 63 64 65 66 67 68 69 70 71 72
- Pensacola Pages: 2 3 4 5 6
- Port St. Lucie - Sebastian - Vero Beach Pages: 2 3 4 5 6 7 8 9 10 11 12 13 14 15 16 17 18
- Punta Gorda - Port Charlotte Pages: 2 3 4 5 6 7 8 9 10 11 12 13 14 15 16 17 18
- Sarasota - Bradenton - Venice area Pages: 2 3 4 5 6 7 8 9 10 11 12 13 14 15 16 17 18 19 20 21 22 23 24 25 26 27 28 29 30 31 32 33 34 35 36 37 38 39 40 41 42 43 44 45 46 47 48 49 50 51 52 53 54 55 56
- Tallahassee Pages: 2 3 4
- Tampa Bay Pages: 2 3 4 5 6 7 8 9 10 11 12 13 14 15 16 17 18 19 20 21 22 23 24 25 26 27 28 29 30 31 32 33 34 35 36 37 38 39 40 41 42 43 44 45 46 47 48 49 50 51 52 53 54 55 56 57 58 59 60 61 62 63 64 65 66 67 68 69 70 71 72 73 74 75 76 77 78 79 80 81 82 83 84 85 86 87 88 89 90 91 92 93 94 95 96 97
- West Palm Beach - Boca Raton - Boynton Beach Pages: 2 3 4 5 6 7 8 9 10 11 12 13 14 15 16 17 18 19 20 21 22 23 24 25 26 27 28 29

|
|
Total of 615 patent applications in 2008-2024.