Coral Gables: Fire Incidents, Florida (FL)
Where are fire incidents reported in Coral Gables, FL
Something went wrong! Please refresh the page.
| Fire incidents reported | |
|---|---|
| Sreet name | Count |
| PONCE DE LEON BLVD | 202 |
| BIRD RD | 134 |
| ALHAMBRA CIR | 88 |
| DIXIE HWY | 82 |
| LEJEUNE RD | 70 |
| SALZEDO ST | 48 |
| GRANADA BLVD | 46 |
| OLD CUTLER RD | 44 |
| RED RD | 44 |
| MIRACLE MILE | 42 |
| UNIVERSITY DR | 40 |
| ARAGON AV | 38 |
| DICKINSON DR | 36 |
| DOUGLAS RD | 36 |
| EDGEWATER DR | 34 |
| RIVIERA DR | 30 |
| VALENCIA AV | 28 |
| EIGHTH ST | 24 |
| MENORES AVE | 24 |
| SEGOVIA ST | 24 |
| ZAMORA AV | 24 |
| BILTMORE WAY | 22 |
| DEERING BAY DR | 22 |
| ANASTASIA AV | 18 |
| SAN LORENZO AV | 18 |
| ALMERIA AV | 16 |
| BILTMORE WAY | 16 |
| CASUARINA CONCOURSE | 16 |
| MADEIRA AVE | 16 |
| CORAL WAY | 12 |
2003 - 2018 National Fire Incident Reporting System (NFIRS) incidents
- Incident types reported to NFIRS in Coral Gables, FL
- 13,60558.4%Rescue & EMS
- 2,56511.0%False Alarm
- 2,52710.8%Hazardous Condition
- 2,43810.5%Good Intent Call
- 1,2535.4%Fire
- 8793.8%Service Call
- Fire incident types reported to NFIRS in Coral Gables, FL
- 46437.0%Outside Fires
- 36629.2%Structure Fires
- 23118.4%Mobile Property/Vehicle Fires
- 19215.3%Other
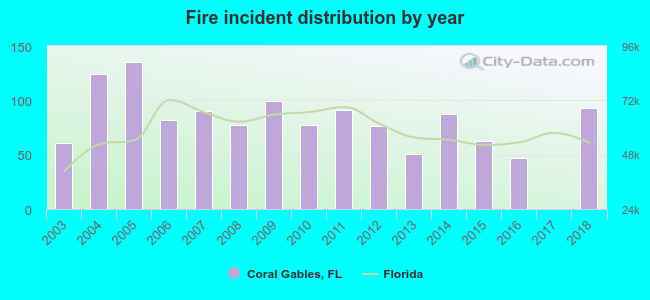 Based on the data from the years 2003 - 2018 the average number of fire incidents per year is 78. The highest number of reported fires - 135 took place in 2005, and the least - 0 in 2017. The data has a growing trend.
The average number of yearly fire incidents per 10k residents in Coral Gables, FL compared to nearest cities:
(Note: Based on data for the last 3 years, including only cities with population 5,000 and above)
| Coral Gables: | 13.7 |
| South Miami: | 15.9 |
| West Miami: | 11.6 |
| Miami: | 21.7 |
| Pinecrest: | 12.6 |
| University Park: | 4.8 |
| Miami Springs: | 12.0 |
| Sweetwater: | 7.6 |
| Key Biscayne: | 49.0 |
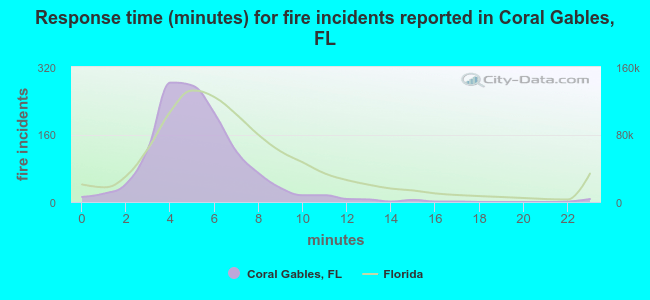 The median response time based on all reported fire incidents is 5 minutes. This is lower compared to the Florida median value.
The median response time in Coral Gables, FL compared to nearest cities:
(Note: Based on data for all years, including only cities with at least 500 fire incidents)
| Coral Gables: | 5 minutes |
| Miami: | 5 minutes |
| Key Biscayne: | 4 minutes |
| Doral: | 6 minutes |
| Hialeah: | 7 minutes |
| Cutler Bay: | 6 minutes |
| North Miami: | 6 minutes |
| North Miami Beach: | 6 minutes |
| Miramar: | 6 minutes |
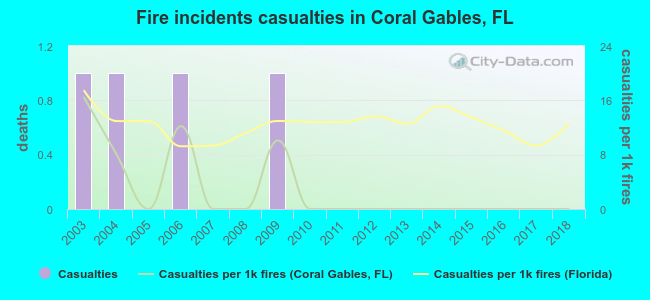 Based on the data from the years 2003 - 2018 the average number of fire-related yearly casualties is 0. The highest number of reported injuries - 1 took place in 2003, and the lowest - 0 in 2005. The data has a decreasing trend.
The average number of casualties per 1,000 fire incidents is 3. This indicator was the highest - 16 in 2003, and the lowest 0 in 2005. The trend for casualties per 1,000 fires is declining. Compared to the Florida value the number of injuries per 1,000 fire incidents is much lower.
Based on the data from the years 2003 - 2018 the average number of fire-related yearly casualties is 0. The highest number of reported injuries - 1 took place in 2003, and the lowest - 0 in 2005. The data has a decreasing trend.
The average number of casualties per 1,000 fire incidents is 3. This indicator was the highest - 16 in 2003, and the lowest 0 in 2005. The trend for casualties per 1,000 fires is declining. Compared to the Florida value the number of injuries per 1,000 fire incidents is much lower.Casualties per 1,000 incidents in Coral Gables, FL compared to nearest cities:
(Note: Based on data for all years, including only cities with at least 500 fire incidents)
| Coral Gables: | 3.2 |
| Miami: | 1.7 |
| Key Biscayne: | 1.5 |
| Doral: | 0.0 |
| Hialeah: | 1.6 |
| Cutler Bay: | 0.0 |
| North Miami: | 0.0 |
| North Miami Beach: | 0.0 |
| Miramar: | 17.8 |
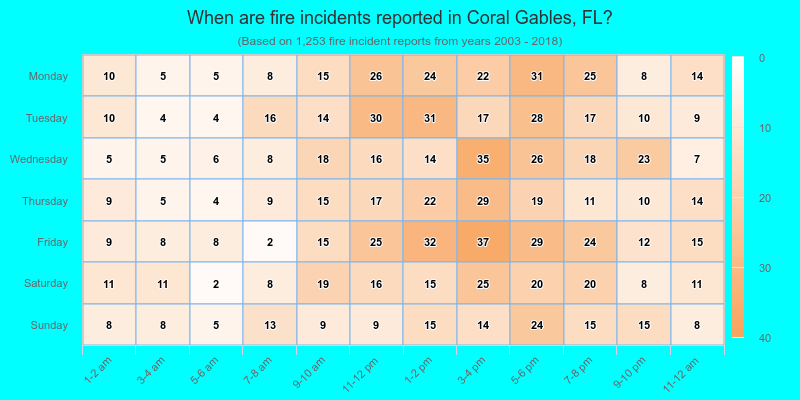
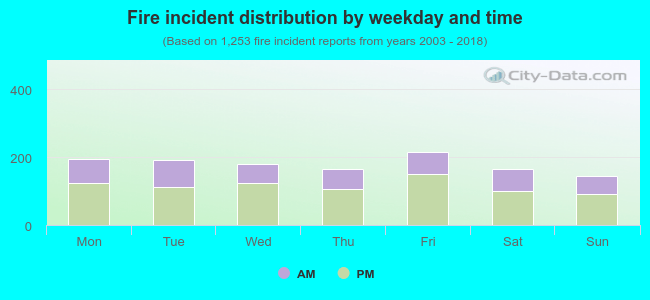 35.9% incidents where reported in the morning and 64.1% in the evening. The most fires (17.2%) took place on Friday, and the least (11.4%) on Sunday.
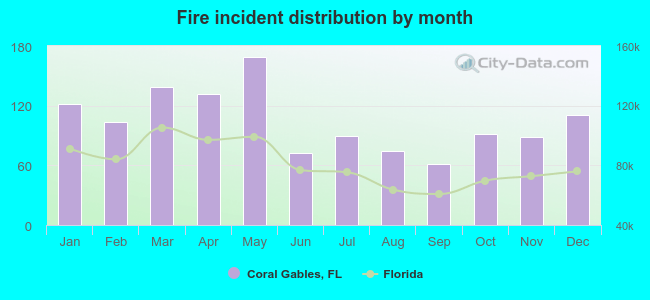 According to the 1,253 fire incident reports from years 2003 - 2018 most fires (13.5%) took place during May, and the least (4.9%) in September.
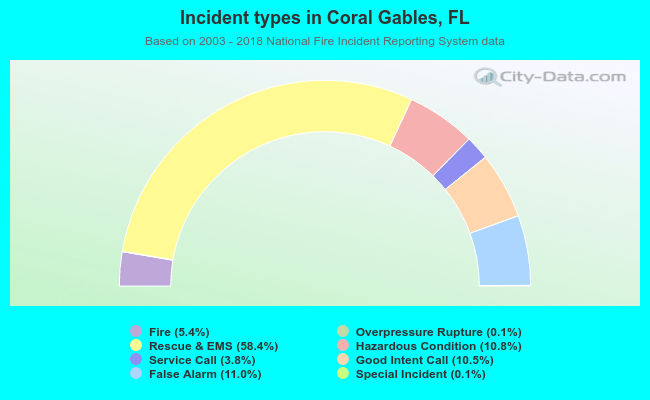 Out of all 23,291 cases reported during the years 2003 - 2018, the most belonged to the categories: Rescue & EMS (58.4%), False Alarm (11.0%), and Hazardous Condition (10.8%).
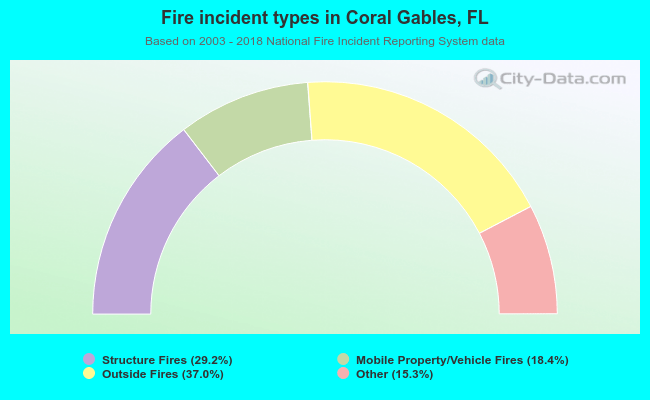 When looking into fire subcategories, the most reports belonged to: Outside Fires (37.0%), and Structure Fires (29.2%).