Miami: Fire Incidents, Florida (FL)
Where are fire incidents reported in Miami, FL
Something went wrong! Please refresh the page.
| Fire incidents reported | |
|---|---|
| Sreet name | Count |
| 2 AV | 1,008 |
| FLAGLER ST | 682 |
| 7 ST | 656 |
| 1 AV | 524 |
| 8 ST | 514 |
| MIAMI AV | 466 |
| BISCAYNE BL | 452 |
| 5 ST | 450 |
| 3 AV | 444 |
| 17 AV | 434 |
| 12 AV | 420 |
| 3 ST | 412 |
| 6 ST | 410 |
| 27 AV | 396 |
| 4 ST | 388 |
| 7 AV | 386 |
| 2 ST | 382 |
| 1 ST | 350 |
| 5 AV | 320 |
| 13 AV | 306 |
| 22 ST | 298 |
| BAYSHORE DR | 278 |
| 22 AV | 272 |
| 11 ST | 270 |
| 9 ST | 260 |
| 6 AV | 234 |
| 15 AV | 230 |
| 36 ST | 222 |
| 18 AV | 212 |
| 1 CT | 210 |
| Other | 4,192 |
2005 - 2018 National Fire Incident Reporting System (NFIRS) incidents
- Incident types reported to NFIRS in Miami, FL
- 327,63879.5%Rescue & EMS
- 19,8554.8%Good Intent Call
- 17,9034.3%False Alarm
- 17,2184.2%Service Call
- 16,0783.9%Fire
- 13,2813.2%Hazardous Condition
- Fire incident types reported to NFIRS in Miami, FL
- 8,98455.9%Structure Fires
- 3,27620.4%Mobile Property/Vehicle Fires
- 2,91418.1%Outside Fires
- 9045.6%Other
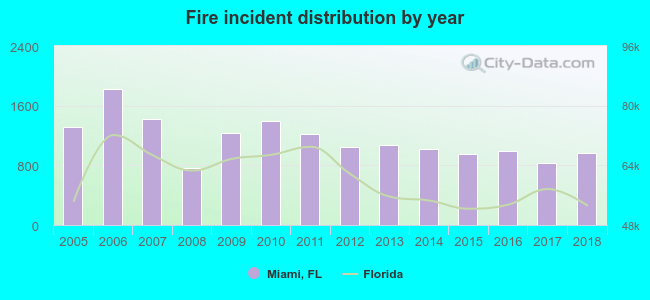 Based on the data from the years 2005 - 2018 the average number of fire incidents per year is 1,148. The highest number of reported fire incidents - 1,823 took place in 2006, and the least - 767 in 2008. The data has a declining trend.
The average number of yearly fire incidents per 10k residents in Miami, FL compared to nearest cities:
(Note: Based on data for the last 3 years, including only cities with population 5,000 and above)
| Miami: | 21.7 |
| Miami Springs: | 12.0 |
| West Miami: | 11.6 |
| Coral Gables: | 13.7 |
| Miami Shores: | 8.0 |
| Miami Beach: | 6.6 |
| North Bay Village: | 8.9 |
| Hialeah: | 7.0 |
| South Miami: | 15.9 |
 The median response time based on all reported fire incidents is 5 minutes. This is lower compared to the state median value.
The median response time in Miami, FL compared to nearest cities:
(Note: Based on data for all years, including only cities with at least 500 fire incidents)
| Miami: | 5 minutes |
| Coral Gables: | 5 minutes |
| Hialeah: | 7 minutes |
| Key Biscayne: | 4 minutes |
| North Miami: | 6 minutes |
| Doral: | 6 minutes |
| North Miami Beach: | 6 minutes |
| Miami Gardens: | 6 minutes |
| West Park: | 5 minutes |
 Based on the data from the years 2005 - 2018 the average number of fire-related yearly deaths is 1. The highest number of reported deaths - 4 took place in 2016, and the lowest - 0 in 2005. The data has a constant trend.
The average number of deaths per 1,000 fires is 1. This indicator was the highest - 4 in 2016, and the lowest 0 in 2005. The trend for deaths per 1,000 incidents is dropping. Compared to the state value the number of fatalities per 1,000 fire incidents is much lower.
Based on the data from the years 2005 - 2018 the average number of fire-related yearly deaths is 1. The highest number of reported deaths - 4 took place in 2016, and the lowest - 0 in 2005. The data has a constant trend.
The average number of deaths per 1,000 fires is 1. This indicator was the highest - 4 in 2016, and the lowest 0 in 2005. The trend for deaths per 1,000 incidents is dropping. Compared to the state value the number of fatalities per 1,000 fire incidents is much lower.Deaths per 1,000 incidents in Miami, FL compared to nearest cities:
(Note: Based on data for all years, including only cities with at least 2,500 fire incidents)
| Miami: | 0.6 |
| Miami Gardens: | 0.0 |
| Miramar: | 1.5 |
 Based on the reports from the years 2005 - 2018 the average number of fire-related casualties per year is 2. The highest number of reported injuries - 8 took place in 2016, and the lowest - 0 in 2005. The data has a rising trend.
The average number of injuries per 1,000 fire incidents is 2. This indicator was the highest - 8 in 2016, and the lowest 0 in 2005. The trend for casualties per 1,000 fires is rising. Compared to the Florida value the number of casualties per 1,000 fires is much lower.
Based on the reports from the years 2005 - 2018 the average number of fire-related casualties per year is 2. The highest number of reported injuries - 8 took place in 2016, and the lowest - 0 in 2005. The data has a rising trend.
The average number of injuries per 1,000 fire incidents is 2. This indicator was the highest - 8 in 2016, and the lowest 0 in 2005. The trend for casualties per 1,000 fires is rising. Compared to the Florida value the number of casualties per 1,000 fires is much lower.Casualties per 1,000 incidents in Miami, FL compared to nearest cities:
(Note: Based on data for all years, including only cities with at least 500 fire incidents)
| Miami: | 1.7 |
| Coral Gables: | 3.2 |
| Hialeah: | 1.6 |
| Key Biscayne: | 1.5 |
| North Miami: | 0.0 |
| Doral: | 0.0 |
| North Miami Beach: | 0.0 |
| Miami Gardens: | 0.0 |
| West Park: | 18.9 |
 35.7% incidents where reported in the morning and 64.3% in the evening. The most fires (14.7%) took place on Sunday, and the least (13.9%) on Thursday.
 According to the 16,078 reports from years 2005 - 2018 most fires (9.4%) took place during March, and the least (7.2%) in September.
 Out of all 412,063 cases reported during the years 2005 - 2018, the most belonged to the categories: Rescue & EMS (79.5%), Good Intent Call (4.8%), and False Alarm (4.3%).
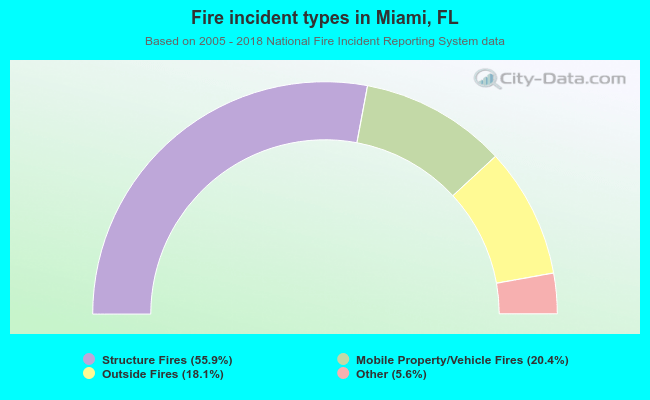 When looking into fire subcategories, the most incidents belonged to: Structure Fires (55.9%), and Mobile Property/Vehicle Fires (20.4%).