Races in Country Walk, Florida (FL) Detailed Stats
Data:
Races - White alone (%)
Races - White alone (% change since 2000)
Races - Black alone (%)
Races - Black alone (% change since 2000)
Races - American Indian alone (%)
Races - American Indian alone (% change since 2000)
Races - Asian alone (%)
Races - Asian alone (% change since 2000)
Races - Hispanic (%)
Races - Hispanic (% change since 2000)
Races - Native Hawaiian and Other Pacific Islander alone (%)
Races - Native Hawaiian and Other Pacific Islander alone (% change since 2000)
Races - Two or more races(%)
Races - Two or more races(% change since 2000)
Races - Other race alone (%)
Races - Other race alone (% change since 2000)
Racial diversity
Place of birth - Born in state of residence (%)
Place of birth - Born in state of residence (%) - White
Place of birth - Born in state of residence (%) - Black or African American
Place of birth - Born in state of residence (%) - Asian
Place of birth - Born in state of residence (%) - Hispanic or Latino
Place of birth - Born in state of residence (%) - American Indian and Alaska Native
Place of birth - Born in state of residence (%) - Multirace
Place of birth - Born in state of residence (%) - Other Race
Place of birth - Born in other state (%)
Place of birth - Born in other state (%) - White
Place of birth - Born in other state (%) - Black or African American
Place of birth - Born in other state (%) - Asian
Place of birth - Born in other state (%) - Hispanic or Latino
Place of birth - Born in other state (%) - American Indian and Alaska Native
Place of birth - Born in other state (%) - Multirace
Place of birth - Born in other state (%) - Other Race
Place of birth - Native, outside of US (%)
Place of birth - Native, outside of US (%) - White
Place of birth - Native, outside of US (%) - Black or African American
Place of birth - Native, outside of US (%) - Asian
Place of birth - Native, outside of US (%) - Hispanic or Latino
Place of birth - Native, outside of US (%) - American Indian and Alaska Native
Place of birth - Native, outside of US (%) - Multirace
Place of birth - Native, outside of US (%) - Other Race
Place of birth - Foreign born (%)
Place of birth - Foreign born (%) - White
Place of birth - Foreign born (%) - Black or African American
Place of birth - Foreign born (%) - Asian
Place of birth - Foreign born (%) - Hispanic or Latino
Place of birth - Foreign born (%) - American Indian and Alaska Native
Place of birth - Foreign born (%) - Multirace
Place of birth - Foreign born (%) - Other Race
Residents speaking English at home (%)
Residents speaking English at home - Born in the United States (%)
Residents speaking English at home - Native, born elsewhere (%)
Residents speaking English at home - Foreign born (%)
Residents speaking Spanish at home (%)
Residents speaking Spanish at home - Born in the United States (%)
Residents speaking Spanish at home - Native, born elsewhere (%)
Residents speaking Spanish at home - Foreign born (%)
Residents speaking other language at home (%)
Residents speaking other language at home - Born in the United States (%)
Residents speaking other language at home - Native, born elsewhere (%)
Residents speaking other language at home - Foreign born (%)
Marital status - Never married (%)
Marital status - Now married (%)
Marital status - Separated (%)
Marital status - Widowed (%)
Marital status - Divorced (%)
Ancestries Reported - Arab (%)
Ancestries Reported - Czech (%)
Ancestries Reported - Danish (%)
Ancestries Reported - Dutch (%)
Ancestries Reported - English (%)
Ancestries Reported - French (%)
Ancestries Reported - French Canadian (%)
Ancestries Reported - German (%)
Ancestries Reported - Greek (%)
Ancestries Reported - Hungarian (%)
Ancestries Reported - Irish (%)
Ancestries Reported - Italian (%)
Ancestries Reported - Lithuanian (%)
Ancestries Reported - Norwegian (%)
Ancestries Reported - Polish (%)
Ancestries Reported - Portuguese (%)
Ancestries Reported - Russian (%)
Ancestries Reported - Scotch-Irish (%)
Ancestries Reported - Scottish (%)
Ancestries Reported - Slovak (%)
Ancestries Reported - Subsaharan African (%)
Ancestries Reported - Swedish (%)
Ancestries Reported - Swiss (%)
Ancestries Reported - Ukrainian (%)
Ancestries Reported - United States (%)
Ancestries Reported - Welsh (%)
Ancestries Reported - West Indian (%)
Ancestries Reported - Other (%)
Geographical mobility - Same house 1 year ago (%)
Geographical mobility - Same house 1 year ago (%) - White
Geographical mobility - Same house 1 year ago (%) - Black or African American
Geographical mobility - Same house 1 year ago (%) - Asian
Geographical mobility - Same house 1 year ago (%) - Hispanic or Latino
Geographical mobility - Same house 1 year ago (%) - American Indian and Alaska Native
Geographical mobility - Same house 1 year ago (%) - Multirace
Geographical mobility - Same house 1 year ago (%) - Other Race
Geographical mobility - Moved within same county (%)
Geographical mobility - Moved within same county (%) - White
Geographical mobility - Moved within same county (%) - Black or African American
Geographical mobility - Moved within same county (%) - Asian
Geographical mobility - Moved within same county (%) - Hispanic or Latino
Geographical mobility - Moved within same county (%) - American Indian and Alaska Native
Geographical mobility - Moved within same county (%) - Multirace
Geographical mobility - Moved within same county (%) - Other Race
Geographical mobility - Moved from different county within same state (%)
Geographical mobility - Moved from different county within same state (%) - White
Geographical mobility - Moved from different county within same state (%) - Black or African American
Geographical mobility - Moved from different county within same state (%) - Asian
Geographical mobility - Moved from different county within same state (%) - Hispanic or Latino
Geographical mobility - Moved from different county within same state (%) - American Indian and Alaska Native
Geographical mobility - Moved from different county within same state (%) - Multirace
Geographical mobility - Moved from different county within same state (%) - Other Race
Geographical mobility - Moved from different state (%)
Geographical mobility - Moved from different state (%) - White
Geographical mobility - Moved from different state (%) - Black or African American
Geographical mobility - Moved from different state (%) - Asian
Geographical mobility - Moved from different state (%) - Hispanic or Latino
Geographical mobility - Moved from different state (%) - American Indian and Alaska Native
Geographical mobility - Moved from different state (%) - Multirace
Geographical mobility - Moved from different state (%) - Other Race
Geographical mobility - Moved from abroad (%)
Geographical mobility - Moved from abroad (%) - White
Geographical mobility - Moved from abroad (%) - Black or African American
Geographical mobility - Moved from abroad (%) - Asian
Geographical mobility - Moved from abroad (%) - Hispanic or Latino
Geographical mobility - Moved from abroad (%) - American Indian and Alaska Native
Geographical mobility - Moved from abroad (%) - Multirace
Geographical mobility - Moved from abroad (%) - Other Race
Place of birth for the foreign-born population - Ireland (%)
Place of birth for the foreign-born population - Denmark (%)
Place of birth for the foreign-born population - Norway (%)
Place of birth for the foreign-born population - Sweden (%)
Place of birth for the foreign-born population - United Kingdom (%)
Place of birth for the foreign-born population - England (%)
Place of birth for the foreign-born population - Scotland (%)
Place of birth for the foreign-born population - Other Northern Europe (%)
Place of birth for the foreign-born population - Austria (%)
Place of birth for the foreign-born population - Belgium (%)
Place of birth for the foreign-born population - France (%)
Place of birth for the foreign-born population - Germany (%)
Place of birth for the foreign-born population - Netherlands (%)
Place of birth for the foreign-born population - Switzerland (%)
Place of birth for the foreign-born population - Other Western Europe (%)
Place of birth for the foreign-born population - Greece (%)
Place of birth for the foreign-born population - Italy (%)
Place of birth for the foreign-born population - Portugal (%)
Place of birth for the foreign-born population - Spain (%)
Place of birth for the foreign-born population - Other Southern Europe (%)
Place of birth for the foreign-born population - Albania (%)
Place of birth for the foreign-born population - Belarus (%)
Place of birth for the foreign-born population - Bosnia and Herzegovina (%)
Place of birth for the foreign-born population - Bulgaria (%)
Place of birth for the foreign-born population - Croatia (%)
Place of birth for the foreign-born population - Czechoslovakia (%)
Place of birth for the foreign-born population - Hungary (%)
Place of birth for the foreign-born population - Latvia (%)
Place of birth for the foreign-born population - Lithuania (%)
Place of birth for the foreign-born population - North Macedonia (Macedonia) (%)
Place of birth for the foreign-born population - Moldova (%)
Place of birth for the foreign-born population - Poland (%)
Place of birth for the foreign-born population - Romania (%)
Place of birth for the foreign-born population - Russia (%)
Place of birth for the foreign-born population - Serbia (%)
Place of birth for the foreign-born population - Ukraine (%)
Place of birth for the foreign-born population - Other Eastern Europe (%)
Place of birth for the foreign-born population - China (%)
Place of birth for the foreign-born population - Hong Kong (%)
Place of birth for the foreign-born population - Taiwan (%)
Place of birth for the foreign-born population - Japan (%)
Place of birth for the foreign-born population - Korea (%)
Place of birth for the foreign-born population - Other Eastern Asia (%)
Place of birth for the foreign-born population - Afghanistan (%)
Place of birth for the foreign-born population - Bangladesh (%)
Place of birth for the foreign-born population - India (%)
Place of birth for the foreign-born population - Iran (%)
Place of birth for the foreign-born population - Kazakhstan (%)
Place of birth for the foreign-born population - Nepal (%)
Place of birth for the foreign-born population - Pakistan (%)
Place of birth for the foreign-born population - Sri Lanka (%)
Place of birth for the foreign-born population - Uzbekistan (%)
Place of birth for the foreign-born population - Other South Central Asia (%)
Place of birth for the foreign-born population - Burma (%)
Place of birth for the foreign-born population - Cambodia (%)
Place of birth for the foreign-born population - Indonesia (%)
Place of birth for the foreign-born population - Laos (%)
Place of birth for the foreign-born population - Malaysia (%)
Place of birth for the foreign-born population - Philippines (%)
Place of birth for the foreign-born population - Singapore (%)
Place of birth for the foreign-born population - Thailand (%)
Place of birth for the foreign-born population - Vietnam (%)
Place of birth for the foreign-born population - Other South Eastern Asia (%)
Place of birth for the foreign-born population - Armenia (%)
Place of birth for the foreign-born population - Iraq (%)
Place of birth for the foreign-born population - Israel (%)
Place of birth for the foreign-born population - Jordan (%)
Place of birth for the foreign-born population - Kuwait (%)
Place of birth for the foreign-born population - Lebanon (%)
Place of birth for the foreign-born population - Saudi Arabia (%)
Place of birth for the foreign-born population - Syria (%)
Place of birth for the foreign-born population - Turkey (%)
Place of birth for the foreign-born population - Yemen (%)
Place of birth for the foreign-born population - Other Western Asia (%)
Place of birth for the foreign-born population - Eritrea (%)
Place of birth for the foreign-born population - Ethiopia (%)
Place of birth for the foreign-born population - Kenya (%)
Place of birth for the foreign-born population - Somalia (%)
Place of birth for the foreign-born population - Uganda (%)
Place of birth for the foreign-born population - Zimbabwe (%)
Place of birth for the foreign-born population - Other Eastern Africa (%)
Place of birth for the foreign-born population - Cameroon (%)
Place of birth for the foreign-born population - Congo (%)
Place of birth for the foreign-born population - Democratic Republic of Congo (Zaire) (%)
Place of birth for the foreign-born population - Other Middle Africa (%)
Place of birth for the foreign-born population - Egypt (%)
Place of birth for the foreign-born population - Morocco (%)
Place of birth for the foreign-born population - Sudan (%)
Place of birth for the foreign-born population - Other Northern Africa (%)
Place of birth for the foreign-born population - South Africa (%)
Place of birth for the foreign-born population - Other Southern Africa (%)
Place of birth for the foreign-born population - Cabo Verde (%)
Place of birth for the foreign-born population - Ghana (%)
Place of birth for the foreign-born population - Liberia (%)
Place of birth for the foreign-born population - Nigeria (%)
Place of birth for the foreign-born population - Senegal (%)
Place of birth for the foreign-born population - Sierra Leone (%)
Place of birth for the foreign-born population - Other Western Africa (%)
Place of birth for the foreign-born population - Australia (%)
Place of birth for the foreign-born population - New Zealand (%)
Place of birth for the foreign-born population - Fiji (%)
Place of birth for the foreign-born population - Micronesia (%)
Place of birth for the foreign-born population - Bahamas (%)
Place of birth for the foreign-born population - Barbados (%)
Place of birth for the foreign-born population - Cuba (%)
Place of birth for the foreign-born population - Dominica (%)
Place of birth for the foreign-born population - Dominican Republic (%)
Place of birth for the foreign-born population - Grenada (%)
Place of birth for the foreign-born population - Haiti (%)
Place of birth for the foreign-born population - Jamaica (%)
Place of birth for the foreign-born population - St. Vincent and the Grenadines (%)
Place of birth for the foreign-born population - Trinidad and Tobago (%)
Place of birth for the foreign-born population - West Indies (%)
Place of birth for the foreign-born population - Other Caribbean (%)
Place of birth for the foreign-born population - Belize (%)
Place of birth for the foreign-born population - Costa Rica (%)
Place of birth for the foreign-born population - El Salvador (%)
Place of birth for the foreign-born population - Guatemala (%)
Place of birth for the foreign-born population - Honduras (%)
Place of birth for the foreign-born population - Mexico (%)
Place of birth for the foreign-born population - Nicaragua (%)
Place of birth for the foreign-born population - Panama (%)
Place of birth for the foreign-born population - Other Central America (%)
Place of birth for the foreign-born population - Argentina (%)
Place of birth for the foreign-born population - Bolivia (%)
Place of birth for the foreign-born population - Brazil (%)
Place of birth for the foreign-born population - Chile (%)
Place of birth for the foreign-born population - Colombia (%)
Place of birth for the foreign-born population - Ecuador (%)
Place of birth for the foreign-born population - Guyana (%)
Place of birth for the foreign-born population - Peru (%)
Place of birth for the foreign-born population - Uruguay (%)
Place of birth for the foreign-born population - Venezuela (%)
Place of birth for the foreign-born population - Other South America (%)
Place of birth for the foreign-born population - Canada (%)
Place of birth for the foreign-born population - Other Northern America (%)
Place of birth for the foreign-born population - Other (%)
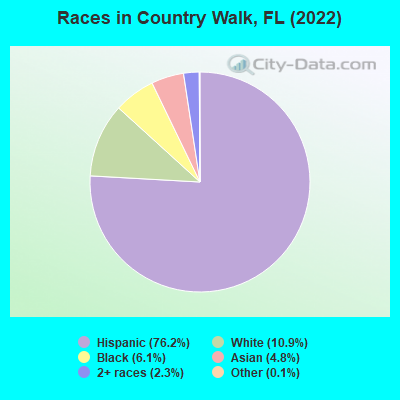
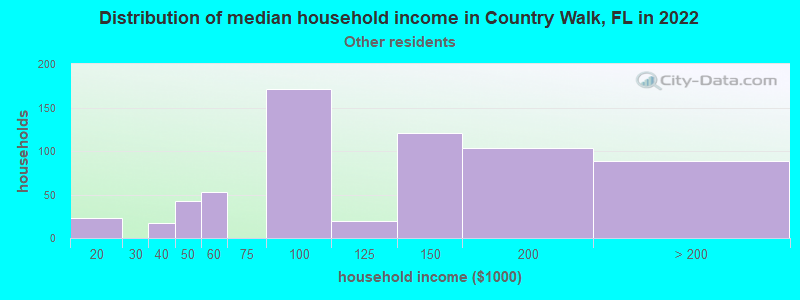
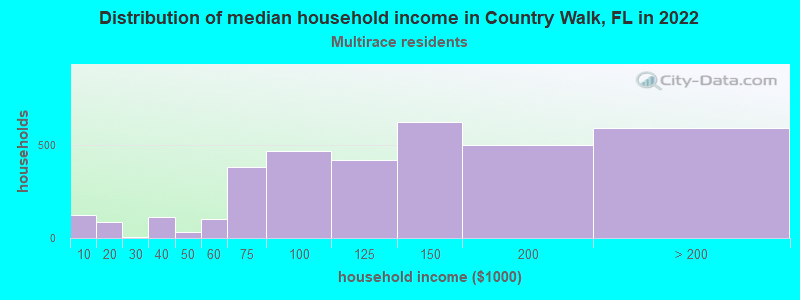
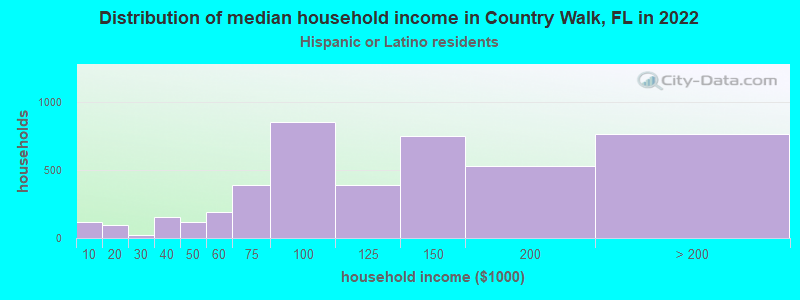
According to 2022 data, the most numerous races in Country Walk, FL are White alone (2,021 residents), Hispanic (14,183 residents), and Black alone (1,141 residents). 22.7% of Country Walk residents speak English at home. 46.6% of Country Walk, FL residents are foreign-born (42.0% born in Latin America), which is 55.0% greater than the foreign-born rate of 21.0% across the entire state of Florida.
Race distribution in Country Walk
2000 2022
10,458,509 65.4% White alone 2,682,715 16.8% Hispanic 2,264,268 14.2% Black alone 261,693 1.6% Asian alone 236,954 1.5% Two or more races 42,358 0.3% American Indian alone 28,994 0.2% Other race alone 6,887 0.04% Native Hawaiian and Other
11,309,403 50.8% White alone 6,025,039 27.1% Hispanic 3,241,015 14.6% Black alone 861,630 3.9% Two or more races 623,692 2.8% Asian alone 152,054 0.7% Other race alone 22,504 0.1% American Indian alone 9,486 0.04% Native Hawaiian and Other
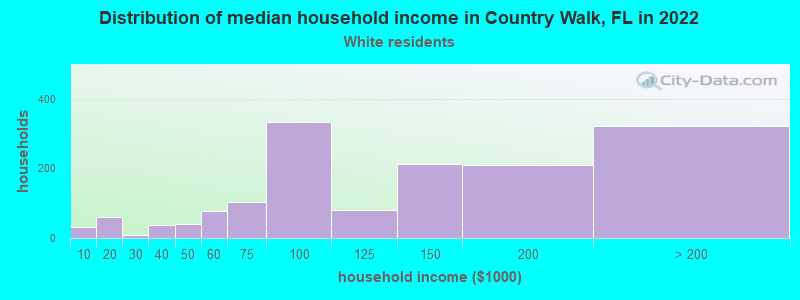
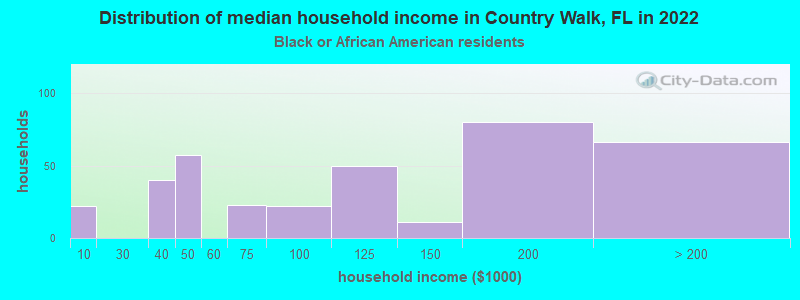
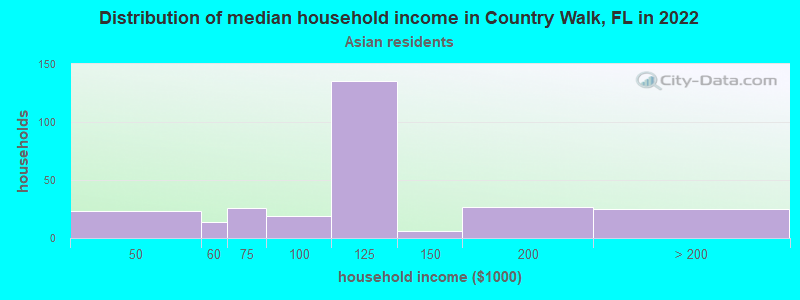
Income and house value in Country Walk Median household income in 2022 $92,597 White non-Hispanic householders$110,569 Black householders$118,161 Asian householders$141,739 Some other race householders$117,989 Two or more races householders$111,208 Hispanic or Latino race householdersMedian 2022 house value $571,180 White Non-Hispanic householders$580,855 Black or African American householders $613,228 Asian householders$521,318 Some other race householders$452,107 Two or more races householders$503,829 Hispanic or Latino householders
Median age by race in Country Walk
38.0 Median age for White residents34.2 40.4 54.3 Median age for Black or African American residents56.0 54.2 -653,446,647.1 Median age for American Indian / Alaska Native residents-543,352,600.6 -762,696,213.5 41.9 Median age for Asian residents27.7 52.1 -679,849,340.2 Median age for Native Hawaiian / Pacific Islander residents-858,307,848.3 -443,298,968.6 26.2 Median age for Other race residents26.6 25.8 35.5 Median age for Two or more races residents35.6 35.3 40.6 Median age for White alone residents37.5 41.2 36.5 Median age for Hispanic or Latino residents35.2 39.3
Owner/renter occupied households by race in Country Walk
House owners and renters - White residents 1,197 80.9% Owner occupied282 19.1% Renter occupiedHouse owners and renters - Black or African American residents 323 100.0% Owner occupiedHouse owners and renters - Asian residents 234 91.5% Owner occupied22 8.5% Renter occupiedHouse owners and renters - Other race residents 445 72.7% Owner occupied167 27.3% Renter occupiedHouse owners and renters - Two or more races residents 2,915 85.6% Owner occupied492 14.4% Renter occupiedHouse owners and renters - White alone residents 399 59.5% Owner occupied271 40.5% Renter occupiedHouse owners and renters - Hispanic or Latino residents 3,601 84.4% Owner occupied666 15.6% Renter occupied
Language usage in Country Walk
English speakers - Total 22.7% of residents of Country Walk speak English at home.
71.1% of residents speak Spanish at home 9,208 73.6% Speak English very well3,307 26.4% Speak English less than very well5.5% of residents speak other language at home 448 46.7% Speak English very well512 53.3% Speak English less than very well
English speakers - Born in the United States 36.5% of residents of Country Walk speak English at home.
60.5% of residents speak Spanish at home 1,176 93.1% Speak English very well87 6.9% Speak English less than very well2.0% of residents speak other language at home 41 100.0% Speak English very well
English speakers - Native, born elsewhere 14.9% of residents of Country Walk speak English at home.
78.4% of residents speak Spanish at home 598 86.9% Speak English very well90 13.1% Speak English less than very well3.2% of residents speak other language at home 10 35.7% Speak English very well18 64.3% Speak English less than very well
English speakers - Foreign-born 12.6% of residents of Country Walk speak English at home.
77.3% of residents speak Spanish at home 3,845 57.9% Speak English very well2,793 42.1% Speak English less than very well9.1% of residents speak other language at home 329 42.0% Speak English very well454 58.0% Speak English less than very well
White (Caucasian) - Speak only English Native:
47.7% (1,541)Foreign-born:
11.5% (155)
White (Caucasian) - Speak another language Native:
49.7% (1,606)Foreign-born:
89.2% (1,201)
Black or African American - Speak only English Native:
86.1% (494)Foreign-born:
56.2% (326)
Black or African American - Speak another language Native:
13.9% (80)Foreign-born:
46.7% (271)
Asian - Speak only English Native:
76.8% (220)Foreign-born:
23.8% (146)
Asian - Speak another language Native:
24.3% (69)Foreign-born:
75.2% (463)
Other race - Speak another language Native:
94.1% (1,176)Foreign-born:
100.0% (1,359)
Two or more races - Speak only English Native:
16.9% (770)Foreign-born:
11.1% (577)
Two or more races - Speak another language Native:
83.2% (3,801)Foreign-born:
89.9% (4,688)
White alone - Speak only English Native:
66.6% (1,289)Foreign-born:
76.9% (37)
White alone - Speak another language Native:
32.8% (635)Foreign-born:
35.5% (17)
Hispanic or Latino - Speak only English Native:
13.4% (814)Foreign-born:
6.3% (447)
Hispanic or Latino - Speak another language Native:
86.5% (5,264)Foreign-born:
93.9% (6,705)
Foreign-born residents in Country Walk 8,683 residents are foreign born (42.0% Latin America ).
This city:
46.6%Florida:
21.1%
Marital status for residents in Country Walk Marital status - White (Caucasian) population 15 years and over
Males 31.8% Never married57.1% Now married1.2% Separated0.5% Widowed9.4% DivorcedFemales 20.9% Never married52.6% Now married1.4% Separated5.2% Widowed19.9% DivorcedWomen who gave birth in the past 12 months Now married:
100.0% (24)Unmarried:
0.0% (0)
Women who did not give birth in the past 12 months Now married:
51.7% (460)Unmarried:
48.3% (431)
Marital status - Black or African American population 15 years and over
Males 10.5% Never married68.6% Now married0.0% Separated5.7% Widowed15.1% DivorcedFemales 25.7% Never married50.1% Now married0.0% Separated22.6% Widowed1.5% DivorcedWomen who did not give birth in the past 12 months Now married:
50.5% (95)Unmarried:
49.5% (93)
Marital status - Asian population 15 years and over
Males 43.3% Never married52.5% Now married0.0% Separated0.0% Widowed4.2% DivorcedFemales 57.0% Never married23.1% Now married6.3% Separated8.5% Widowed5.1% DivorcedWomen who gave birth in the past 12 months Now married:
100.0% (30)Unmarried:
0.0% (0)
Women who did not give birth in the past 12 months Now married:
46.2% (70)Unmarried:
53.8% (81)
Marital status - Other race population 15 years and over
Males 59.0% Never married40.1% Now married0.8% Separated0.0% Widowed0.0% DivorcedFemales 23.2% Never married55.1% Now married5.0% Separated2.8% Widowed13.9% DivorcedWomen who gave birth in the past 12 months Now married:
60.9% (78)Unmarried:
39.1% (50)
Women who did not give birth in the past 12 months Now married:
58.8% (241)Unmarried:
41.2% (169)
Marital status - Two or more races population 15 years and over
Males 38.3% Never married47.9% Now married0.0% Separated0.0% Widowed13.7% DivorcedFemales 28.0% Never married46.5% Now married4.9% Separated6.9% Widowed13.7% DivorcedWomen who did not give birth in the past 12 months Now married:
52.4% (1,291)Unmarried:
47.6% (1,175)
Marital status - White alone, not Hispanic / Latino population 15 years and over
Males 28.4% Never married57.9% Now married0.0% Separated0.1% Widowed13.6% DivorcedFemales 36.4% Never married43.0% Now married0.0% Separated6.4% Widowed14.2% DivorcedWomen who did not give birth in the past 12 months Now married:
43.9% (219)Unmarried:
56.1% (279)
Marital status - Hispanic or Latino population 15 years and over
Males 38.6% Never married50.6% Now married0.8% Separated0.3% Widowed9.8% DivorcedFemales 21.3% Never married52.4% Now married3.6% Separated5.4% Widowed17.4% DivorcedWomen who gave birth in the past 12 months Now married:
73.5% (97)Unmarried:
26.5% (35)
Women who did not give birth in the past 12 months Now married:
54.8% (1,563)Unmarried:
45.2% (1,289)
Ancestries in Country Walk
609 4.8% American286 2.2% Jamaican261 2.0% Haitian164 1.3% Italian138 1.1% African76 0.6% Scottish66 0.5% German42 0.3% Irish41 0.3% Brazilian31 0.2% Scandinavian29 0.2% Lebanese27 0.2% English27 0.2% Guyanese23 0.2% Bahamian18 0.1% Russian13 0.1% Palestinian10 0.08% Portuguese9 0.07% Polish
Children Nativity (place of birth) in Country Walk
Children under 6 years - Living with two parents Both parents native 312 100.0% NativeBoth parents foreign-born 207 72.0% Native80 28.0% Foreign-bornOne native, one foreign-born parent 206 100.0% NativeChildren under 6 years - Living with one parent Native parent 86 100.0% NativeForeign-born parent 287 100.0% NativeChildren 6 to 17 years - Living with two parents Both parents native 709 99.9% Native0 0.1% Foreign-bornBoth parents foreign-born 970 74.3% Native335 25.7% Foreign-bornOne native, one foreign-born parent 368 94.7% Native20 5.3% Foreign-bornChildren 6 to 17 years - Living with one parent Native parent 178 100.0% NativeForeign-born parent 654 51.5% Native616 48.5% Foreign-born
Grandparents responsible for own grandchildren in Country Walk
Grandparents (30 to 59 years) White / Caucasian 10 20.1% Responsible for grandchildren41 79.9% Not responsible for grandchildrenAsian 22 100.0% Not responsible for grandchildrenOther race 24 100.0% Not responsible for grandchildrenTwo or more races 220 87.8% Responsible for grandchildren31 12.2% Not responsible for grandchildrenHispanic or Latino 134 58.4% Responsible for grandchildren95 41.6% Not responsible for grandchildrenGrandparents (60 years and over) White / Caucasian 125 100.0% Not responsible for grandchildrenAsian 13 62.4% Responsible for grandchildren8 37.6% Not responsible for grandchildrenOther race 42 100.0% Not responsible for grandchildrenTwo or more races 220 100.0% Not responsible for grandchildrenHispanic or Latino 264 100.0% Not responsible for grandchildren