Races in Covina, California (CA) Detailed Stats
Data:
Races - White alone (%)
Races - White alone (% change since 2000)
Races - Black alone (%)
Races - Black alone (% change since 2000)
Races - American Indian alone (%)
Races - American Indian alone (% change since 2000)
Races - Asian alone (%)
Races - Asian alone (% change since 2000)
Races - Hispanic (%)
Races - Hispanic (% change since 2000)
Races - Native Hawaiian and Other Pacific Islander alone (%)
Races - Native Hawaiian and Other Pacific Islander alone (% change since 2000)
Races - Two or more races(%)
Races - Two or more races(% change since 2000)
Races - Other race alone (%)
Races - Other race alone (% change since 2000)
Racial diversity
Place of birth - Born in state of residence (%)
Place of birth - Born in state of residence (%) - White
Place of birth - Born in state of residence (%) - Black or African American
Place of birth - Born in state of residence (%) - Asian
Place of birth - Born in state of residence (%) - Hispanic or Latino
Place of birth - Born in state of residence (%) - American Indian and Alaska Native
Place of birth - Born in state of residence (%) - Multirace
Place of birth - Born in state of residence (%) - Other Race
Place of birth - Born in other state (%)
Place of birth - Born in other state (%) - White
Place of birth - Born in other state (%) - Black or African American
Place of birth - Born in other state (%) - Asian
Place of birth - Born in other state (%) - Hispanic or Latino
Place of birth - Born in other state (%) - American Indian and Alaska Native
Place of birth - Born in other state (%) - Multirace
Place of birth - Born in other state (%) - Other Race
Place of birth - Native, outside of US (%)
Place of birth - Native, outside of US (%) - White
Place of birth - Native, outside of US (%) - Black or African American
Place of birth - Native, outside of US (%) - Asian
Place of birth - Native, outside of US (%) - Hispanic or Latino
Place of birth - Native, outside of US (%) - American Indian and Alaska Native
Place of birth - Native, outside of US (%) - Multirace
Place of birth - Native, outside of US (%) - Other Race
Place of birth - Foreign born (%)
Place of birth - Foreign born (%) - White
Place of birth - Foreign born (%) - Black or African American
Place of birth - Foreign born (%) - Asian
Place of birth - Foreign born (%) - Hispanic or Latino
Place of birth - Foreign born (%) - American Indian and Alaska Native
Place of birth - Foreign born (%) - Multirace
Place of birth - Foreign born (%) - Other Race
Residents speaking English at home (%)
Residents speaking English at home - Born in the United States (%)
Residents speaking English at home - Native, born elsewhere (%)
Residents speaking English at home - Foreign born (%)
Residents speaking Spanish at home (%)
Residents speaking Spanish at home - Born in the United States (%)
Residents speaking Spanish at home - Native, born elsewhere (%)
Residents speaking Spanish at home - Foreign born (%)
Residents speaking other language at home (%)
Residents speaking other language at home - Born in the United States (%)
Residents speaking other language at home - Native, born elsewhere (%)
Residents speaking other language at home - Foreign born (%)
Marital status - Never married (%)
Marital status - Now married (%)
Marital status - Separated (%)
Marital status - Widowed (%)
Marital status - Divorced (%)
Ancestries Reported - Arab (%)
Ancestries Reported - Czech (%)
Ancestries Reported - Danish (%)
Ancestries Reported - Dutch (%)
Ancestries Reported - English (%)
Ancestries Reported - French (%)
Ancestries Reported - French Canadian (%)
Ancestries Reported - German (%)
Ancestries Reported - Greek (%)
Ancestries Reported - Hungarian (%)
Ancestries Reported - Irish (%)
Ancestries Reported - Italian (%)
Ancestries Reported - Lithuanian (%)
Ancestries Reported - Norwegian (%)
Ancestries Reported - Polish (%)
Ancestries Reported - Portuguese (%)
Ancestries Reported - Russian (%)
Ancestries Reported - Scotch-Irish (%)
Ancestries Reported - Scottish (%)
Ancestries Reported - Slovak (%)
Ancestries Reported - Subsaharan African (%)
Ancestries Reported - Swedish (%)
Ancestries Reported - Swiss (%)
Ancestries Reported - Ukrainian (%)
Ancestries Reported - United States (%)
Ancestries Reported - Welsh (%)
Ancestries Reported - West Indian (%)
Ancestries Reported - Other (%)
Geographical mobility - Same house 1 year ago (%)
Geographical mobility - Same house 1 year ago (%) - White
Geographical mobility - Same house 1 year ago (%) - Black or African American
Geographical mobility - Same house 1 year ago (%) - Asian
Geographical mobility - Same house 1 year ago (%) - Hispanic or Latino
Geographical mobility - Same house 1 year ago (%) - American Indian and Alaska Native
Geographical mobility - Same house 1 year ago (%) - Multirace
Geographical mobility - Same house 1 year ago (%) - Other Race
Geographical mobility - Moved within same county (%)
Geographical mobility - Moved within same county (%) - White
Geographical mobility - Moved within same county (%) - Black or African American
Geographical mobility - Moved within same county (%) - Asian
Geographical mobility - Moved within same county (%) - Hispanic or Latino
Geographical mobility - Moved within same county (%) - American Indian and Alaska Native
Geographical mobility - Moved within same county (%) - Multirace
Geographical mobility - Moved within same county (%) - Other Race
Geographical mobility - Moved from different county within same state (%)
Geographical mobility - Moved from different county within same state (%) - White
Geographical mobility - Moved from different county within same state (%) - Black or African American
Geographical mobility - Moved from different county within same state (%) - Asian
Geographical mobility - Moved from different county within same state (%) - Hispanic or Latino
Geographical mobility - Moved from different county within same state (%) - American Indian and Alaska Native
Geographical mobility - Moved from different county within same state (%) - Multirace
Geographical mobility - Moved from different county within same state (%) - Other Race
Geographical mobility - Moved from different state (%)
Geographical mobility - Moved from different state (%) - White
Geographical mobility - Moved from different state (%) - Black or African American
Geographical mobility - Moved from different state (%) - Asian
Geographical mobility - Moved from different state (%) - Hispanic or Latino
Geographical mobility - Moved from different state (%) - American Indian and Alaska Native
Geographical mobility - Moved from different state (%) - Multirace
Geographical mobility - Moved from different state (%) - Other Race
Geographical mobility - Moved from abroad (%)
Geographical mobility - Moved from abroad (%) - White
Geographical mobility - Moved from abroad (%) - Black or African American
Geographical mobility - Moved from abroad (%) - Asian
Geographical mobility - Moved from abroad (%) - Hispanic or Latino
Geographical mobility - Moved from abroad (%) - American Indian and Alaska Native
Geographical mobility - Moved from abroad (%) - Multirace
Geographical mobility - Moved from abroad (%) - Other Race
Place of birth for the foreign-born population - Ireland (%)
Place of birth for the foreign-born population - Denmark (%)
Place of birth for the foreign-born population - Norway (%)
Place of birth for the foreign-born population - Sweden (%)
Place of birth for the foreign-born population - United Kingdom (%)
Place of birth for the foreign-born population - England (%)
Place of birth for the foreign-born population - Scotland (%)
Place of birth for the foreign-born population - Other Northern Europe (%)
Place of birth for the foreign-born population - Austria (%)
Place of birth for the foreign-born population - Belgium (%)
Place of birth for the foreign-born population - France (%)
Place of birth for the foreign-born population - Germany (%)
Place of birth for the foreign-born population - Netherlands (%)
Place of birth for the foreign-born population - Switzerland (%)
Place of birth for the foreign-born population - Other Western Europe (%)
Place of birth for the foreign-born population - Greece (%)
Place of birth for the foreign-born population - Italy (%)
Place of birth for the foreign-born population - Portugal (%)
Place of birth for the foreign-born population - Spain (%)
Place of birth for the foreign-born population - Other Southern Europe (%)
Place of birth for the foreign-born population - Albania (%)
Place of birth for the foreign-born population - Belarus (%)
Place of birth for the foreign-born population - Bosnia and Herzegovina (%)
Place of birth for the foreign-born population - Bulgaria (%)
Place of birth for the foreign-born population - Croatia (%)
Place of birth for the foreign-born population - Czechoslovakia (%)
Place of birth for the foreign-born population - Hungary (%)
Place of birth for the foreign-born population - Latvia (%)
Place of birth for the foreign-born population - Lithuania (%)
Place of birth for the foreign-born population - North Macedonia (Macedonia) (%)
Place of birth for the foreign-born population - Moldova (%)
Place of birth for the foreign-born population - Poland (%)
Place of birth for the foreign-born population - Romania (%)
Place of birth for the foreign-born population - Russia (%)
Place of birth for the foreign-born population - Serbia (%)
Place of birth for the foreign-born population - Ukraine (%)
Place of birth for the foreign-born population - Other Eastern Europe (%)
Place of birth for the foreign-born population - China (%)
Place of birth for the foreign-born population - Hong Kong (%)
Place of birth for the foreign-born population - Taiwan (%)
Place of birth for the foreign-born population - Japan (%)
Place of birth for the foreign-born population - Korea (%)
Place of birth for the foreign-born population - Other Eastern Asia (%)
Place of birth for the foreign-born population - Afghanistan (%)
Place of birth for the foreign-born population - Bangladesh (%)
Place of birth for the foreign-born population - India (%)
Place of birth for the foreign-born population - Iran (%)
Place of birth for the foreign-born population - Kazakhstan (%)
Place of birth for the foreign-born population - Nepal (%)
Place of birth for the foreign-born population - Pakistan (%)
Place of birth for the foreign-born population - Sri Lanka (%)
Place of birth for the foreign-born population - Uzbekistan (%)
Place of birth for the foreign-born population - Other South Central Asia (%)
Place of birth for the foreign-born population - Burma (%)
Place of birth for the foreign-born population - Cambodia (%)
Place of birth for the foreign-born population - Indonesia (%)
Place of birth for the foreign-born population - Laos (%)
Place of birth for the foreign-born population - Malaysia (%)
Place of birth for the foreign-born population - Philippines (%)
Place of birth for the foreign-born population - Singapore (%)
Place of birth for the foreign-born population - Thailand (%)
Place of birth for the foreign-born population - Vietnam (%)
Place of birth for the foreign-born population - Other South Eastern Asia (%)
Place of birth for the foreign-born population - Armenia (%)
Place of birth for the foreign-born population - Iraq (%)
Place of birth for the foreign-born population - Israel (%)
Place of birth for the foreign-born population - Jordan (%)
Place of birth for the foreign-born population - Kuwait (%)
Place of birth for the foreign-born population - Lebanon (%)
Place of birth for the foreign-born population - Saudi Arabia (%)
Place of birth for the foreign-born population - Syria (%)
Place of birth for the foreign-born population - Turkey (%)
Place of birth for the foreign-born population - Yemen (%)
Place of birth for the foreign-born population - Other Western Asia (%)
Place of birth for the foreign-born population - Eritrea (%)
Place of birth for the foreign-born population - Ethiopia (%)
Place of birth for the foreign-born population - Kenya (%)
Place of birth for the foreign-born population - Somalia (%)
Place of birth for the foreign-born population - Uganda (%)
Place of birth for the foreign-born population - Zimbabwe (%)
Place of birth for the foreign-born population - Other Eastern Africa (%)
Place of birth for the foreign-born population - Cameroon (%)
Place of birth for the foreign-born population - Congo (%)
Place of birth for the foreign-born population - Democratic Republic of Congo (Zaire) (%)
Place of birth for the foreign-born population - Other Middle Africa (%)
Place of birth for the foreign-born population - Egypt (%)
Place of birth for the foreign-born population - Morocco (%)
Place of birth for the foreign-born population - Sudan (%)
Place of birth for the foreign-born population - Other Northern Africa (%)
Place of birth for the foreign-born population - South Africa (%)
Place of birth for the foreign-born population - Other Southern Africa (%)
Place of birth for the foreign-born population - Cabo Verde (%)
Place of birth for the foreign-born population - Ghana (%)
Place of birth for the foreign-born population - Liberia (%)
Place of birth for the foreign-born population - Nigeria (%)
Place of birth for the foreign-born population - Senegal (%)
Place of birth for the foreign-born population - Sierra Leone (%)
Place of birth for the foreign-born population - Other Western Africa (%)
Place of birth for the foreign-born population - Australia (%)
Place of birth for the foreign-born population - New Zealand (%)
Place of birth for the foreign-born population - Fiji (%)
Place of birth for the foreign-born population - Micronesia (%)
Place of birth for the foreign-born population - Bahamas (%)
Place of birth for the foreign-born population - Barbados (%)
Place of birth for the foreign-born population - Cuba (%)
Place of birth for the foreign-born population - Dominica (%)
Place of birth for the foreign-born population - Dominican Republic (%)
Place of birth for the foreign-born population - Grenada (%)
Place of birth for the foreign-born population - Haiti (%)
Place of birth for the foreign-born population - Jamaica (%)
Place of birth for the foreign-born population - St. Vincent and the Grenadines (%)
Place of birth for the foreign-born population - Trinidad and Tobago (%)
Place of birth for the foreign-born population - West Indies (%)
Place of birth for the foreign-born population - Other Caribbean (%)
Place of birth for the foreign-born population - Belize (%)
Place of birth for the foreign-born population - Costa Rica (%)
Place of birth for the foreign-born population - El Salvador (%)
Place of birth for the foreign-born population - Guatemala (%)
Place of birth for the foreign-born population - Honduras (%)
Place of birth for the foreign-born population - Mexico (%)
Place of birth for the foreign-born population - Nicaragua (%)
Place of birth for the foreign-born population - Panama (%)
Place of birth for the foreign-born population - Other Central America (%)
Place of birth for the foreign-born population - Argentina (%)
Place of birth for the foreign-born population - Bolivia (%)
Place of birth for the foreign-born population - Brazil (%)
Place of birth for the foreign-born population - Chile (%)
Place of birth for the foreign-born population - Colombia (%)
Place of birth for the foreign-born population - Ecuador (%)
Place of birth for the foreign-born population - Guyana (%)
Place of birth for the foreign-born population - Peru (%)
Place of birth for the foreign-born population - Uruguay (%)
Place of birth for the foreign-born population - Venezuela (%)
Place of birth for the foreign-born population - Other South America (%)
Place of birth for the foreign-born population - Canada (%)
Place of birth for the foreign-born population - Other Northern America (%)
Place of birth for the foreign-born population - Other (%)
Latest news about races in Covina, CA collected exclusively by city-data.com from local newspapers, TV, and radio stations
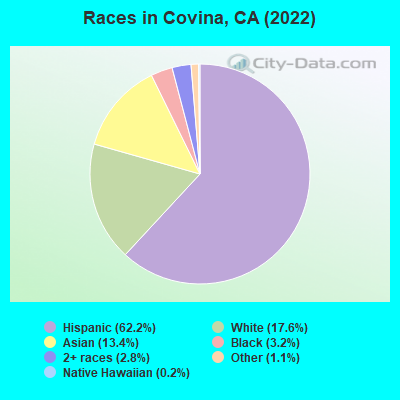
According to 2022 data, the most numerous races in Covina, CA are Hispanic (28,756 residents), White alone (10,088 residents), and Asian alone (6,403 residents). 52.3% of Covina residents speak English at home. 25.7% of Covina, CA residents are foreign-born (14.0% born in Latin America, 9.7% born in Asia), which is about the same as the foreign-born rate of 26.0% across the entire state of California.
Race distribution in Covina
2000 2022
19,801 42.3% White alone 18,871 40.3% Hispanic 4,490 9.6% Asian alone 2,245 4.8% Black alone 1,098 2.3% Two or more races 163 0.3% American Indian alone 88 0.2% Other race alone 81 0.2% Native Hawaiian and Other
28,756 59.9% Hispanic 10,088 21.0% White alone 6,403 13.3% Asian alone 1,493 3.1% Black alone 1,307 2.7% Two or more races 374 0.8% Other race alone 130 0.3% American Indian alone 22 0.05% Native Hawaiian and Other
2000 2022
15,816,790 46.7% White alone 10,966,556 32.4% Hispanic 3,648,860 10.8% Asian alone 2,181,926 6.4% Black alone 903,115 2.7% Two or more races 178,984 0.5% American Indian alone 103,736 0.3% Native Hawaiian and Other 71,681 0.2% Other race alone
15,732,184 40.3% Hispanic 13,160,426 33.7% White alone 5,957,867 15.3% Asian alone 2,025,218 5.2% Black alone 1,663,222 4.3% Two or more races 251,618 0.6% Other race alone 135,777 0.3% Native Hawaiian and Other 103,030 0.3% American Indian alone
Income and house value in Covina Median household income in 2022 $86,844 White non-Hispanic householders$93,426 Black householders$96,948 American Indian and Alaska Native householders$96,337 Asian householders$131,520 Native Hawaiian and other Pacific Islander householders$100,334 Some other race householders$76,633 Two or more races householders$99,034 Hispanic or Latino race householdersMedian 2022 house value $683,866 White Non-Hispanic householders$707,261 Black or African American householders$674,868 American Indian or Alaska Native householders $679,547 Asian householders$584,885 Native Hawaiian and other Pacific Islander householders$682,426 Some other race householders$672,348 Two or more races householders$674,868 Hispanic or Latino householders
Median age by race in Covina
42.8 Median age for White residents39.8 44.5 41.3 Median age for Black or African American residents42.4 39.2 39.6 Median age for American Indian / Alaska Native residents38.8 43.9 41.2 Median age for Asian residents39.6 42.8 37.8 Median age for Native Hawaiian / Pacific Islander residents33.7 Median age for Other race residents32.4 36.7 34.6 Median age for Two or more races residents35.0 34.0 52.2 Median age for White alone residents48.5 54.9 35.5 Median age for Hispanic or Latino residents33.4 37.0
Owner/renter occupied households by race in Covina
House owners and renters - White residents 4,761 58.6% Owner occupied3,369 41.4% Renter occupiedHouse owners and renters - Black or African American residents 296 47.0% Owner occupied334 53.0% Renter occupiedHouse owners and renters - American Indian / Alaska Native residents 171 38.6% Owner occupied272 61.4% Renter occupiedHouse owners and renters - Asian residents 1,628 71.0% Owner occupied664 29.0% Renter occupiedHouse owners and renters - Native Hawaiian / Pacific Islander residents 6 19.0% Owner occupied24 81.0% Renter occupiedHouse owners and renters - Other race residents 1,154 40.9% Owner occupied1,668 59.1% Renter occupiedHouse owners and renters - Two or more races residents 714 38.0% Owner occupied1,166 62.0% Renter occupiedHouse owners and renters - White alone residents 2,817 64.2% Owner occupied1,569 35.8% Renter occupiedHouse owners and renters - Hispanic or Latino residents 3,918 47.0% Owner occupied4,419 53.0% Renter occupied
Language usage in Covina
English speakers - Total 52.3% of residents of Covina speak English at home.
35.2% of residents speak Spanish at home 12,334 76.9% Speak English very well3,705 23.1% Speak English less than very well12.6% of residents speak other language at home 3,590 62.3% Speak English very well2,172 37.7% Speak English less than very well
English speakers - Born in the United States 79.8% of residents of Covina speak English at home.
17.1% of residents speak Spanish at home 734 96.6% Speak English very well26 3.4% Speak English less than very well3.3% of residents speak other language at home 137 94.5% Speak English very well8 5.5% Speak English less than very well
English speakers - Native, born elsewhere 42.5% of residents of Covina speak English at home.
35.9% of residents speak Spanish at home 81 51.9% Speak English very well75 48.1% Speak English less than very well21.6% of residents speak other language at home 47 50.0% Speak English very well47 50.0% Speak English less than very well
English speakers - Foreign-born 13.2% of residents of Covina speak English at home.
49.1% of residents speak Spanish at home 2,963 50.1% Speak English very well2,955 49.9% Speak English less than very well38.2% of residents speak other language at home 2,595 56.4% Speak English very well2,007 43.6% Speak English less than very well
White (Caucasian) - Speak only English Native:
77.5% (14,281)Foreign-born:
15.3% (489)
White (Caucasian) - Speak another language Native:
20.1% (3,707)Foreign-born:
83.8% (2,679)
Black or African American - Speak only English Native:
95.3% (1,251)Foreign-born:
69.9% (259)
Black or African American - Speak another language Native:
4.5% (59)Foreign-born:
21.8% (81)
American Indian / Alaska Native - Speak only English Native:
46.4% (563)Foreign-born:
15.8% (35)
American Indian / Alaska Native - Speak another language Native:
64.0% (777)Foreign-born:
85.2% (187)
Asian - Speak only English Native:
45.4% (846)Foreign-born:
11.3% (485)
Asian - Speak another language Native:
53.8% (1,002)Foreign-born:
88.7% (3,803)
Other race - Speak only English Native:
44.4% (3,118)Foreign-born:
7.5% (196)
Other race - Speak another language Native:
57.6% (4,047)Foreign-born:
93.0% (2,418)
Two or more races - Speak only English Native:
56.4% (2,744)Foreign-born:
12.4% (161)
Two or more races - Speak another language Native:
57.7% (2,808)Foreign-born:
84.9% (1,105)
White alone - Speak only English Native:
95.6% (8,523)Foreign-born:
16.4% (153)
White alone - Speak another language Native:
4.3% (383)Foreign-born:
84.1% (786)
Hispanic or Latino - Speak only English Native:
54.5% (11,723)Foreign-born:
11.0% (677)
Hispanic or Latino - Speak another language Native:
46.7% (10,039)Foreign-born:
90.2% (5,569)
Foreign-born residents in Covina 12,349 residents are foreign born (14.0% Latin America , 9.7% Asia ).
This city:
25.7%California:
100.0%
Marital status for residents in Covina Marital status - White (Caucasian) population 15 years and over
Males 42.3% Never married45.2% Now married1.2% Separated3.3% Widowed8.1% DivorcedFemales 34.9% Never married42.1% Now married1.8% Separated8.8% Widowed12.3% DivorcedWomen who gave birth in the past 12 months Now married:
60.5% (59)Unmarried:
39.5% (38)
Women who did not give birth in the past 12 months Now married:
38.0% (1,978)Unmarried:
62.0% (3,232)
Marital status - Black or African American population 15 years and over
Males 42.0% Never married48.8% Now married5.3% Separated0.0% Widowed3.9% DivorcedFemales 47.2% Never married34.9% Now married0.0% Separated7.4% Widowed10.5% DivorcedWomen who did not give birth in the past 12 months Now married:
26.1% (113)Unmarried:
73.9% (319)
Marital status - American Indian / Alaska Native population 15 years and over
Males 43.3% Never married47.0% Now married0.0% Separated4.6% Widowed5.1% DivorcedFemales 13.1% Never married73.5% Now married13.4% Separated0.0% Widowed0.0% DivorcedWomen who gave birth in the past 12 months Now married:
100.0% (23)Unmarried:
0.0% (0)
Women who did not give birth in the past 12 months Now married:
77.8% (92)Unmarried:
22.2% (26)
Marital status - Asian population 15 years and over
Males 32.8% Never married59.2% Now married0.6% Separated2.1% Widowed5.2% DivorcedFemales 23.8% Never married57.9% Now married2.0% Separated9.5% Widowed6.8% DivorcedWomen who gave birth in the past 12 months Now married:
100.0% (74)Unmarried:
0.0% (0)
Women who did not give birth in the past 12 months Now married:
54.2% (802)Unmarried:
45.8% (677)
Marital status - Other race population 15 years and over
Males 47.6% Never married46.0% Now married0.8% Separated1.9% Widowed3.8% DivorcedFemales 37.5% Never married40.2% Now married7.6% Separated3.9% Widowed10.8% DivorcedWomen who gave birth in the past 12 months Now married:
81.4% (85)Unmarried:
18.6% (19)
Women who did not give birth in the past 12 months Now married:
45.4% (1,288)Unmarried:
54.6% (1,546)
Marital status - Two or more races population 15 years and over
Males 63.9% Never married26.0% Now married1.5% Separated0.0% Widowed8.6% DivorcedFemales 41.9% Never married36.1% Now married1.2% Separated4.9% Widowed15.8% DivorcedWomen who gave birth in the past 12 months Now married:
31.1% (41)Unmarried:
68.9% (91)
Women who did not give birth in the past 12 months Now married:
31.9% (444)Unmarried:
68.1% (950)
Marital status - White alone, not Hispanic / Latino population 15 years and over
Males 33.1% Never married52.1% Now married0.6% Separated5.0% Widowed9.2% DivorcedFemales 25.4% Never married44.4% Now married1.6% Separated14.1% Widowed14.6% DivorcedWomen who gave birth in the past 12 months Now married:
52.2% (11)Unmarried:
47.8% (10)
Women who did not give birth in the past 12 months Now married:
43.0% (813)Unmarried:
57.0% (1,079)
Marital status - Hispanic or Latino population 15 years and over
Males 48.7% Never married42.3% Now married1.2% Separated1.9% Widowed5.9% DivorcedFemales 39.8% Never married40.9% Now married4.3% Separated4.4% Widowed10.6% DivorcedWomen who gave birth in the past 12 months Now married:
64.5% (158)Unmarried:
35.5% (87)
Women who did not give birth in the past 12 months Now married:
39.8% (3,023)Unmarried:
60.2% (4,570)
Ancestries in Covina
709 2.3% German663 2.2% American413 1.3% Irish392 1.3% English390 1.3% Italian292 1.0% European171 0.6% Egyptian103 0.3% Armenian94 0.3% Polish93 0.3% Arab82 0.3% Dutch79 0.3% Russian67 0.2% French61 0.2% Ethiopian59 0.2% African55 0.2% Norwegian52 0.2% Ghanaian48 0.2% Swedish40 0.1% Scottish38 0.1% Brazilian37 0.1% Iraqi37 0.1% Syrian36 0.1% Scandinavian32 0.1% Canadian31 0.1% Eastern European31 0.1% Scotch-Irish24 0.08% Danish24 0.08% Palestinian21 0.07% Portuguese21 0.07% Greek20 0.07% Lebanese18 0.06% Slovak17 0.06% French Canadian16 0.05% British16 0.05% Moroccan16 0.05% Welsh15 0.05% Iranian13 0.04% Slavic13 0.04% Pennsylvania German6 0.02% Ukrainian5 0.02% Czech5 0.02% Jamaican4 0.01% Trinidadian and Tobagonian
Geographical mobility in Covina Same house 1 year ago 20,569 92.6% White (Caucasian)1,665 95.8% Black or African American1,385 91.6% American Indian / Alaska Native5,756 89.2% Asian25 73.5% Native Hawaiian / Pacific Islander8,553 84.2% Other race6,176 92.7% Two or more races9,559 93.2% White alone, not Hispanic / Latino25,522 89.2% Hispanic or LatinoMoved within same county 1,219 5.5% White / Caucasian42 2.4% Black or African American96 6.4% American Indian / Alaska Native485 7.5% Asian8 24.2% Native Hawaiian / Pacific Islander1,133 11.2% Other race298 4.5% Two or more races531 5.2% White alone, not Hispanic / Latino2,200 7.7% Hispanic or LatinoMoved within same state 336 1.5% White / Caucasian49 2.8% Black or African American47 3.1% American Indian / Alaska Native173 2.7% Asian245 2.4% Other race183 2.7% Two or more races153 1.5% White alone, not Hispanic / Latino728 2.5% Hispanic or LatinoMoved from different state 113 0.5% White / Caucasian50 0.5% White alone, not Hispanic / Latino78 0.3% Hispanic or LatinoMoved from abroad 23 0.1% White58 0.9% Asian95 1.4% Two or more races14 0.1% White alone, not Hispanic / Latino29 0.1% Hispanic or Latino
Children Nativity (place of birth) in Covina
Children under 6 years - Living with two parents Both parents native 1,138 100.0% Native0 0.0% Foreign-bornBoth parents foreign-born 353 90.5% Native37 9.5% Foreign-bornOne native, one foreign-born parent 346 100.0% NativeChildren under 6 years - Living with one parent Native parent 820 100.0% NativeForeign-born parent 67 100.0% NativeChildren 6 to 17 years - Living with two parents Both parents native 2,191 100.0% NativeBoth parents foreign-born 1,052 86.8% Native159 13.2% Foreign-bornOne native, one foreign-born parent 1,095 99.3% Native8 0.7% Foreign-bornChildren 6 to 17 years - Living with one parent Native parent 1,820 100.0% NativeForeign-born parent 649 51.4% Native615 48.6% Foreign-born
Grandparents responsible for own grandchildren in Covina
Grandparents (30 to 59 years) White / Caucasian 46 35.0% Responsible for grandchildren86 65.0% Not responsible for grandchildrenBlack or African American 18 100.0% Responsible for grandchildrenAsian 41 100.0% Not responsible for grandchildrenOther race 61 45.6% Responsible for grandchildren72 54.4% Not responsible for grandchildrenWhite alone, not Hispanic / Latino 22 61.8% Responsible for grandchildren14 38.2% Not responsible for grandchildrenHispanic or Latino 107 37.9% Responsible for grandchildren176 62.1% Not responsible for grandchildrenGrandparents (60 years and over) White / Caucasian 42 8.9% Responsible for grandchildren435 91.1% Not responsible for grandchildrenAsian 170 100.0% Not responsible for grandchildrenOther race 177 100.0% Not responsible for grandchildrenWhite alone, not Hispanic / Latino 23 11.5% Responsible for grandchildren174 88.5% Not responsible for grandchildrenHispanic or Latino 217 26.3% Responsible for grandchildren609 73.7% Not responsible for grandchildren