Races in Eagle Mountain, Utah (UT) Detailed Stats
Data:
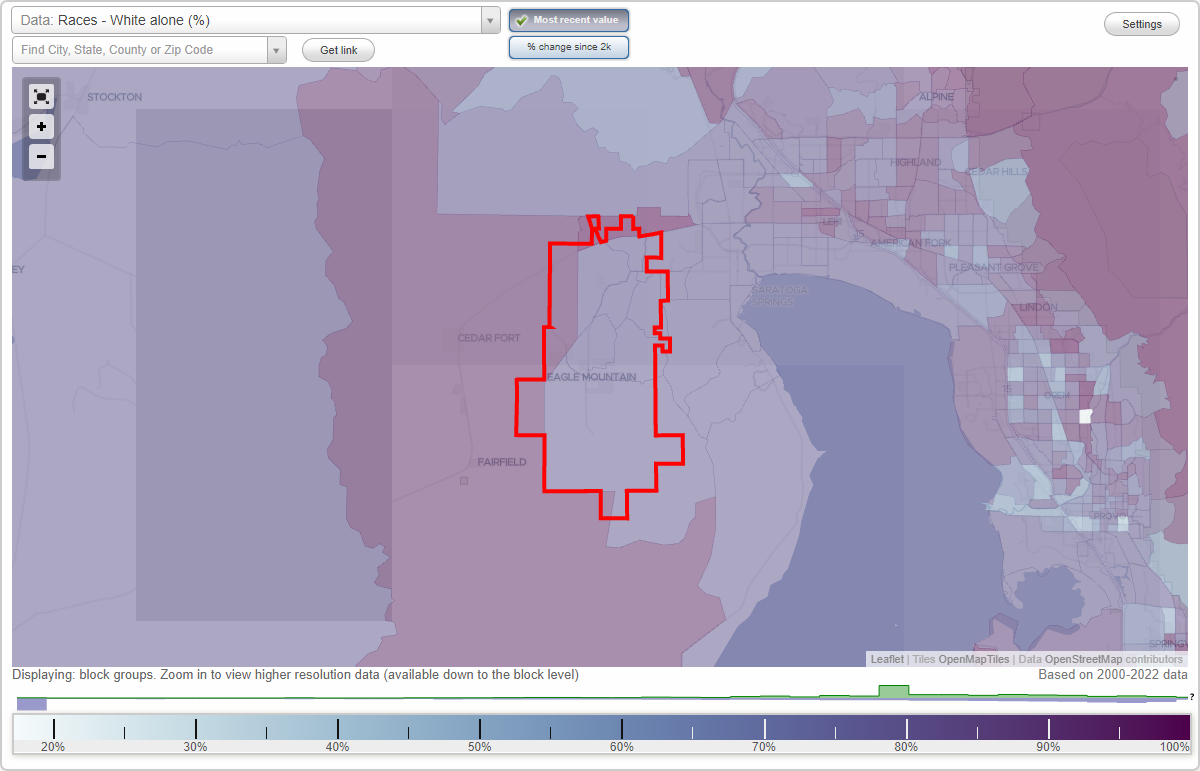
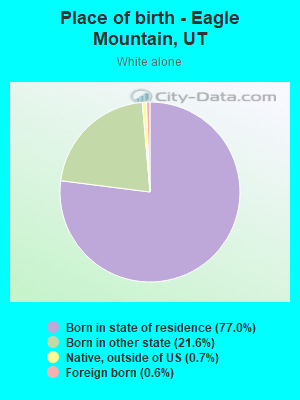
Races - White alone (%)
Races - White alone (% change since 2000)
Races - Black alone (%)
Races - Black alone (% change since 2000)
Races - American Indian alone (%)
Races - American Indian alone (% change since 2000)
Races - Asian alone (%)
Races - Asian alone (% change since 2000)
Races - Hispanic (%)
Races - Hispanic (% change since 2000)
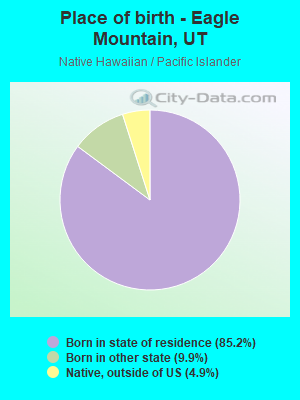
Races - Native Hawaiian and Other Pacific Islander alone (%)
Races - Native Hawaiian and Other Pacific Islander alone (% change since 2000)
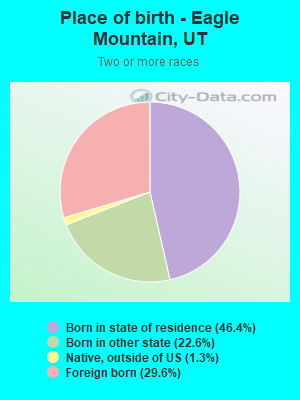
Races - Two or more races(%)
Races - Two or more races(% change since 2000)
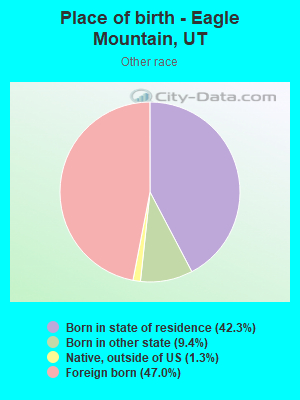
Races - Other race alone (%)
Races - Other race alone (% change since 2000)
Racial diversity
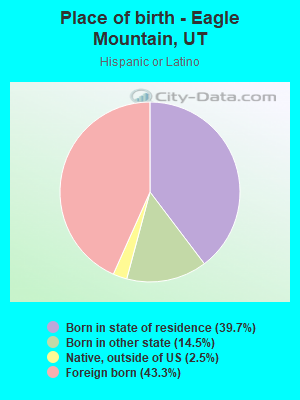
Place of birth - Born in state of residence (%)
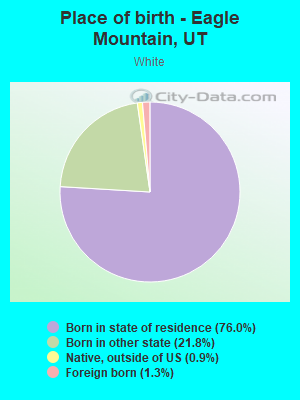
Place of birth - Born in state of residence (%) - White
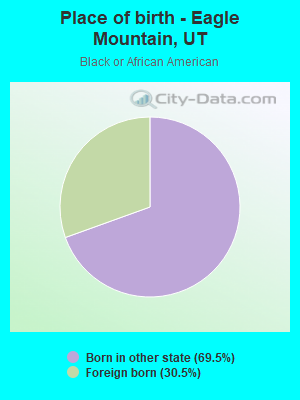
Place of birth - Born in state of residence (%) - Black or African American
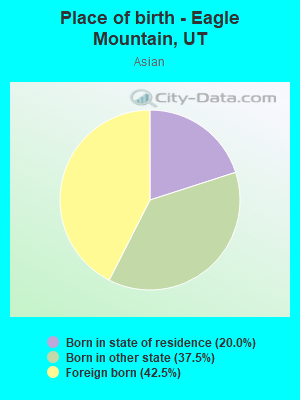
Place of birth - Born in state of residence (%) - Asian
Place of birth - Born in state of residence (%) - Hispanic or Latino
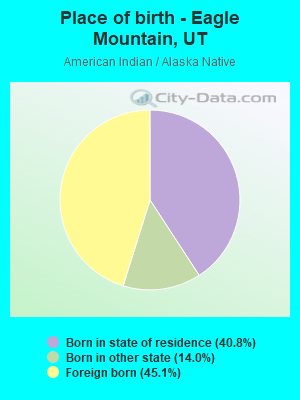
Place of birth - Born in state of residence (%) - American Indian and Alaska Native
Place of birth - Born in state of residence (%) - Multirace
Place of birth - Born in state of residence (%) - Other Race
Place of birth - Born in other state (%)
Place of birth - Born in other state (%) - White
Place of birth - Born in other state (%) - Black or African American
Place of birth - Born in other state (%) - Asian
Place of birth - Born in other state (%) - Hispanic or Latino
Place of birth - Born in other state (%) - American Indian and Alaska Native
Place of birth - Born in other state (%) - Multirace
Place of birth - Born in other state (%) - Other Race
Place of birth - Native, outside of US (%)
Place of birth - Native, outside of US (%) - White
Place of birth - Native, outside of US (%) - Black or African American
Place of birth - Native, outside of US (%) - Asian
Place of birth - Native, outside of US (%) - Hispanic or Latino
Place of birth - Native, outside of US (%) - American Indian and Alaska Native
Place of birth - Native, outside of US (%) - Multirace
Place of birth - Native, outside of US (%) - Other Race
Place of birth - Foreign born (%)
Place of birth - Foreign born (%) - White
Place of birth - Foreign born (%) - Black or African American
Place of birth - Foreign born (%) - Asian
Place of birth - Foreign born (%) - Hispanic or Latino
Place of birth - Foreign born (%) - American Indian and Alaska Native
Place of birth - Foreign born (%) - Multirace
Place of birth - Foreign born (%) - Other Race
Residents speaking English at home (%)
Residents speaking English at home - Born in the United States (%)
Residents speaking English at home - Native, born elsewhere (%)
Residents speaking English at home - Foreign born (%)
Residents speaking Spanish at home (%)
Residents speaking Spanish at home - Born in the United States (%)
Residents speaking Spanish at home - Native, born elsewhere (%)
Residents speaking Spanish at home - Foreign born (%)
Residents speaking other language at home (%)
Residents speaking other language at home - Born in the United States (%)
Residents speaking other language at home - Native, born elsewhere (%)
Residents speaking other language at home - Foreign born (%)
Marital status - Never married (%)
Marital status - Now married (%)
Marital status - Separated (%)
Marital status - Widowed (%)
Marital status - Divorced (%)
Ancestries Reported - Arab (%)
Ancestries Reported - Czech (%)
Ancestries Reported - Danish (%)
Ancestries Reported - Dutch (%)
Ancestries Reported - English (%)
Ancestries Reported - French (%)
Ancestries Reported - French Canadian (%)
Ancestries Reported - German (%)
Ancestries Reported - Greek (%)
Ancestries Reported - Hungarian (%)
Ancestries Reported - Irish (%)
Ancestries Reported - Italian (%)
Ancestries Reported - Lithuanian (%)
Ancestries Reported - Norwegian (%)
Ancestries Reported - Polish (%)
Ancestries Reported - Portuguese (%)
Ancestries Reported - Russian (%)
Ancestries Reported - Scotch-Irish (%)
Ancestries Reported - Scottish (%)
Ancestries Reported - Slovak (%)
Ancestries Reported - Subsaharan African (%)
Ancestries Reported - Swedish (%)
Ancestries Reported - Swiss (%)
Ancestries Reported - Ukrainian (%)
Ancestries Reported - United States (%)
Ancestries Reported - Welsh (%)
Ancestries Reported - West Indian (%)
Ancestries Reported - Other (%)
Geographical mobility - Same house 1 year ago (%)
Geographical mobility - Same house 1 year ago (%) - White
Geographical mobility - Same house 1 year ago (%) - Black or African American
Geographical mobility - Same house 1 year ago (%) - Asian
Geographical mobility - Same house 1 year ago (%) - Hispanic or Latino
Geographical mobility - Same house 1 year ago (%) - American Indian and Alaska Native
Geographical mobility - Same house 1 year ago (%) - Multirace
Geographical mobility - Same house 1 year ago (%) - Other Race
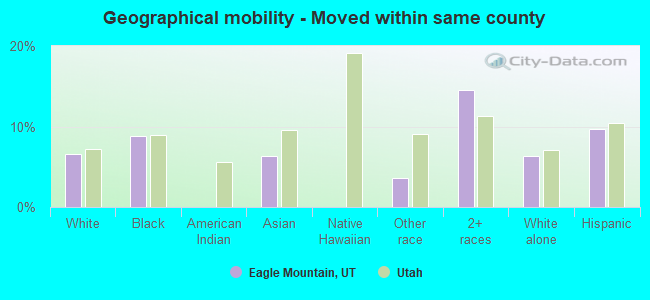
Geographical mobility - Moved within same county (%)
Geographical mobility - Moved within same county (%) - White
Geographical mobility - Moved within same county (%) - Black or African American
Geographical mobility - Moved within same county (%) - Asian
Geographical mobility - Moved within same county (%) - Hispanic or Latino
Geographical mobility - Moved within same county (%) - American Indian and Alaska Native
Geographical mobility - Moved within same county (%) - Multirace
Geographical mobility - Moved within same county (%) - Other Race
Geographical mobility - Moved from different county within same state (%)
Geographical mobility - Moved from different county within same state (%) - White
Geographical mobility - Moved from different county within same state (%) - Black or African American
Geographical mobility - Moved from different county within same state (%) - Asian
Geographical mobility - Moved from different county within same state (%) - Hispanic or Latino
Geographical mobility - Moved from different county within same state (%) - American Indian and Alaska Native
Geographical mobility - Moved from different county within same state (%) - Multirace
Geographical mobility - Moved from different county within same state (%) - Other Race
Geographical mobility - Moved from different state (%)
Geographical mobility - Moved from different state (%) - White
Geographical mobility - Moved from different state (%) - Black or African American
Geographical mobility - Moved from different state (%) - Asian
Geographical mobility - Moved from different state (%) - Hispanic or Latino
Geographical mobility - Moved from different state (%) - American Indian and Alaska Native
Geographical mobility - Moved from different state (%) - Multirace
Geographical mobility - Moved from different state (%) - Other Race
Geographical mobility - Moved from abroad (%)
Geographical mobility - Moved from abroad (%) - White
Geographical mobility - Moved from abroad (%) - Black or African American
Geographical mobility - Moved from abroad (%) - Asian
Geographical mobility - Moved from abroad (%) - Hispanic or Latino
Geographical mobility - Moved from abroad (%) - American Indian and Alaska Native
Geographical mobility - Moved from abroad (%) - Multirace
Geographical mobility - Moved from abroad (%) - Other Race
Place of birth for the foreign-born population - Ireland (%)
Place of birth for the foreign-born population - Denmark (%)
Place of birth for the foreign-born population - Norway (%)
Place of birth for the foreign-born population - Sweden (%)
Place of birth for the foreign-born population - United Kingdom (%)
Place of birth for the foreign-born population - England (%)
Place of birth for the foreign-born population - Scotland (%)
Place of birth for the foreign-born population - Other Northern Europe (%)
Place of birth for the foreign-born population - Austria (%)
Place of birth for the foreign-born population - Belgium (%)
Place of birth for the foreign-born population - France (%)
Place of birth for the foreign-born population - Germany (%)
Place of birth for the foreign-born population - Netherlands (%)
Place of birth for the foreign-born population - Switzerland (%)
Place of birth for the foreign-born population - Other Western Europe (%)
Place of birth for the foreign-born population - Greece (%)
Place of birth for the foreign-born population - Italy (%)
Place of birth for the foreign-born population - Portugal (%)
Place of birth for the foreign-born population - Spain (%)
Place of birth for the foreign-born population - Other Southern Europe (%)
Place of birth for the foreign-born population - Albania (%)
Place of birth for the foreign-born population - Belarus (%)
Place of birth for the foreign-born population - Bosnia and Herzegovina (%)
Place of birth for the foreign-born population - Bulgaria (%)
Place of birth for the foreign-born population - Croatia (%)
Place of birth for the foreign-born population - Czechoslovakia (%)
Place of birth for the foreign-born population - Hungary (%)
Place of birth for the foreign-born population - Latvia (%)
Place of birth for the foreign-born population - Lithuania (%)
Place of birth for the foreign-born population - North Macedonia (Macedonia) (%)
Place of birth for the foreign-born population - Moldova (%)
Place of birth for the foreign-born population - Poland (%)
Place of birth for the foreign-born population - Romania (%)
Place of birth for the foreign-born population - Russia (%)
Place of birth for the foreign-born population - Serbia (%)
Place of birth for the foreign-born population - Ukraine (%)
Place of birth for the foreign-born population - Other Eastern Europe (%)
Place of birth for the foreign-born population - China (%)
Place of birth for the foreign-born population - Hong Kong (%)
Place of birth for the foreign-born population - Taiwan (%)
Place of birth for the foreign-born population - Japan (%)
Place of birth for the foreign-born population - Korea (%)
Place of birth for the foreign-born population - Other Eastern Asia (%)
Place of birth for the foreign-born population - Afghanistan (%)
Place of birth for the foreign-born population - Bangladesh (%)
Place of birth for the foreign-born population - India (%)
Place of birth for the foreign-born population - Iran (%)
Place of birth for the foreign-born population - Kazakhstan (%)
Place of birth for the foreign-born population - Nepal (%)
Place of birth for the foreign-born population - Pakistan (%)
Place of birth for the foreign-born population - Sri Lanka (%)
Place of birth for the foreign-born population - Uzbekistan (%)
Place of birth for the foreign-born population - Other South Central Asia (%)
Place of birth for the foreign-born population - Burma (%)
Place of birth for the foreign-born population - Cambodia (%)
Place of birth for the foreign-born population - Indonesia (%)
Place of birth for the foreign-born population - Laos (%)
Place of birth for the foreign-born population - Malaysia (%)
Place of birth for the foreign-born population - Philippines (%)
Place of birth for the foreign-born population - Singapore (%)
Place of birth for the foreign-born population - Thailand (%)
Place of birth for the foreign-born population - Vietnam (%)
Place of birth for the foreign-born population - Other South Eastern Asia (%)
Place of birth for the foreign-born population - Armenia (%)
Place of birth for the foreign-born population - Iraq (%)
Place of birth for the foreign-born population - Israel (%)
Place of birth for the foreign-born population - Jordan (%)
Place of birth for the foreign-born population - Kuwait (%)
Place of birth for the foreign-born population - Lebanon (%)
Place of birth for the foreign-born population - Saudi Arabia (%)
Place of birth for the foreign-born population - Syria (%)
Place of birth for the foreign-born population - Turkey (%)
Place of birth for the foreign-born population - Yemen (%)
Place of birth for the foreign-born population - Other Western Asia (%)
Place of birth for the foreign-born population - Eritrea (%)
Place of birth for the foreign-born population - Ethiopia (%)
Place of birth for the foreign-born population - Kenya (%)
Place of birth for the foreign-born population - Somalia (%)
Place of birth for the foreign-born population - Uganda (%)
Place of birth for the foreign-born population - Zimbabwe (%)
Place of birth for the foreign-born population - Other Eastern Africa (%)
Place of birth for the foreign-born population - Cameroon (%)
Place of birth for the foreign-born population - Congo (%)
Place of birth for the foreign-born population - Democratic Republic of Congo (Zaire) (%)
Place of birth for the foreign-born population - Other Middle Africa (%)
Place of birth for the foreign-born population - Egypt (%)
Place of birth for the foreign-born population - Morocco (%)
Place of birth for the foreign-born population - Sudan (%)
Place of birth for the foreign-born population - Other Northern Africa (%)
Place of birth for the foreign-born population - South Africa (%)
Place of birth for the foreign-born population - Other Southern Africa (%)
Place of birth for the foreign-born population - Cabo Verde (%)
Place of birth for the foreign-born population - Ghana (%)
Place of birth for the foreign-born population - Liberia (%)
Place of birth for the foreign-born population - Nigeria (%)
Place of birth for the foreign-born population - Senegal (%)
Place of birth for the foreign-born population - Sierra Leone (%)
Place of birth for the foreign-born population - Other Western Africa (%)
Place of birth for the foreign-born population - Australia (%)
Place of birth for the foreign-born population - New Zealand (%)
Place of birth for the foreign-born population - Fiji (%)
Place of birth for the foreign-born population - Micronesia (%)
Place of birth for the foreign-born population - Bahamas (%)
Place of birth for the foreign-born population - Barbados (%)
Place of birth for the foreign-born population - Cuba (%)
Place of birth for the foreign-born population - Dominica (%)
Place of birth for the foreign-born population - Dominican Republic (%)
Place of birth for the foreign-born population - Grenada (%)
Place of birth for the foreign-born population - Haiti (%)
Place of birth for the foreign-born population - Jamaica (%)
Place of birth for the foreign-born population - St. Vincent and the Grenadines (%)
Place of birth for the foreign-born population - Trinidad and Tobago (%)
Place of birth for the foreign-born population - West Indies (%)
Place of birth for the foreign-born population - Other Caribbean (%)
Place of birth for the foreign-born population - Belize (%)
Place of birth for the foreign-born population - Costa Rica (%)
Place of birth for the foreign-born population - El Salvador (%)
Place of birth for the foreign-born population - Guatemala (%)
Place of birth for the foreign-born population - Honduras (%)
Place of birth for the foreign-born population - Mexico (%)
Place of birth for the foreign-born population - Nicaragua (%)
Place of birth for the foreign-born population - Panama (%)
Place of birth for the foreign-born population - Other Central America (%)
Place of birth for the foreign-born population - Argentina (%)
Place of birth for the foreign-born population - Bolivia (%)
Place of birth for the foreign-born population - Brazil (%)
Place of birth for the foreign-born population - Chile (%)
Place of birth for the foreign-born population - Colombia (%)
Place of birth for the foreign-born population - Ecuador (%)
Place of birth for the foreign-born population - Guyana (%)
Place of birth for the foreign-born population - Peru (%)
Place of birth for the foreign-born population - Uruguay (%)
Place of birth for the foreign-born population - Venezuela (%)
Place of birth for the foreign-born population - Other South America (%)
Place of birth for the foreign-born population - Canada (%)
Place of birth for the foreign-born population - Other Northern America (%)
Place of birth for the foreign-born population - Other (%)
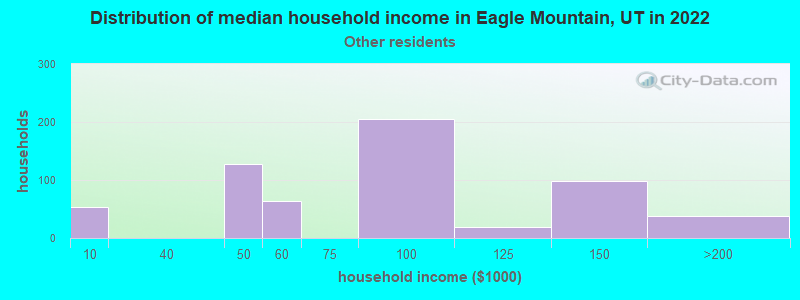
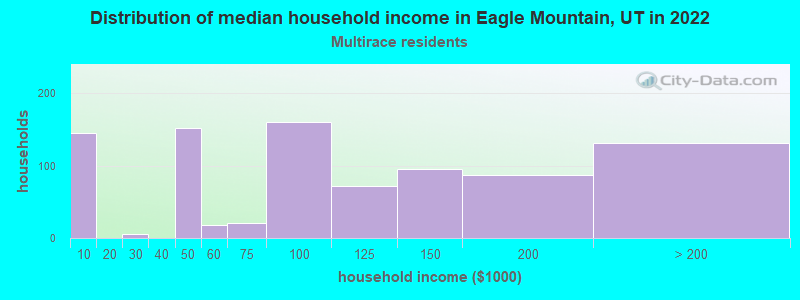
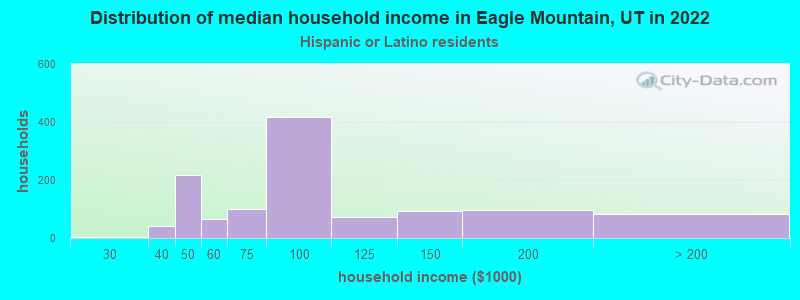
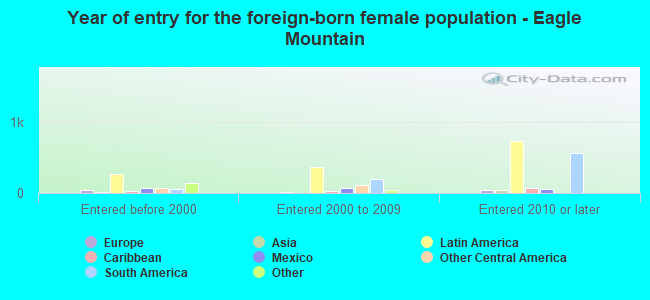
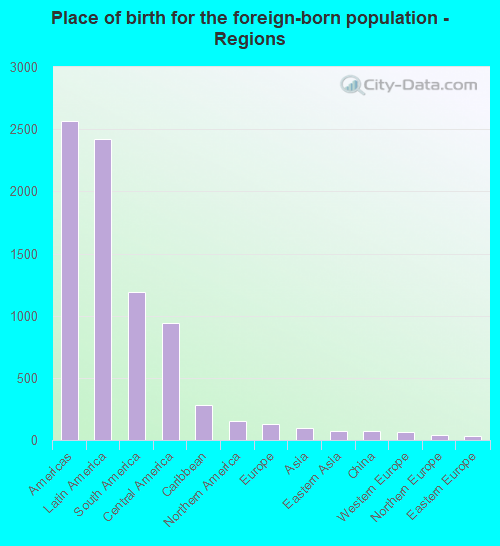
According to 2022 data, the most numerous races in Eagle Mountain, UT are White alone (40,158 residents), Hispanic (5,771 residents), and Two or more races (1,497 residents). 88.9% of Eagle Mountain residents speak English at home. 5.7% of Eagle Mountain, UT residents are foreign-born (4.9% born in Latin America), which is 39.1% less than the foreign-born rate of 8.0% across the entire state of Utah.
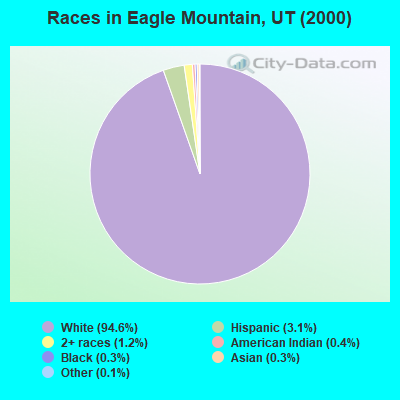
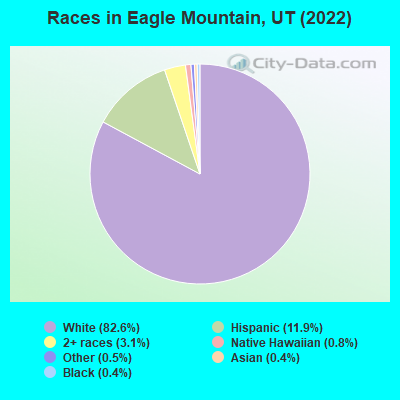
Race distribution in Eagle Mountain
2000 2022
1,904,265 85.3% White alone 201,559 9.0% Hispanic 36,483 1.6% Asian alone 31,308 1.4% Two or more races 26,663 1.2% American Indian alone 14,806 0.7% Native Hawaiian and Other 16,137 0.7% Black alone 1,948 0.09% Other race alone
2,557,466 75.6% White alone 512,086 15.1% Hispanic 119,308 3.5% Two or more races 82,388 2.4% Asian alone 36,978 1.1% Native Hawaiian and Other 34,873 1.0% Black alone 22,803 0.7% American Indian alone 14,898 0.4% Other race alone
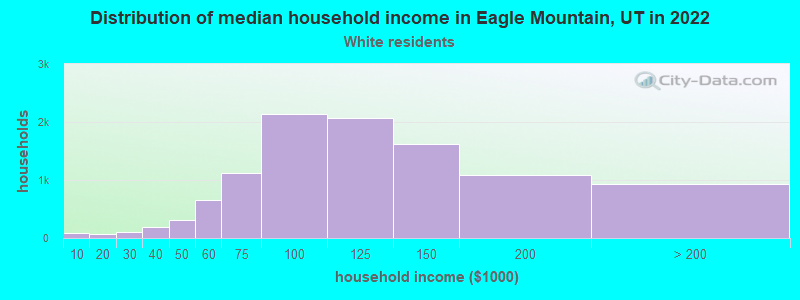
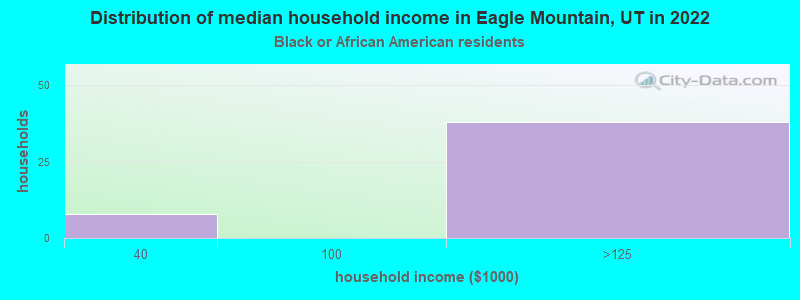
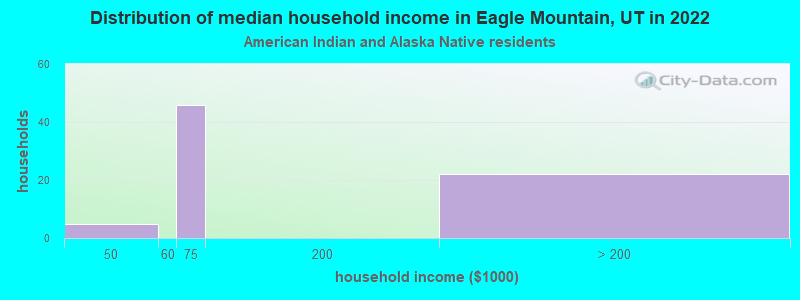
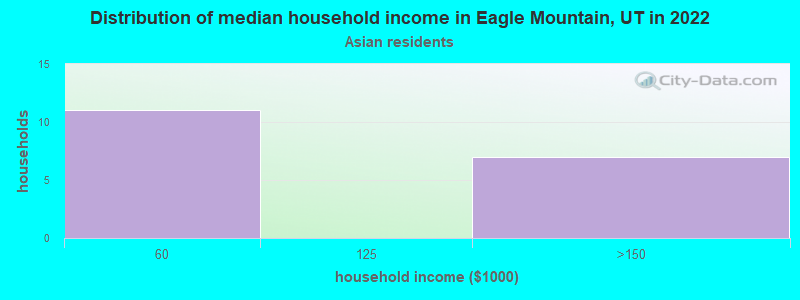
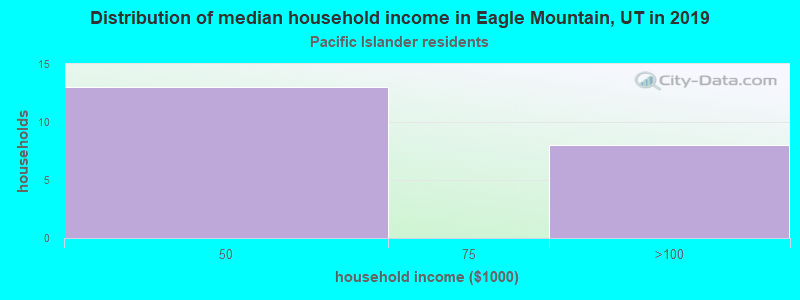
Income and house value in Eagle Mountain Median household income in 2022 $108,472 White non-Hispanic householders$168,091 American Indian and Alaska Native householders$105,058 Native Hawaiian and other Pacific Islander householders$95,005 Some other race householders$88,897 Two or more races householders$81,771 Hispanic or Latino race householdersMedian 2022 house value $516,847 White Non-Hispanic householders$541,443 American Indian or Alaska Native householders$562,920 Some other race householders$562,920 Two or more races householders$541,443 Hispanic or Latino householders
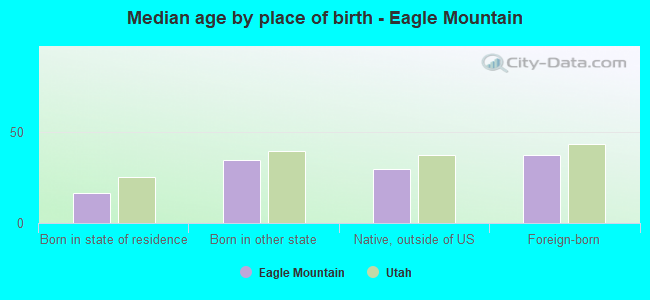
Median age by race in Eagle Mountain
22.1 Median age for White residents22.3 22.1 43.2 Median age for Black or African American residents39.9 -640,650,405.9 23.9 Median age for American Indian / Alaska Native residents24.9 24.8 32.9 Median age for Asian residents26.7 33.3 6.5 Median age for Native Hawaiian / Pacific Islander residents34.4 3.2 25.3 Median age for Other race residents35.6 22.8 18.4 Median age for Two or more races residents17.2 19.6 22.0 Median age for White alone residents22.1 21.9 23.8 Median age for Hispanic or Latino residents29.2 22.4
Owner/renter occupied households by race in Eagle Mountain
House owners and renters - White residents 9,238 89.9% Owner occupied1,036 10.1% Renter occupiedHouse owners and renters - Black or African American residents 57 100.0% Owner occupiedHouse owners and renters - American Indian / Alaska Native residents 39 68.9% Owner occupied18 31.1% Renter occupiedHouse owners and renters - Asian residents 27 100.0% Owner occupiedHouse owners and renters - Native Hawaiian / Pacific Islander residents 180 100.0% Owner occupiedHouse owners and renters - Other race residents 292 50.3% Owner occupied289 49.7% Renter occupiedHouse owners and renters - Two or more races residents 709 84.4% Owner occupied131 15.6% Renter occupiedHouse owners and renters - White alone residents 8,990 89.7% Owner occupied1,027 10.3% Renter occupiedHouse owners and renters - Hispanic or Latino residents 903 77.7% Owner occupied259 22.3% Renter occupied
Language usage in Eagle Mountain
English speakers - Total 88.9% of residents of Eagle Mountain speak English at home.
9.5% of residents speak Spanish at home 2,264 57.6% Speak English very well1,669 42.4% Speak English less than very well1.6% of residents speak other language at home 583 90.7% Speak English very well60 9.3% Speak English less than very well
English speakers - Born in the United States 94.3% of residents of Eagle Mountain speak English at home.
3.9% of residents speak Spanish at home 316 81.2% Speak English very well73 18.8% Speak English less than very well1.6% of residents speak other language at home 152 92.7% Speak English very well12 7.3% Speak English less than very well
English speakers - Native, born elsewhere 79.3% of residents of Eagle Mountain speak English at home.
16.9% of residents speak Spanish at home 79 100.0% Speak English very well3.4% of residents speak other language at home 16 100.0% Speak English very well
English speakers - Foreign-born 15.0% of residents of Eagle Mountain speak English at home.
77.0% of residents speak Spanish at home 947 41.3% Speak English very well1,348 58.7% Speak English less than very well6.8% of residents speak other language at home 202 100.0% Speak English very well
White (Caucasian) - Speak only English Native:
98.0% (34,273)Foreign-born:
47.1% (257)
White (Caucasian) - Speak another language Native:
2.7% (944)Foreign-born:
57.4% (313)
Black or African American - Speak only English Native:
100.0% (112)Foreign-born:
65.4% (38)
American Indian / Alaska Native - Speak another language Native:
65.2% (104)Foreign-born:
96.1% (203)
Asian - Speak only English Native:
89.3% (99)Foreign-born:
26.4% (23)
Other race - Speak only English Native:
29.9% (267)Foreign-born:
1.3% (16)
Other race - Speak another language Native:
69.7% (624)Foreign-born:
100.0% (1,209)
Two or more races - Speak only English Native:
74.8% (1,324)Foreign-born:
4.2% (43)
Two or more races - Speak another language Native:
23.9% (424)Foreign-born:
96.0% (983)
White alone - Speak only English Native:
98.0% (33,568)Foreign-born:
72.8% (182)
White alone - Speak another language Native:
2.1% (723)Foreign-born:
30.2% (76)
Hispanic or Latino - Speak only English Native:
56.6% (1,348)Foreign-born:
4.0% (98)
Hispanic or Latino - Speak another language Native:
43.4% (1,034)Foreign-born:
95.7% (2,382)
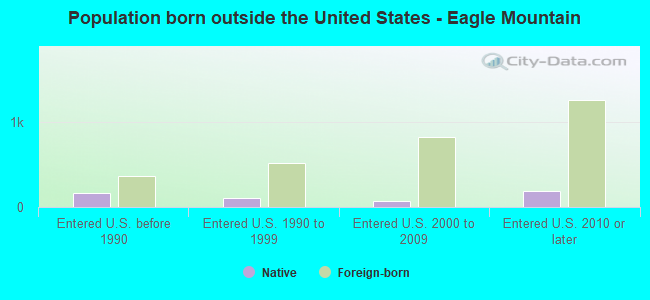
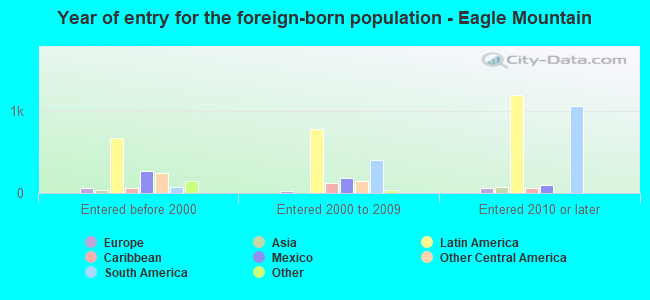
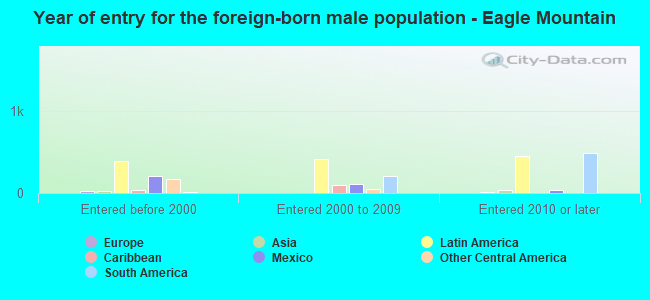
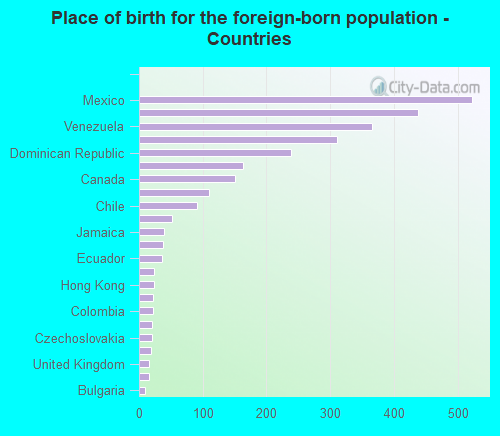
Foreign-born residents in Eagle Mountain 2,796 residents are foreign born (4.9% Latin America ).
Marital status for residents in Eagle Mountain Marital status - White (Caucasian) population 15 years and over
Males 24.6% Never married70.5% Now married0.2% Separated0.2% Widowed4.5% DivorcedFemales 23.7% Never married69.7% Now married0.6% Separated1.1% Widowed4.9% DivorcedWomen who gave birth in the past 12 months Now married:
98.5% (1,435)Unmarried:
1.5% (21)
Women who did not give birth in the past 12 months Now married:
65.1% (6,177)Unmarried:
34.9% (3,314)
Marital status - American Indian / Alaska Native population 15 years and over
Males 38.4% Never married39.2% Now married0.0% Separated22.4% Widowed0.0% DivorcedFemales 66.9% Never married33.1% Now married0.0% Separated0.0% Widowed0.0% DivorcedWomen who did not give birth in the past 12 months Now married:
33.1% (59)Unmarried:
66.9% (120)
Marital status - Asian population 15 years and over
Males 0.0% Never married100.0% Now married0.0% Separated0.0% Widowed0.0% DivorcedFemales 9.8% Never married61.6% Now married0.0% Separated0.0% Widowed28.6% DivorcedWomen who gave birth in the past 12 months Now married:
100.0% (19)Unmarried:
0.0% (0)
Women who did not give birth in the past 12 months Now married:
82.8% (62)Unmarried:
17.2% (13)
Marital status - Native Hawaiian / Pacific Islander population 15 years and over
Males 21.2% Never married78.8% Now married0.0% Separated0.0% Widowed0.0% DivorcedFemales 21.6% Never married78.4% Now married0.0% Separated0.0% Widowed0.0% DivorcedWomen who gave birth in the past 12 months Now married:
100.0% (25)Unmarried:
0.0% (0)
Women who did not give birth in the past 12 months Now married:
63.6% (23)Unmarried:
36.4% (13)
Marital status - Other race population 15 years and over
Males 6.0% Never married66.7% Now married0.0% Separated0.0% Widowed27.3% DivorcedFemales 53.1% Never married46.9% Now married0.0% Separated0.0% Widowed0.0% DivorcedWomen who gave birth in the past 12 months Now married:
21.3% (26)Unmarried:
78.7% (96)
Women who did not give birth in the past 12 months Now married:
51.3% (299)Unmarried:
48.7% (284)
Marital status - Two or more races population 15 years and over
Males 24.3% Never married62.5% Now married4.2% Separated0.0% Widowed9.0% DivorcedFemales 25.6% Never married67.6% Now married0.0% Separated0.0% Widowed6.8% DivorcedWomen who gave birth in the past 12 months Now married:
100.0% (106)Unmarried:
0.0% (0)
Women who did not give birth in the past 12 months Now married:
61.0% (480)Unmarried:
39.0% (307)
Marital status - White alone, not Hispanic / Latino population 15 years and over
Males 24.0% Never married70.9% Now married0.2% Separated0.2% Widowed4.7% DivorcedFemales 23.0% Never married70.3% Now married0.4% Separated1.1% Widowed5.2% DivorcedWomen who gave birth in the past 12 months Now married:
98.5% (1,450)Unmarried:
1.5% (22)
Women who did not give birth in the past 12 months Now married:
65.1% (6,032)Unmarried:
34.9% (3,230)
Marital status - Hispanic or Latino population 15 years and over
Males 24.4% Never married64.4% Now married0.4% Separated1.6% Widowed9.1% DivorcedFemales 42.8% Never married54.4% Now married1.9% Separated0.5% Widowed0.4% DivorcedWomen who gave birth in the past 12 months Now married:
50.8% (68)Unmarried:
49.2% (65)
Women who did not give birth in the past 12 months Now married:
55.8% (777)Unmarried:
44.2% (616)
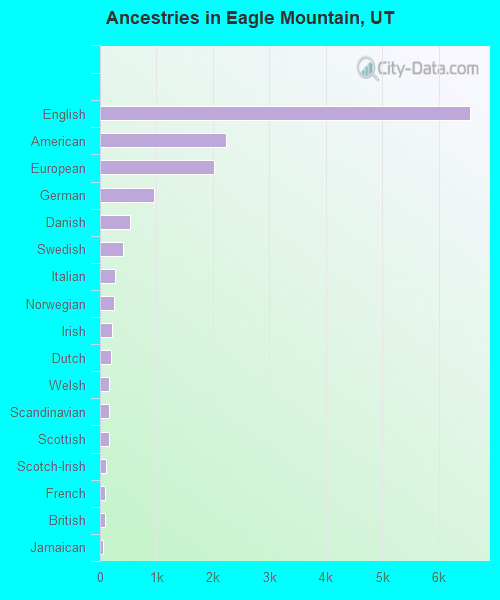
Ancestries in Eagle Mountain
6,563 32.6% English2,229 11.1% American2,024 10.0% European965 4.8% German533 2.6% Danish416 2.1% Swedish260 1.3% Italian245 1.2% Norwegian214 1.1% Irish194 1.0% Dutch168 0.8% Welsh164 0.8% Scandinavian164 0.8% Scottish100 0.5% Scotch-Irish92 0.5% French81 0.4% British60 0.3% Jamaican55 0.3% Northern European48 0.2% Swiss34 0.2% Polish26 0.1% French Canadian23 0.1% Slovak22 0.1% Israeli21 0.1% Moroccan19 0.09% Armenian19 0.09% Portuguese16 0.08% Finnish10 0.05% Czechoslovakian10 0.05% Greek8 0.04% Canadian2 0.01% Czech
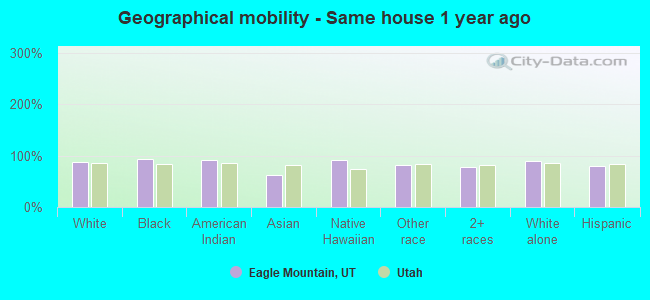
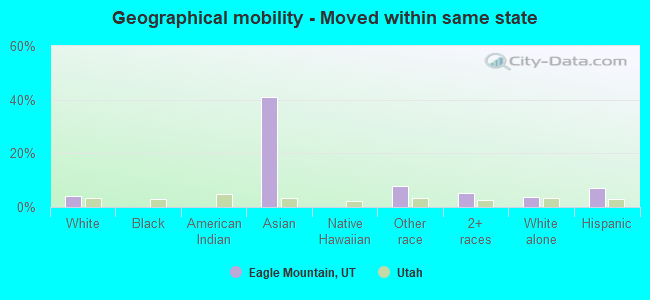
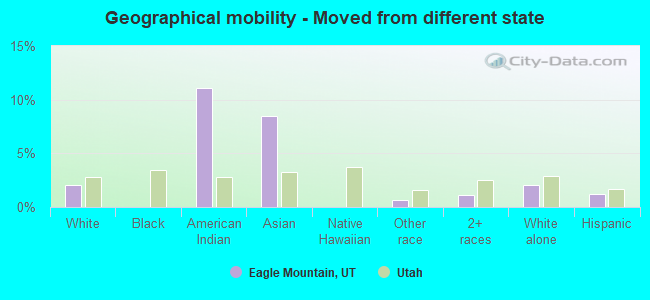
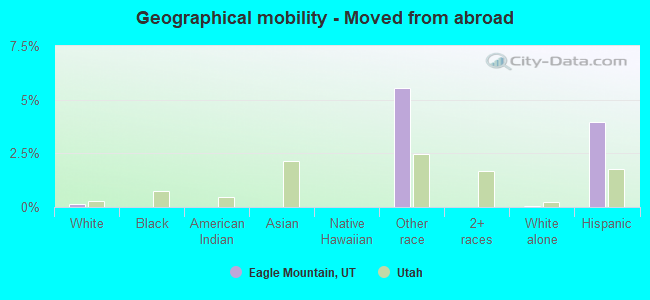
Geographical mobility in Eagle Mountain Same house 1 year ago 35,386 88.3% White (Caucasian)147 93.5% Black or African American329 91.7% American Indian / Alaska Native125 62.5% Asian278 92.6% Native Hawaiian / Pacific Islander1,994 82.4% Other race2,572 78.2% Two or more races34,655 88.7% White alone, not Hispanic / Latino4,426 79.8% Hispanic or LatinoMoved within same county 2,629 6.6% White / Caucasian14 8.9% Black or African American13 6.3% Asian87 3.6% Other race477 14.5% Two or more races2,497 6.4% White alone, not Hispanic / Latino535 9.6% Hispanic or LatinoMoved within same state 1,601 4.0% White / Caucasian82 41.0% Asian191 7.9% Other race178 5.4% Two or more races1,528 3.9% White alone, not Hispanic / Latino389 7.0% Hispanic or LatinoMoved from different state 821 2.0% White / Caucasian40 11.1% American Indian / Alaska Native17 8.5% Asian16 0.7% Other race35 1.1% Two or more races805 2.1% White alone, not Hispanic / Latino67 1.2% Hispanic or LatinoMoved from abroad 56 0.1% White134 5.5% Other race11 0.0% White alone, not Hispanic / Latino219 4.0% Hispanic or Latino
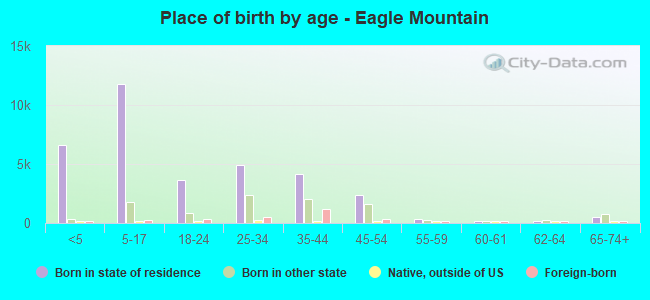
Children Nativity (place of birth) in Eagle Mountain
Children under 6 years - Living with two parents Both parents native 6,726 99.9% Native8 0.1% Foreign-bornBoth parents foreign-born 207 95.6% Native9 4.4% Foreign-bornOne native, one foreign-born parent 588 100.0% NativeChildren under 6 years - Living with one parent Native parent 358 100.0% NativeForeign-born parent 231 100.0% NativeChildren 6 to 17 years - Living with two parents Both parents native 10,455 99.8% Native16 0.2% Foreign-bornBoth parents foreign-born 377 72.5% Native143 27.5% Foreign-bornOne native, one foreign-born parent 484 93.4% Native34 6.6% Foreign-bornChildren 6 to 17 years - Living with one parent Native parent 756 100.0% NativeForeign-born parent 134 49.5% Native137 50.5% Foreign-born
Grandparents responsible for own grandchildren in Eagle Mountain
Grandparents (30 to 59 years) White / Caucasian 92 19.8% Responsible for grandchildren371 80.2% Not responsible for grandchildrenOther race 14 100.0% Not responsible for grandchildrenTwo or more races 8 100.0% Not responsible for grandchildrenWhite alone, not Hispanic / Latino 99 24.1% Responsible for grandchildren311 75.9% Not responsible for grandchildrenHispanic or Latino 96 100.0% Not responsible for grandchildrenGrandparents (60 years and over) White / Caucasian 86 42.3% Responsible for grandchildren118 57.7% Not responsible for grandchildrenWhite alone, not Hispanic / Latino 89 48.0% Responsible for grandchildren96 52.0% Not responsible for grandchildrenHispanic or Latino 36 100.0% Not responsible for grandchildren