Races in East Northport, New York (NY) Detailed Stats
Data:
Races - White alone (%)
Races - White alone (% change since 2000)
Races - Black alone (%)
Races - Black alone (% change since 2000)
Races - American Indian alone (%)
Races - American Indian alone (% change since 2000)
Races - Asian alone (%)
Races - Asian alone (% change since 2000)
Races - Hispanic (%)
Races - Hispanic (% change since 2000)
Races - Native Hawaiian and Other Pacific Islander alone (%)
Races - Native Hawaiian and Other Pacific Islander alone (% change since 2000)
Races - Two or more races(%)
Races - Two or more races(% change since 2000)
Races - Other race alone (%)
Races - Other race alone (% change since 2000)
Racial diversity
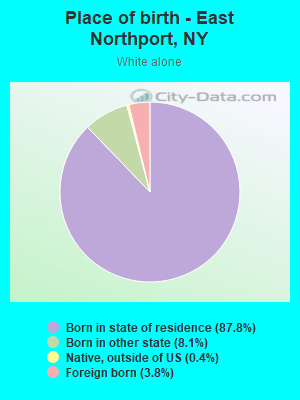
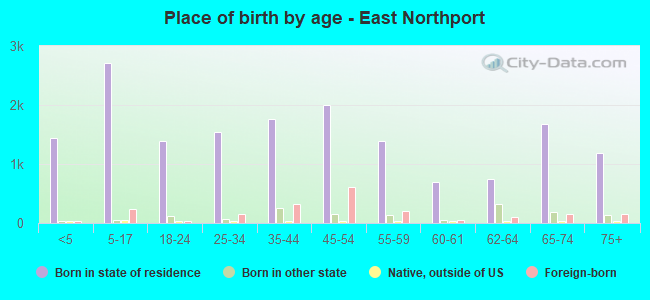
Place of birth - Born in state of residence (%)
Place of birth - Born in state of residence (%) - White
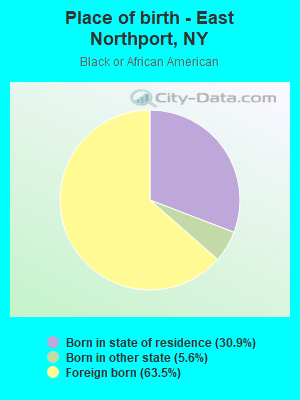
Place of birth - Born in state of residence (%) - Black or African American
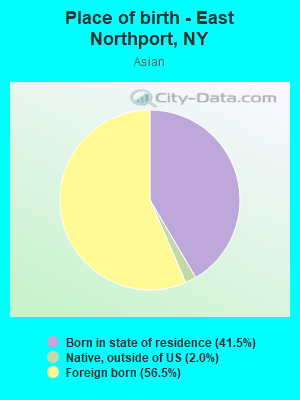
Place of birth - Born in state of residence (%) - Asian
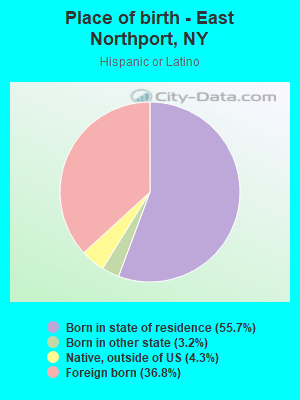
Place of birth - Born in state of residence (%) - Hispanic or Latino
Place of birth - Born in state of residence (%) - American Indian and Alaska Native
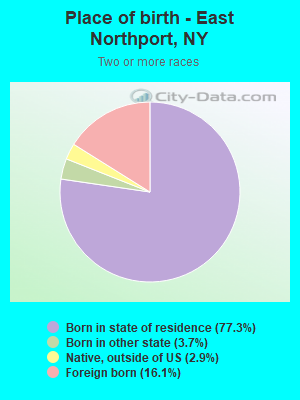
Place of birth - Born in state of residence (%) - Multirace
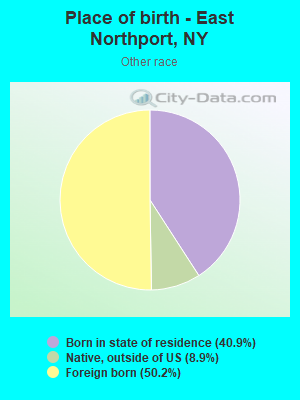
Place of birth - Born in state of residence (%) - Other Race
Place of birth - Born in other state (%)
Place of birth - Born in other state (%) - White
Place of birth - Born in other state (%) - Black or African American
Place of birth - Born in other state (%) - Asian
Place of birth - Born in other state (%) - Hispanic or Latino
Place of birth - Born in other state (%) - American Indian and Alaska Native
Place of birth - Born in other state (%) - Multirace
Place of birth - Born in other state (%) - Other Race
Place of birth - Native, outside of US (%)
Place of birth - Native, outside of US (%) - White
Place of birth - Native, outside of US (%) - Black or African American
Place of birth - Native, outside of US (%) - Asian
Place of birth - Native, outside of US (%) - Hispanic or Latino
Place of birth - Native, outside of US (%) - American Indian and Alaska Native
Place of birth - Native, outside of US (%) - Multirace
Place of birth - Native, outside of US (%) - Other Race
Place of birth - Foreign born (%)
Place of birth - Foreign born (%) - White
Place of birth - Foreign born (%) - Black or African American
Place of birth - Foreign born (%) - Asian
Place of birth - Foreign born (%) - Hispanic or Latino
Place of birth - Foreign born (%) - American Indian and Alaska Native
Place of birth - Foreign born (%) - Multirace
Place of birth - Foreign born (%) - Other Race
Residents speaking English at home (%)
Residents speaking English at home - Born in the United States (%)
Residents speaking English at home - Native, born elsewhere (%)
Residents speaking English at home - Foreign born (%)
Residents speaking Spanish at home (%)
Residents speaking Spanish at home - Born in the United States (%)
Residents speaking Spanish at home - Native, born elsewhere (%)
Residents speaking Spanish at home - Foreign born (%)
Residents speaking other language at home (%)
Residents speaking other language at home - Born in the United States (%)
Residents speaking other language at home - Native, born elsewhere (%)
Residents speaking other language at home - Foreign born (%)
Marital status - Never married (%)
Marital status - Now married (%)
Marital status - Separated (%)
Marital status - Widowed (%)
Marital status - Divorced (%)
Ancestries Reported - Arab (%)
Ancestries Reported - Czech (%)
Ancestries Reported - Danish (%)
Ancestries Reported - Dutch (%)
Ancestries Reported - English (%)
Ancestries Reported - French (%)
Ancestries Reported - French Canadian (%)
Ancestries Reported - German (%)
Ancestries Reported - Greek (%)
Ancestries Reported - Hungarian (%)
Ancestries Reported - Irish (%)
Ancestries Reported - Italian (%)
Ancestries Reported - Lithuanian (%)
Ancestries Reported - Norwegian (%)
Ancestries Reported - Polish (%)
Ancestries Reported - Portuguese (%)
Ancestries Reported - Russian (%)
Ancestries Reported - Scotch-Irish (%)
Ancestries Reported - Scottish (%)
Ancestries Reported - Slovak (%)
Ancestries Reported - Subsaharan African (%)
Ancestries Reported - Swedish (%)
Ancestries Reported - Swiss (%)
Ancestries Reported - Ukrainian (%)
Ancestries Reported - United States (%)
Ancestries Reported - Welsh (%)
Ancestries Reported - West Indian (%)
Ancestries Reported - Other (%)
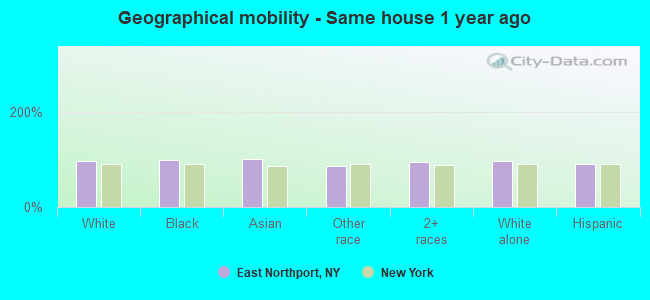
Geographical mobility - Same house 1 year ago (%)
Geographical mobility - Same house 1 year ago (%) - White
Geographical mobility - Same house 1 year ago (%) - Black or African American
Geographical mobility - Same house 1 year ago (%) - Asian
Geographical mobility - Same house 1 year ago (%) - Hispanic or Latino
Geographical mobility - Same house 1 year ago (%) - American Indian and Alaska Native
Geographical mobility - Same house 1 year ago (%) - Multirace
Geographical mobility - Same house 1 year ago (%) - Other Race
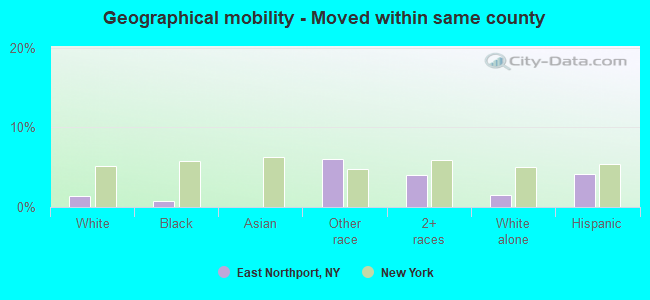
Geographical mobility - Moved within same county (%)
Geographical mobility - Moved within same county (%) - White
Geographical mobility - Moved within same county (%) - Black or African American
Geographical mobility - Moved within same county (%) - Asian
Geographical mobility - Moved within same county (%) - Hispanic or Latino
Geographical mobility - Moved within same county (%) - American Indian and Alaska Native
Geographical mobility - Moved within same county (%) - Multirace
Geographical mobility - Moved within same county (%) - Other Race
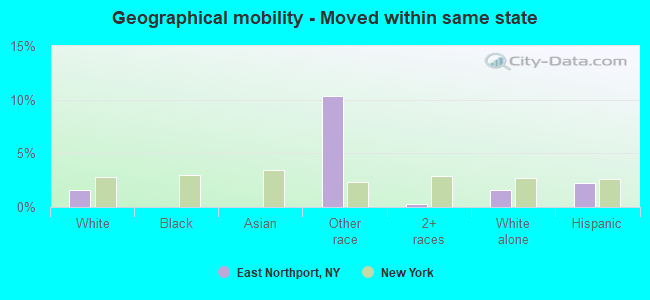
Geographical mobility - Moved from different county within same state (%)
Geographical mobility - Moved from different county within same state (%) - White
Geographical mobility - Moved from different county within same state (%) - Black or African American
Geographical mobility - Moved from different county within same state (%) - Asian
Geographical mobility - Moved from different county within same state (%) - Hispanic or Latino
Geographical mobility - Moved from different county within same state (%) - American Indian and Alaska Native
Geographical mobility - Moved from different county within same state (%) - Multirace
Geographical mobility - Moved from different county within same state (%) - Other Race
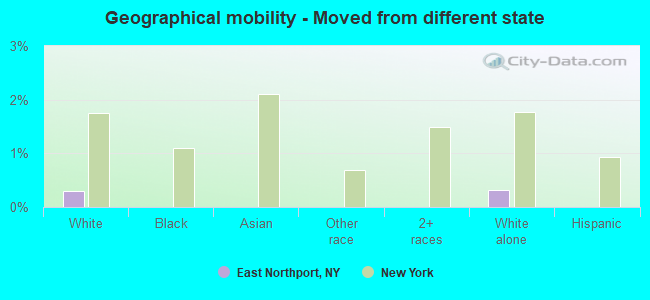
Geographical mobility - Moved from different state (%)
Geographical mobility - Moved from different state (%) - White
Geographical mobility - Moved from different state (%) - Black or African American
Geographical mobility - Moved from different state (%) - Asian
Geographical mobility - Moved from different state (%) - Hispanic or Latino
Geographical mobility - Moved from different state (%) - American Indian and Alaska Native
Geographical mobility - Moved from different state (%) - Multirace
Geographical mobility - Moved from different state (%) - Other Race
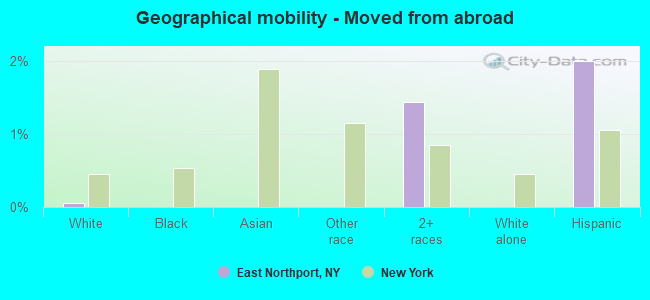
Geographical mobility - Moved from abroad (%)
Geographical mobility - Moved from abroad (%) - White
Geographical mobility - Moved from abroad (%) - Black or African American
Geographical mobility - Moved from abroad (%) - Asian
Geographical mobility - Moved from abroad (%) - Hispanic or Latino
Geographical mobility - Moved from abroad (%) - American Indian and Alaska Native
Geographical mobility - Moved from abroad (%) - Multirace
Geographical mobility - Moved from abroad (%) - Other Race
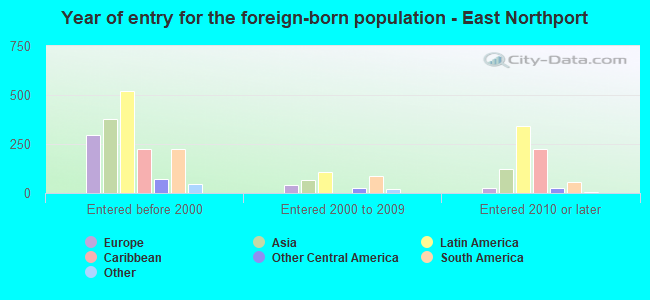
Place of birth for the foreign-born population - Ireland (%)
Place of birth for the foreign-born population - Denmark (%)
Place of birth for the foreign-born population - Norway (%)
Place of birth for the foreign-born population - Sweden (%)
Place of birth for the foreign-born population - United Kingdom (%)
Place of birth for the foreign-born population - England (%)
Place of birth for the foreign-born population - Scotland (%)
Place of birth for the foreign-born population - Other Northern Europe (%)
Place of birth for the foreign-born population - Austria (%)
Place of birth for the foreign-born population - Belgium (%)
Place of birth for the foreign-born population - France (%)
Place of birth for the foreign-born population - Germany (%)
Place of birth for the foreign-born population - Netherlands (%)
Place of birth for the foreign-born population - Switzerland (%)
Place of birth for the foreign-born population - Other Western Europe (%)
Place of birth for the foreign-born population - Greece (%)
Place of birth for the foreign-born population - Italy (%)
Place of birth for the foreign-born population - Portugal (%)
Place of birth for the foreign-born population - Spain (%)
Place of birth for the foreign-born population - Other Southern Europe (%)
Place of birth for the foreign-born population - Albania (%)
Place of birth for the foreign-born population - Belarus (%)
Place of birth for the foreign-born population - Bosnia and Herzegovina (%)
Place of birth for the foreign-born population - Bulgaria (%)
Place of birth for the foreign-born population - Croatia (%)
Place of birth for the foreign-born population - Czechoslovakia (%)
Place of birth for the foreign-born population - Hungary (%)
Place of birth for the foreign-born population - Latvia (%)
Place of birth for the foreign-born population - Lithuania (%)
Place of birth for the foreign-born population - North Macedonia (Macedonia) (%)
Place of birth for the foreign-born population - Moldova (%)
Place of birth for the foreign-born population - Poland (%)
Place of birth for the foreign-born population - Romania (%)
Place of birth for the foreign-born population - Russia (%)
Place of birth for the foreign-born population - Serbia (%)
Place of birth for the foreign-born population - Ukraine (%)
Place of birth for the foreign-born population - Other Eastern Europe (%)
Place of birth for the foreign-born population - China (%)
Place of birth for the foreign-born population - Hong Kong (%)
Place of birth for the foreign-born population - Taiwan (%)
Place of birth for the foreign-born population - Japan (%)
Place of birth for the foreign-born population - Korea (%)
Place of birth for the foreign-born population - Other Eastern Asia (%)
Place of birth for the foreign-born population - Afghanistan (%)
Place of birth for the foreign-born population - Bangladesh (%)
Place of birth for the foreign-born population - India (%)
Place of birth for the foreign-born population - Iran (%)
Place of birth for the foreign-born population - Kazakhstan (%)
Place of birth for the foreign-born population - Nepal (%)
Place of birth for the foreign-born population - Pakistan (%)
Place of birth for the foreign-born population - Sri Lanka (%)
Place of birth for the foreign-born population - Uzbekistan (%)
Place of birth for the foreign-born population - Other South Central Asia (%)
Place of birth for the foreign-born population - Burma (%)
Place of birth for the foreign-born population - Cambodia (%)
Place of birth for the foreign-born population - Indonesia (%)
Place of birth for the foreign-born population - Laos (%)
Place of birth for the foreign-born population - Malaysia (%)
Place of birth for the foreign-born population - Philippines (%)
Place of birth for the foreign-born population - Singapore (%)
Place of birth for the foreign-born population - Thailand (%)
Place of birth for the foreign-born population - Vietnam (%)
Place of birth for the foreign-born population - Other South Eastern Asia (%)
Place of birth for the foreign-born population - Armenia (%)
Place of birth for the foreign-born population - Iraq (%)
Place of birth for the foreign-born population - Israel (%)
Place of birth for the foreign-born population - Jordan (%)
Place of birth for the foreign-born population - Kuwait (%)
Place of birth for the foreign-born population - Lebanon (%)
Place of birth for the foreign-born population - Saudi Arabia (%)
Place of birth for the foreign-born population - Syria (%)
Place of birth for the foreign-born population - Turkey (%)
Place of birth for the foreign-born population - Yemen (%)
Place of birth for the foreign-born population - Other Western Asia (%)
Place of birth for the foreign-born population - Eritrea (%)
Place of birth for the foreign-born population - Ethiopia (%)
Place of birth for the foreign-born population - Kenya (%)
Place of birth for the foreign-born population - Somalia (%)
Place of birth for the foreign-born population - Uganda (%)
Place of birth for the foreign-born population - Zimbabwe (%)
Place of birth for the foreign-born population - Other Eastern Africa (%)
Place of birth for the foreign-born population - Cameroon (%)
Place of birth for the foreign-born population - Congo (%)
Place of birth for the foreign-born population - Democratic Republic of Congo (Zaire) (%)
Place of birth for the foreign-born population - Other Middle Africa (%)
Place of birth for the foreign-born population - Egypt (%)
Place of birth for the foreign-born population - Morocco (%)
Place of birth for the foreign-born population - Sudan (%)
Place of birth for the foreign-born population - Other Northern Africa (%)
Place of birth for the foreign-born population - South Africa (%)
Place of birth for the foreign-born population - Other Southern Africa (%)
Place of birth for the foreign-born population - Cabo Verde (%)
Place of birth for the foreign-born population - Ghana (%)
Place of birth for the foreign-born population - Liberia (%)
Place of birth for the foreign-born population - Nigeria (%)
Place of birth for the foreign-born population - Senegal (%)
Place of birth for the foreign-born population - Sierra Leone (%)
Place of birth for the foreign-born population - Other Western Africa (%)
Place of birth for the foreign-born population - Australia (%)
Place of birth for the foreign-born population - New Zealand (%)
Place of birth for the foreign-born population - Fiji (%)
Place of birth for the foreign-born population - Micronesia (%)
Place of birth for the foreign-born population - Bahamas (%)
Place of birth for the foreign-born population - Barbados (%)
Place of birth for the foreign-born population - Cuba (%)
Place of birth for the foreign-born population - Dominica (%)
Place of birth for the foreign-born population - Dominican Republic (%)
Place of birth for the foreign-born population - Grenada (%)
Place of birth for the foreign-born population - Haiti (%)
Place of birth for the foreign-born population - Jamaica (%)
Place of birth for the foreign-born population - St. Vincent and the Grenadines (%)
Place of birth for the foreign-born population - Trinidad and Tobago (%)
Place of birth for the foreign-born population - West Indies (%)
Place of birth for the foreign-born population - Other Caribbean (%)
Place of birth for the foreign-born population - Belize (%)
Place of birth for the foreign-born population - Costa Rica (%)
Place of birth for the foreign-born population - El Salvador (%)
Place of birth for the foreign-born population - Guatemala (%)
Place of birth for the foreign-born population - Honduras (%)
Place of birth for the foreign-born population - Mexico (%)
Place of birth for the foreign-born population - Nicaragua (%)
Place of birth for the foreign-born population - Panama (%)
Place of birth for the foreign-born population - Other Central America (%)
Place of birth for the foreign-born population - Argentina (%)
Place of birth for the foreign-born population - Bolivia (%)
Place of birth for the foreign-born population - Brazil (%)
Place of birth for the foreign-born population - Chile (%)
Place of birth for the foreign-born population - Colombia (%)
Place of birth for the foreign-born population - Ecuador (%)
Place of birth for the foreign-born population - Guyana (%)
Place of birth for the foreign-born population - Peru (%)
Place of birth for the foreign-born population - Uruguay (%)
Place of birth for the foreign-born population - Venezuela (%)
Place of birth for the foreign-born population - Other South America (%)
Place of birth for the foreign-born population - Canada (%)
Place of birth for the foreign-born population - Other Northern America (%)
Place of birth for the foreign-born population - Other (%)
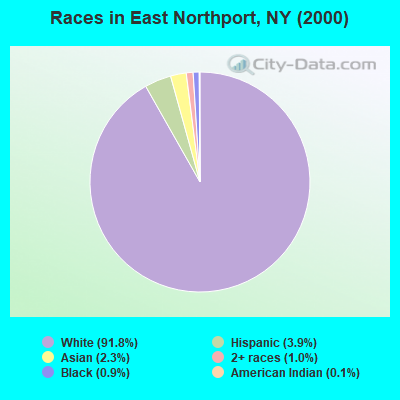
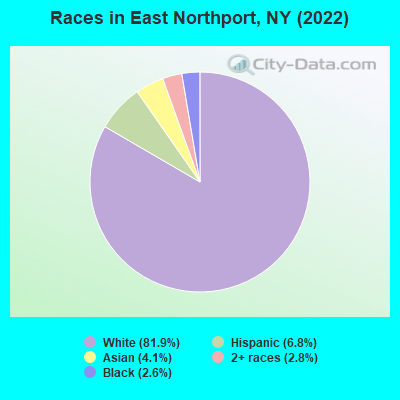
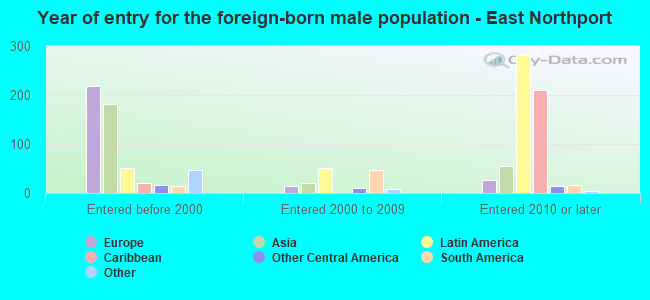
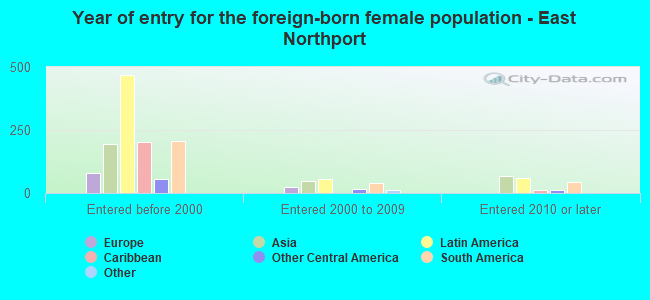
According to 2022 data, the most numerous races in East Northport, NY are White alone (16,632 residents), Hispanic (1,371 residents), and Black alone (519 residents). 88.5% of East Northport residents speak English at home. 9.2% of East Northport, NY residents are foreign-born (4.1% born in Latin America, 2.8% born in Asia, 2.1% born in Europe), which is 137.9% less than the foreign-born rate of 22.0% across the entire state of New York.
Race distribution in East Northport
2000 2022
11,760,981 62.0% White alone 2,867,583 15.1% Hispanic 2,812,623 14.8% Black alone 1,035,926 5.5% Asian alone 366,116 1.9% Two or more races 75,499 0.4% Other race alone 52,499 0.3% American Indian alone 5,230 0.03% Native Hawaiian and Other
10,408,933 52.9% White alone 3,867,299 19.7% Hispanic 2,633,840 13.4% Black alone 1,776,286 9.0% Asian alone 732,670 3.7% Two or more races 216,110 1.1% Other race alone 35,082 0.2% American Indian alone 6,931 0.04% Native Hawaiian and Other
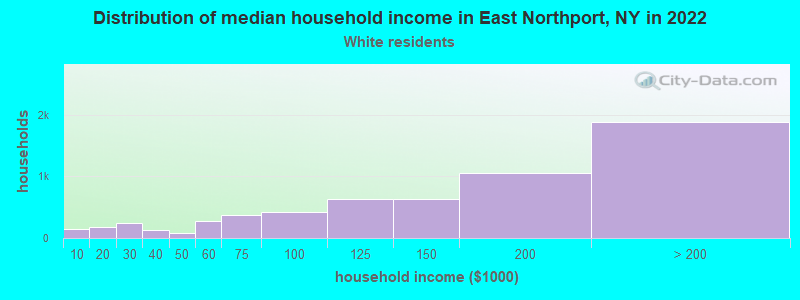
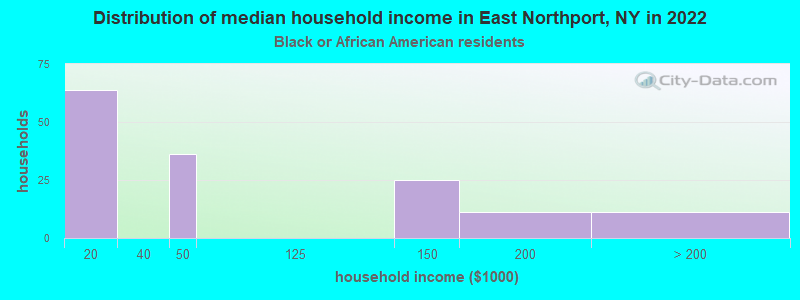
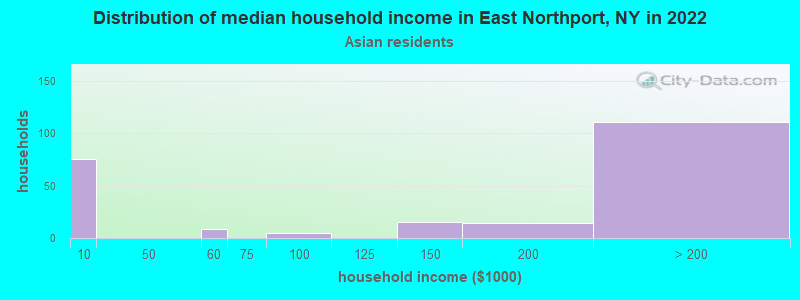
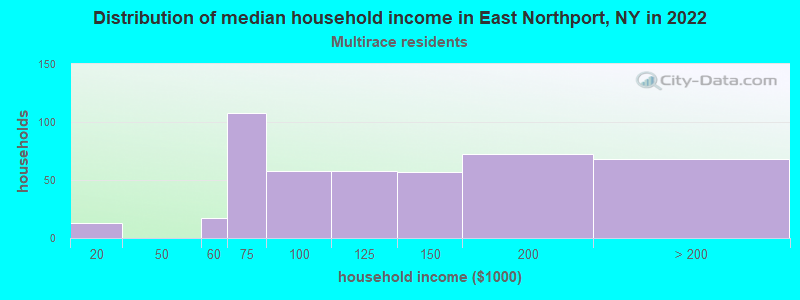
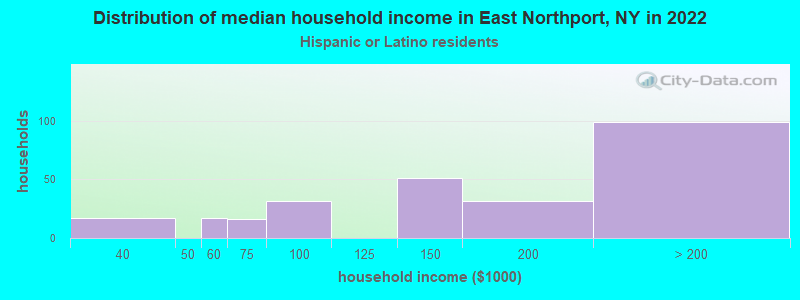
Income and house value in East Northport Median household income in 2022 $145,804 White non-Hispanic householdersover $200,000 Asian householders$99,527 Two or more races householders$158,038 Hispanic or Latino race householdersMedian 2022 house value $649,769 White Non-Hispanic householders$670,863 Black or African American householders $624,511 Asian householders$451,035 Two or more races householders$609,800 Hispanic or Latino householders
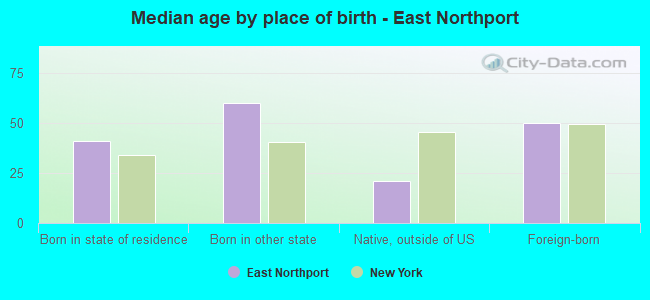
Median age by race in East Northport
47.9 Median age for White residents44.8 49.9 21.9 Median age for Black or African American residents13.9 52.1 -748,832,865.7 Median age for American Indian / Alaska Native residents-807,017,543.1 -513,692,161.9 46.2 Median age for Asian residents45.8 47.6 -742,816,091.2 Median age for Native Hawaiian / Pacific Islander residents-831,187,409.8 -771,300,447.7 50.8 Median age for Other race residents5.1 70.1 38.8 Median age for Two or more races residents39.0 25.2 47.5 Median age for White alone residents45.0 49.1 35.4 Median age for Hispanic or Latino residents28.8 38.3
Owner/renter occupied households by race in East Northport
House owners and renters - White residents 5,581 90.6% Owner occupied581 9.4% Renter occupiedHouse owners and renters - Black or African American residents 97 60.1% Owner occupied64 39.9% Renter occupiedHouse owners and renters - Asian residents 172 76.8% Owner occupied52 23.2% Renter occupiedHouse owners and renters - Other race residents 17 100.0% Owner occupiedHouse owners and renters - Two or more races residents 439 95.3% Owner occupied22 4.7% Renter occupiedHouse owners and renters - White alone residents 5,654 89.9% Owner occupied632 10.1% Renter occupiedHouse owners and renters - Hispanic or Latino residents 253 94.3% Owner occupied15 5.7% Renter occupied
Language usage in East Northport
English speakers - Total 88.5% of residents of East Northport speak English at home.
3.6% of residents speak Spanish at home 479 71.2% Speak English very well194 28.8% Speak English less than very well6.9% of residents speak other language at home 1,083 82.8% Speak English very well225 17.2% Speak English less than very well
English speakers - Born in the United States 97.1% of residents of East Northport speak English at home.
0.6% of residents speak Spanish at home 8 100.0% Speak English less than very well2.9% of residents speak other language at home 29 69.0% Speak English very well13 31.0% Speak English less than very well
English speakers - Native, born elsewhere 48.9% of residents of East Northport speak English at home.
28.2% of residents speak Spanish at home 13 35.1% Speak English very well24 64.9% Speak English less than very well24.4% of residents speak other language at home 24 75.0% Speak English very well8 25.0% Speak English less than very well
English speakers - Foreign-born 37.0% of residents of East Northport speak English at home.
20.1% of residents speak Spanish at home 294 72.8% Speak English very well110 27.2% Speak English less than very well38.8% of residents speak other language at home 610 78.3% Speak English very well169 21.7% Speak English less than very well
White (Caucasian) - Speak only English Native:
98.7% (14,415)Foreign-born:
25.4% (134)
White (Caucasian) - Speak another language Native:
2.3% (340)Foreign-born:
73.3% (386)
Black or African American - Speak only English Native:
86.9% (148)Foreign-born:
100.0% (350)
Black or African American - Speak another language Native:
13.6% (23)Foreign-born:
1.1% (4)
Asian - Speak only English Native:
75.5% (276)Foreign-born:
32.4% (165)
Asian - Speak another language Native:
19.0% (70)Foreign-born:
53.4% (272)
Other race - Speak only English Native:
40.2% (53)Foreign-born:
5.0% (10)
Other race - Speak another language Native:
59.9% (79)Foreign-born:
95.6% (188)
Two or more races - Speak another language Native:
10.8% (101)Foreign-born:
100.0% (191)
White alone - Speak only English Native:
97.1% (14,422)Foreign-born:
19.9% (119)
White alone - Speak another language Native:
2.8% (417)Foreign-born:
80.0% (480)
Hispanic or Latino - Speak only English Native:
73.3% (515)Foreign-born:
14.2% (71)
Hispanic or Latino - Speak another language Native:
28.2% (199)Foreign-born:
85.1% (428)
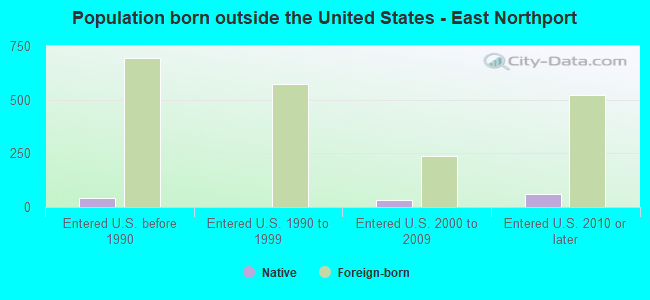
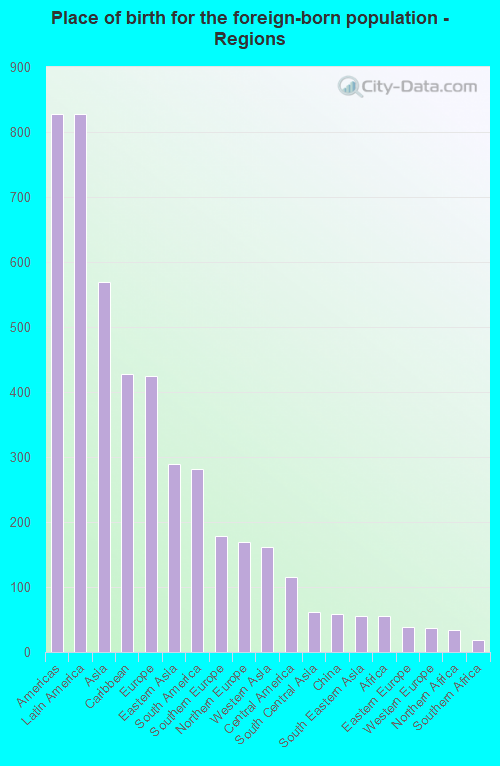
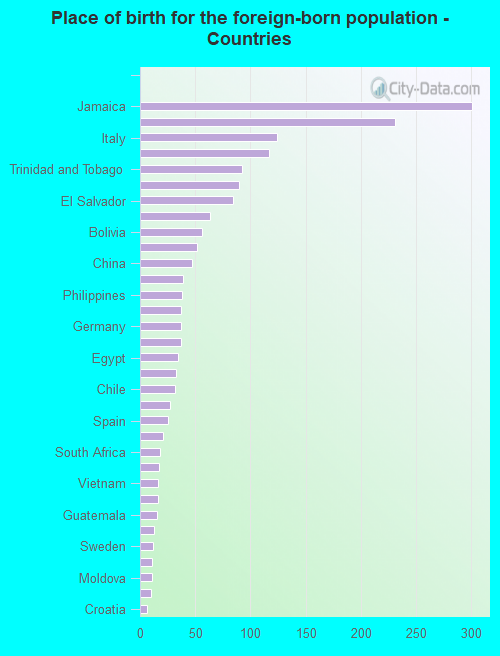
Foreign-born residents in East Northport 1,877 residents are foreign born (4.1% Latin America , 2.8% Asia , 2.1% Europe ).
This city:
9.2%New York:
22.6%
Marital status for residents in East Northport Marital status - White (Caucasian) population 15 years and over
Males 28.2% Never married58.1% Now married0.4% Separated2.5% Widowed10.7% DivorcedFemales 24.8% Never married54.6% Now married0.8% Separated7.1% Widowed12.6% DivorcedWomen who gave birth in the past 12 months Now married:
97.2% (238)Unmarried:
2.8% (7)
Women who did not give birth in the past 12 months Now married:
48.9% (1,357)Unmarried:
51.1% (1,420)
Marital status - Black or African American population 15 years and over
Males 55.8% Never married22.1% Now married16.0% Separated0.0% Widowed6.1% DivorcedFemales 51.6% Never married25.4% Now married0.0% Separated8.7% Widowed14.3% DivorcedWomen who gave birth in the past 12 months Now married:
0.0% (0)Unmarried:
100.0% (8)
Women who did not give birth in the past 12 months Now married:
80.0% (12)Unmarried:
20.0% (3)
Marital status - Asian population 15 years and over
Males 22.6% Never married72.0% Now married0.0% Separated0.0% Widowed5.4% DivorcedFemales 12.8% Never married39.8% Now married0.0% Separated0.0% Widowed47.4% DivorcedWomen who gave birth in the past 12 months Now married:
100.0% (8)Unmarried:
0.0% (0)
Women who did not give birth in the past 12 months Now married:
40.6% (68)Unmarried:
59.4% (99)
Marital status - Other race population 15 years and over
Males 52.8% Never married47.2% Now married0.0% Separated0.0% Widowed0.0% DivorcedFemales 0.0% Never married57.8% Now married0.0% Separated0.0% Widowed42.2% DivorcedWomen who did not give birth in the past 12 months Now married:
51.9% (20)Unmarried:
48.1% (19)
Marital status - Two or more races population 15 years and over
Males 8.3% Never married89.0% Now married0.0% Separated2.6% Widowed0.0% DivorcedFemales 37.5% Never married50.4% Now married0.0% Separated8.4% Widowed3.6% DivorcedWomen who did not give birth in the past 12 months Now married:
22.5% (57)Unmarried:
77.5% (196)
Marital status - White alone, not Hispanic / Latino population 15 years and over
Males 28.1% Never married58.2% Now married0.4% Separated2.6% Widowed10.7% DivorcedFemales 24.0% Never married55.3% Now married0.9% Separated7.1% Widowed12.7% DivorcedWomen who gave birth in the past 12 months Now married:
100.0% (235)Unmarried:
0.0% (0)
Women who did not give birth in the past 12 months Now married:
50.0% (1,441)Unmarried:
50.0% (1,438)
Marital status - Hispanic or Latino population 15 years and over
Males 23.7% Never married70.8% Now married0.0% Separated0.0% Widowed5.5% DivorcedFemales 34.3% Never married35.0% Now married0.0% Separated7.0% Widowed23.7% DivorcedWomen who gave birth in the past 12 months Now married:
75.0% (25)Unmarried:
25.0% (8)
Women who did not give birth in the past 12 months Now married:
21.7% (62)Unmarried:
78.3% (223)
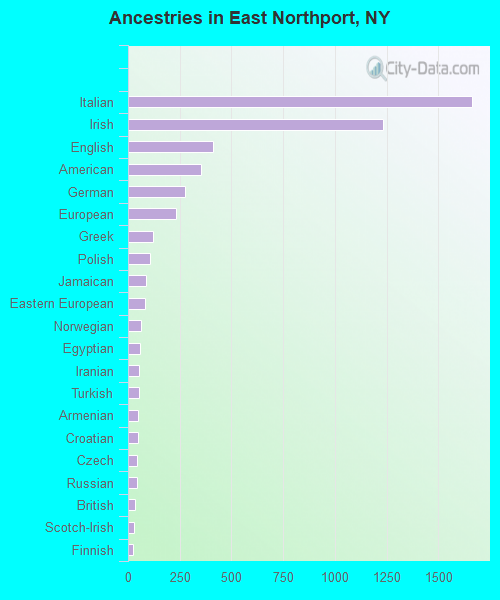
Ancestries in East Northport
1,662 23.4% Italian1,233 17.4% Irish411 5.8% English355 5.0% American274 3.9% German231 3.3% European122 1.7% Greek106 1.5% Polish85 1.2% Jamaican83 1.2% Eastern European62 0.9% Norwegian57 0.8% Egyptian54 0.8% Iranian52 0.7% Turkish48 0.7% Armenian46 0.6% Croatian45 0.6% Czech44 0.6% Russian33 0.5% British30 0.4% Scotch-Irish24 0.3% Finnish14 0.2% Hungarian13 0.2% Guyanese13 0.2% Ukrainian12 0.2% Dutch11 0.2% Albanian10 0.1% Austrian8 0.1% Lithuanian8 0.1% West Indian7 0.10% French7 0.10% Estonian6 0.08% Northern European2 0.03% Danish2 0.03% Scottish
Children Nativity (place of birth) in East Northport
Children under 6 years - Living with two parents Both parents native 1,149 98.8% Native13 1.2% Foreign-bornBoth parents foreign-born 118 85.8% Native19 14.2% Foreign-bornOne native, one foreign-born parent 184 100.0% NativeChildren under 6 years - Living with one parent Native parent 61 100.0% NativeForeign-born parent 62 100.0% NativeChildren 6 to 17 years - Living with two parents Both parents native 1,567 98.6% Native22 1.4% Foreign-bornBoth parents foreign-born 148 93.3% Native11 6.7% Foreign-bornOne native, one foreign-born parent 462 100.0% NativeChildren 6 to 17 years - Living with one parent Native parent 42 18.8% Native182 81.2% Foreign-bornForeign-born parent 304 80.5% Native74 19.5% Foreign-born
Grandparents responsible for own grandchildren in East Northport
Grandparents (30 to 59 years) White / Caucasian 19 100.0% Not responsible for grandchildrenTwo or more races 57 100.0% Responsible for grandchildrenWhite alone, not Hispanic / Latino 22 100.0% Not responsible for grandchildrenHispanic or Latino 45 100.0% Responsible for grandchildrenGrandparents (60 years and over) White / Caucasian 10 8.1% Responsible for grandchildren110 91.9% Not responsible for grandchildrenWhite alone, not Hispanic / Latino 12 8.9% Responsible for grandchildren120 91.1% Not responsible for grandchildren