Races in East Stroudsburg, Pennsylvania (PA) Detailed Stats
Data:
Races - White alone (%)
Races - White alone (% change since 2000)
Races - Black alone (%)
Races - Black alone (% change since 2000)
Races - American Indian alone (%)
Races - American Indian alone (% change since 2000)
Races - Asian alone (%)
Races - Asian alone (% change since 2000)
Races - Hispanic (%)
Races - Hispanic (% change since 2000)
Races - Native Hawaiian and Other Pacific Islander alone (%)
Races - Native Hawaiian and Other Pacific Islander alone (% change since 2000)
Races - Two or more races(%)
Races - Two or more races(% change since 2000)
Races - Other race alone (%)
Races - Other race alone (% change since 2000)
Racial diversity
Place of birth - Born in state of residence (%)
Place of birth - Born in state of residence (%) - White
Place of birth - Born in state of residence (%) - Black or African American
Place of birth - Born in state of residence (%) - Asian
Place of birth - Born in state of residence (%) - Hispanic or Latino
Place of birth - Born in state of residence (%) - American Indian and Alaska Native
Place of birth - Born in state of residence (%) - Multirace
Place of birth - Born in state of residence (%) - Other Race
Place of birth - Born in other state (%)
Place of birth - Born in other state (%) - White
Place of birth - Born in other state (%) - Black or African American
Place of birth - Born in other state (%) - Asian
Place of birth - Born in other state (%) - Hispanic or Latino
Place of birth - Born in other state (%) - American Indian and Alaska Native
Place of birth - Born in other state (%) - Multirace
Place of birth - Born in other state (%) - Other Race
Place of birth - Native, outside of US (%)
Place of birth - Native, outside of US (%) - White
Place of birth - Native, outside of US (%) - Black or African American
Place of birth - Native, outside of US (%) - Asian
Place of birth - Native, outside of US (%) - Hispanic or Latino
Place of birth - Native, outside of US (%) - American Indian and Alaska Native
Place of birth - Native, outside of US (%) - Multirace
Place of birth - Native, outside of US (%) - Other Race
Place of birth - Foreign born (%)
Place of birth - Foreign born (%) - White
Place of birth - Foreign born (%) - Black or African American
Place of birth - Foreign born (%) - Asian
Place of birth - Foreign born (%) - Hispanic or Latino
Place of birth - Foreign born (%) - American Indian and Alaska Native
Place of birth - Foreign born (%) - Multirace
Place of birth - Foreign born (%) - Other Race
Residents speaking English at home (%)
Residents speaking English at home - Born in the United States (%)
Residents speaking English at home - Native, born elsewhere (%)
Residents speaking English at home - Foreign born (%)
Residents speaking Spanish at home (%)
Residents speaking Spanish at home - Born in the United States (%)
Residents speaking Spanish at home - Native, born elsewhere (%)
Residents speaking Spanish at home - Foreign born (%)
Residents speaking other language at home (%)
Residents speaking other language at home - Born in the United States (%)
Residents speaking other language at home - Native, born elsewhere (%)
Residents speaking other language at home - Foreign born (%)
Marital status - Never married (%)
Marital status - Now married (%)
Marital status - Separated (%)
Marital status - Widowed (%)
Marital status - Divorced (%)
Ancestries Reported - Arab (%)
Ancestries Reported - Czech (%)
Ancestries Reported - Danish (%)
Ancestries Reported - Dutch (%)
Ancestries Reported - English (%)
Ancestries Reported - French (%)
Ancestries Reported - French Canadian (%)
Ancestries Reported - German (%)
Ancestries Reported - Greek (%)
Ancestries Reported - Hungarian (%)
Ancestries Reported - Irish (%)
Ancestries Reported - Italian (%)
Ancestries Reported - Lithuanian (%)
Ancestries Reported - Norwegian (%)
Ancestries Reported - Polish (%)
Ancestries Reported - Portuguese (%)
Ancestries Reported - Russian (%)
Ancestries Reported - Scotch-Irish (%)
Ancestries Reported - Scottish (%)
Ancestries Reported - Slovak (%)
Ancestries Reported - Subsaharan African (%)
Ancestries Reported - Swedish (%)
Ancestries Reported - Swiss (%)
Ancestries Reported - Ukrainian (%)
Ancestries Reported - United States (%)
Ancestries Reported - Welsh (%)
Ancestries Reported - West Indian (%)
Ancestries Reported - Other (%)
Geographical mobility - Same house 1 year ago (%)
Geographical mobility - Same house 1 year ago (%) - White
Geographical mobility - Same house 1 year ago (%) - Black or African American
Geographical mobility - Same house 1 year ago (%) - Asian
Geographical mobility - Same house 1 year ago (%) - Hispanic or Latino
Geographical mobility - Same house 1 year ago (%) - American Indian and Alaska Native
Geographical mobility - Same house 1 year ago (%) - Multirace
Geographical mobility - Same house 1 year ago (%) - Other Race
Geographical mobility - Moved within same county (%)
Geographical mobility - Moved within same county (%) - White
Geographical mobility - Moved within same county (%) - Black or African American
Geographical mobility - Moved within same county (%) - Asian
Geographical mobility - Moved within same county (%) - Hispanic or Latino
Geographical mobility - Moved within same county (%) - American Indian and Alaska Native
Geographical mobility - Moved within same county (%) - Multirace
Geographical mobility - Moved within same county (%) - Other Race
Geographical mobility - Moved from different county within same state (%)
Geographical mobility - Moved from different county within same state (%) - White
Geographical mobility - Moved from different county within same state (%) - Black or African American
Geographical mobility - Moved from different county within same state (%) - Asian
Geographical mobility - Moved from different county within same state (%) - Hispanic or Latino
Geographical mobility - Moved from different county within same state (%) - American Indian and Alaska Native
Geographical mobility - Moved from different county within same state (%) - Multirace
Geographical mobility - Moved from different county within same state (%) - Other Race
Geographical mobility - Moved from different state (%)
Geographical mobility - Moved from different state (%) - White
Geographical mobility - Moved from different state (%) - Black or African American
Geographical mobility - Moved from different state (%) - Asian
Geographical mobility - Moved from different state (%) - Hispanic or Latino
Geographical mobility - Moved from different state (%) - American Indian and Alaska Native
Geographical mobility - Moved from different state (%) - Multirace
Geographical mobility - Moved from different state (%) - Other Race
Geographical mobility - Moved from abroad (%)
Geographical mobility - Moved from abroad (%) - White
Geographical mobility - Moved from abroad (%) - Black or African American
Geographical mobility - Moved from abroad (%) - Asian
Geographical mobility - Moved from abroad (%) - Hispanic or Latino
Geographical mobility - Moved from abroad (%) - American Indian and Alaska Native
Geographical mobility - Moved from abroad (%) - Multirace
Geographical mobility - Moved from abroad (%) - Other Race
Place of birth for the foreign-born population - Ireland (%)
Place of birth for the foreign-born population - Denmark (%)
Place of birth for the foreign-born population - Norway (%)
Place of birth for the foreign-born population - Sweden (%)
Place of birth for the foreign-born population - United Kingdom (%)
Place of birth for the foreign-born population - England (%)
Place of birth for the foreign-born population - Scotland (%)
Place of birth for the foreign-born population - Other Northern Europe (%)
Place of birth for the foreign-born population - Austria (%)
Place of birth for the foreign-born population - Belgium (%)
Place of birth for the foreign-born population - France (%)
Place of birth for the foreign-born population - Germany (%)
Place of birth for the foreign-born population - Netherlands (%)
Place of birth for the foreign-born population - Switzerland (%)
Place of birth for the foreign-born population - Other Western Europe (%)
Place of birth for the foreign-born population - Greece (%)
Place of birth for the foreign-born population - Italy (%)
Place of birth for the foreign-born population - Portugal (%)
Place of birth for the foreign-born population - Spain (%)
Place of birth for the foreign-born population - Other Southern Europe (%)
Place of birth for the foreign-born population - Albania (%)
Place of birth for the foreign-born population - Belarus (%)
Place of birth for the foreign-born population - Bosnia and Herzegovina (%)
Place of birth for the foreign-born population - Bulgaria (%)
Place of birth for the foreign-born population - Croatia (%)
Place of birth for the foreign-born population - Czechoslovakia (%)
Place of birth for the foreign-born population - Hungary (%)
Place of birth for the foreign-born population - Latvia (%)
Place of birth for the foreign-born population - Lithuania (%)
Place of birth for the foreign-born population - North Macedonia (Macedonia) (%)
Place of birth for the foreign-born population - Moldova (%)
Place of birth for the foreign-born population - Poland (%)
Place of birth for the foreign-born population - Romania (%)
Place of birth for the foreign-born population - Russia (%)
Place of birth for the foreign-born population - Serbia (%)
Place of birth for the foreign-born population - Ukraine (%)
Place of birth for the foreign-born population - Other Eastern Europe (%)
Place of birth for the foreign-born population - China (%)
Place of birth for the foreign-born population - Hong Kong (%)
Place of birth for the foreign-born population - Taiwan (%)
Place of birth for the foreign-born population - Japan (%)
Place of birth for the foreign-born population - Korea (%)
Place of birth for the foreign-born population - Other Eastern Asia (%)
Place of birth for the foreign-born population - Afghanistan (%)
Place of birth for the foreign-born population - Bangladesh (%)
Place of birth for the foreign-born population - India (%)
Place of birth for the foreign-born population - Iran (%)
Place of birth for the foreign-born population - Kazakhstan (%)
Place of birth for the foreign-born population - Nepal (%)
Place of birth for the foreign-born population - Pakistan (%)
Place of birth for the foreign-born population - Sri Lanka (%)
Place of birth for the foreign-born population - Uzbekistan (%)
Place of birth for the foreign-born population - Other South Central Asia (%)
Place of birth for the foreign-born population - Burma (%)
Place of birth for the foreign-born population - Cambodia (%)
Place of birth for the foreign-born population - Indonesia (%)
Place of birth for the foreign-born population - Laos (%)
Place of birth for the foreign-born population - Malaysia (%)
Place of birth for the foreign-born population - Philippines (%)
Place of birth for the foreign-born population - Singapore (%)
Place of birth for the foreign-born population - Thailand (%)
Place of birth for the foreign-born population - Vietnam (%)
Place of birth for the foreign-born population - Other South Eastern Asia (%)
Place of birth for the foreign-born population - Armenia (%)
Place of birth for the foreign-born population - Iraq (%)
Place of birth for the foreign-born population - Israel (%)
Place of birth for the foreign-born population - Jordan (%)
Place of birth for the foreign-born population - Kuwait (%)
Place of birth for the foreign-born population - Lebanon (%)
Place of birth for the foreign-born population - Saudi Arabia (%)
Place of birth for the foreign-born population - Syria (%)
Place of birth for the foreign-born population - Turkey (%)
Place of birth for the foreign-born population - Yemen (%)
Place of birth for the foreign-born population - Other Western Asia (%)
Place of birth for the foreign-born population - Eritrea (%)
Place of birth for the foreign-born population - Ethiopia (%)
Place of birth for the foreign-born population - Kenya (%)
Place of birth for the foreign-born population - Somalia (%)
Place of birth for the foreign-born population - Uganda (%)
Place of birth for the foreign-born population - Zimbabwe (%)
Place of birth for the foreign-born population - Other Eastern Africa (%)
Place of birth for the foreign-born population - Cameroon (%)
Place of birth for the foreign-born population - Congo (%)
Place of birth for the foreign-born population - Democratic Republic of Congo (Zaire) (%)
Place of birth for the foreign-born population - Other Middle Africa (%)
Place of birth for the foreign-born population - Egypt (%)
Place of birth for the foreign-born population - Morocco (%)
Place of birth for the foreign-born population - Sudan (%)
Place of birth for the foreign-born population - Other Northern Africa (%)
Place of birth for the foreign-born population - South Africa (%)
Place of birth for the foreign-born population - Other Southern Africa (%)
Place of birth for the foreign-born population - Cabo Verde (%)
Place of birth for the foreign-born population - Ghana (%)
Place of birth for the foreign-born population - Liberia (%)
Place of birth for the foreign-born population - Nigeria (%)
Place of birth for the foreign-born population - Senegal (%)
Place of birth for the foreign-born population - Sierra Leone (%)
Place of birth for the foreign-born population - Other Western Africa (%)
Place of birth for the foreign-born population - Australia (%)
Place of birth for the foreign-born population - New Zealand (%)
Place of birth for the foreign-born population - Fiji (%)
Place of birth for the foreign-born population - Micronesia (%)
Place of birth for the foreign-born population - Bahamas (%)
Place of birth for the foreign-born population - Barbados (%)
Place of birth for the foreign-born population - Cuba (%)
Place of birth for the foreign-born population - Dominica (%)
Place of birth for the foreign-born population - Dominican Republic (%)
Place of birth for the foreign-born population - Grenada (%)
Place of birth for the foreign-born population - Haiti (%)
Place of birth for the foreign-born population - Jamaica (%)
Place of birth for the foreign-born population - St. Vincent and the Grenadines (%)
Place of birth for the foreign-born population - Trinidad and Tobago (%)
Place of birth for the foreign-born population - West Indies (%)
Place of birth for the foreign-born population - Other Caribbean (%)
Place of birth for the foreign-born population - Belize (%)
Place of birth for the foreign-born population - Costa Rica (%)
Place of birth for the foreign-born population - El Salvador (%)
Place of birth for the foreign-born population - Guatemala (%)
Place of birth for the foreign-born population - Honduras (%)
Place of birth for the foreign-born population - Mexico (%)
Place of birth for the foreign-born population - Nicaragua (%)
Place of birth for the foreign-born population - Panama (%)
Place of birth for the foreign-born population - Other Central America (%)
Place of birth for the foreign-born population - Argentina (%)
Place of birth for the foreign-born population - Bolivia (%)
Place of birth for the foreign-born population - Brazil (%)
Place of birth for the foreign-born population - Chile (%)
Place of birth for the foreign-born population - Colombia (%)
Place of birth for the foreign-born population - Ecuador (%)
Place of birth for the foreign-born population - Guyana (%)
Place of birth for the foreign-born population - Peru (%)
Place of birth for the foreign-born population - Uruguay (%)
Place of birth for the foreign-born population - Venezuela (%)
Place of birth for the foreign-born population - Other South America (%)
Place of birth for the foreign-born population - Canada (%)
Place of birth for the foreign-born population - Other Northern America (%)
Place of birth for the foreign-born population - Other (%)
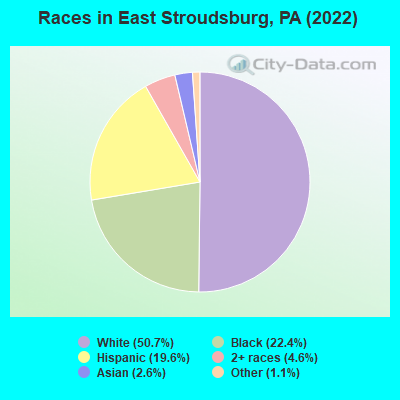
According to 2022 data, the most numerous races in East Stroudsburg, PA are White alone (4,715 residents), Black alone (2,078 residents), and Hispanic (1,822 residents). 83.5% of East Stroudsburg residents speak English at home. 11.1% of East Stroudsburg, PA residents are foreign-born (3.8% born in Europe, 3.3% born in Latin America, 2.1% born in Asia, 1.4% born in Africa), which is 37.0% greater than the foreign-born rate of 7.0% across the entire state of Pennsylvania.
Race distribution in East Stroudsburg
2000 2022
10,322,455 84.1% White alone 1,202,437 9.8% Black alone 394,088 3.2% Hispanic 218,296 1.8% Asian alone 113,097 0.9% Two or more races 13,086 0.1% Other race alone 14,904 0.1% American Indian alone 2,691 0.02% Native Hawaiian and Other
9,487,228 73.1% White alone 1,311,581 10.1% Black alone 1,115,997 8.6% Hispanic 493,942 3.8% Two or more races 487,124 3.8% Asian alone 63,582 0.5% Other race alone 10,130 0.08% American Indian alone 2,424 0.02% Native Hawaiian and Other
Income and house value in East Stroudsburg Median household income in 2022 $56,133 White non-Hispanic householders$59,073 Black householders$79,365 Some other race householders$62,937 Two or more races householders$58,452 Hispanic or Latino race householdersMedian 2022 house value $228,702 White Non-Hispanic householders$255,701 Black or African American householders $446,684 Asian householders$272,973 Some other race householders$173,710 Two or more races householders$221,753 Hispanic or Latino householders
Median age by race in East Stroudsburg
44.2 Median age for White residents42.8 44.9 20.5 Median age for Black or African American residents20.6 22.8 -592,592,592.0 Median age for American Indian / Alaska Native residents-570,536,828.4 -577,519,379.3 24.6 Median age for Asian residents60.4 25.6 -680,432,644.4 Median age for Native Hawaiian / Pacific Islander residents-666,666,666.0 -666,666,666.0 40.7 Median age for Other race residents48.7 32.5 32.2 Median age for Two or more races residents28.7 33.0 43.5 Median age for White alone residents40.6 44.9 37.7 Median age for Hispanic or Latino residents39.6 36.0
Owner/renter occupied households by race in East Stroudsburg
House owners and renters - White residents 1,066 63.2% Owner occupied621 36.8% Renter occupiedHouse owners and renters - Black or African American residents 109 22.2% Owner occupied382 77.8% Renter occupiedHouse owners and renters - Asian residents 47 100.0% Owner occupiedHouse owners and renters - Other race residents 150 53.0% Owner occupied133 47.0% Renter occupiedHouse owners and renters - Two or more races residents 127 39.7% Owner occupied194 60.3% Renter occupiedHouse owners and renters - White alone residents 1,073 62.0% Owner occupied657 38.0% Renter occupiedHouse owners and renters - Hispanic or Latino residents 186 44.4% Owner occupied233 55.6% Renter occupied
Language usage in East Stroudsburg
English speakers - Total 83.5% of residents of East Stroudsburg speak English at home.
6.5% of residents speak Spanish at home 327 55.4% Speak English very well263 44.6% Speak English less than very well9.6% of residents speak other language at home 564 64.7% Speak English very well308 35.3% Speak English less than very well
English speakers - Born in the United States 92.8% of residents of East Stroudsburg speak English at home.
3.4% of residents speak Spanish at home 114 85.1% Speak English very well20 14.9% Speak English less than very well4.0% of residents speak other language at home 147 91.9% Speak English very well13 8.1% Speak English less than very well
English speakers - Native, born elsewhere 58.0% of residents of East Stroudsburg speak English at home.
44.1% of residents speak Spanish at home 63 100.0% Speak English very well7.7% of residents speak other language at home 11 100.0% Speak English less than very well
English speakers - Foreign-born 21.6% of residents of East Stroudsburg speak English at home.
29.9% of residents speak Spanish at home 75 20.1% Speak English very well299 79.9% Speak English less than very well48.6% of residents speak other language at home 332 54.5% Speak English very well277 45.5% Speak English less than very well
White (Caucasian) - Speak only English Native:
94.9% (4,154)Foreign-born:
42.6% (164)
White (Caucasian) - Speak another language Native:
4.8% (212)Foreign-born:
59.1% (228)
Black or African American - Speak only English Native:
100.0% (1,847)Foreign-born:
23.8% (51)
Black or African American - Speak another language Native:
0.4% (7)Foreign-born:
70.1% (151)
Asian - Speak another language Native:
74.9% (115)Foreign-born:
100.0% (98)
Other race - Speak only English Native:
63.0% (574)Foreign-born:
3.9% (6)
Other race - Speak another language Native:
27.0% (246)Foreign-born:
98.7% (162)
Two or more races - Speak only English Native:
100.0% (742)Foreign-born:
21.8% (83)
Two or more races - Speak another language Native:
4.9% (37)Foreign-born:
78.9% (300)
White alone - Speak only English Native:
93.2% (3,996)Foreign-born:
40.6% (187)
White alone - Speak another language Native:
6.4% (275)Foreign-born:
59.9% (275)
Hispanic or Latino - Speak only English Native:
87.2% (1,078)Foreign-born:
17.9% (74)
Hispanic or Latino - Speak another language Native:
17.3% (214)Foreign-born:
83.2% (344)
Foreign-born residents in East Stroudsburg 1,033 residents are foreign born (3.8% Europe , 3.3% Latin America , 2.1% Asia , 1.4% Africa ).
This city:
11.1%Pennsylvania:
7.3%
Marital status for residents in East Stroudsburg Marital status - White (Caucasian) population 15 years and over
Males 52.8% Never married29.9% Now married0.0% Separated3.9% Widowed13.4% DivorcedFemales 49.7% Never married23.0% Now married2.7% Separated11.0% Widowed13.6% DivorcedWomen who gave birth in the past 12 months Now married:
100.0% (9)Unmarried:
0.0% (0)
Women who did not give birth in the past 12 months Now married:
20.6% (278)Unmarried:
79.4% (1,074)
Marital status - Black or African American population 15 years and over
Males 74.6% Never married19.2% Now married0.0% Separated6.2% Widowed0.0% DivorcedFemales 71.3% Never married16.3% Now married2.8% Separated8.4% Widowed1.2% DivorcedWomen who did not give birth in the past 12 months Now married:
15.9% (122)Unmarried:
84.1% (646)
Marital status - Asian population 15 years and over
Males 37.1% Never married62.9% Now married0.0% Separated0.0% Widowed0.0% DivorcedFemales 57.5% Never married32.8% Now married0.0% Separated9.8% Widowed0.0% DivorcedWomen who did not give birth in the past 12 months Now married:
14.5% (17)Unmarried:
85.5% (103)
Marital status - Other race population 15 years and over
Males 60.3% Never married29.2% Now married10.5% Separated0.0% Widowed0.0% DivorcedFemales 43.7% Never married35.6% Now married5.3% Separated11.2% Widowed4.1% DivorcedWomen who gave birth in the past 12 months Now married:
0.0% (0)Unmarried:
100.0% (96)
Women who did not give birth in the past 12 months Now married:
59.9% (117)Unmarried:
40.1% (79)
Marital status - Two or more races population 15 years and over
Males 23.6% Never married41.6% Now married15.2% Separated10.1% Widowed9.5% DivorcedFemales 41.6% Never married39.5% Now married0.4% Separated0.0% Widowed18.5% DivorcedWomen who did not give birth in the past 12 months Now married:
36.8% (92)Unmarried:
63.2% (159)
Marital status - White alone, not Hispanic / Latino population 15 years and over
Males 56.0% Never married26.3% Now married0.0% Separated4.2% Widowed13.5% DivorcedFemales 48.9% Never married21.9% Now married2.9% Separated11.8% Widowed14.6% DivorcedWomen who gave birth in the past 12 months Now married:
100.0% (10)Unmarried:
0.0% (0)
Women who did not give birth in the past 12 months Now married:
18.4% (236)Unmarried:
81.6% (1,046)
Marital status - Hispanic or Latino population 15 years and over
Males 45.4% Never married46.1% Now married5.8% Separated0.0% Widowed2.6% DivorcedFemales 48.3% Never married39.0% Now married3.0% Separated0.0% Widowed9.7% DivorcedWomen who gave birth in the past 12 months Now married:
0.0% (0)Unmarried:
100.0% (85)
Women who did not give birth in the past 12 months Now married:
47.4% (220)Unmarried:
52.6% (244)
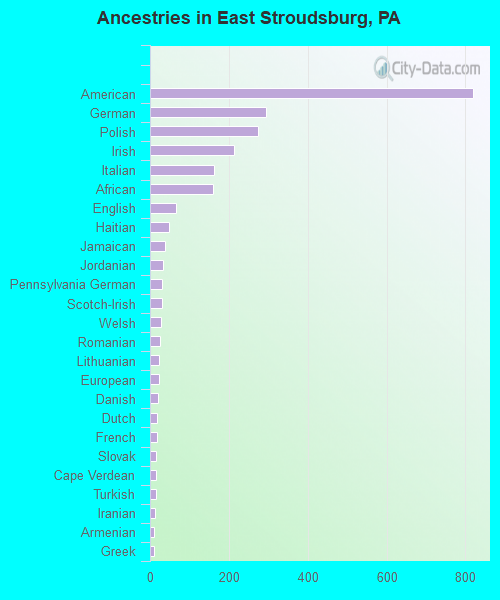
Ancestries in East Stroudsburg
819 18.9% American293 6.8% German274 6.3% Polish212 4.9% Irish163 3.8% Italian160 3.7% African67 1.5% English49 1.1% Haitian38 0.9% Jamaican33 0.8% Jordanian30 0.7% Pennsylvania German30 0.7% Scotch-Irish29 0.7% Welsh25 0.6% Romanian24 0.6% Lithuanian23 0.5% European21 0.5% Danish19 0.4% Dutch17 0.4% French15 0.3% Slovak14 0.3% Cape Verdean14 0.3% Turkish13 0.3% Iranian11 0.3% Armenian10 0.2% Greek10 0.2% Swedish9 0.2% Hungarian8 0.2% Swiss6 0.1% French Canadian4 0.09% British2 0.05% Albanian
Children Nativity (place of birth) in East Stroudsburg
Children under 6 years - Living with two parents Both parents native 80 100.0% NativeBoth parents foreign-born 62 100.0% NativeChildren under 6 years - Living with one parent Native parent 86 100.0% NativeForeign-born parent 24 100.0% NativeChildren 6 to 17 years - Living with two parents Both parents native 85 100.0% NativeBoth parents foreign-born 197 100.0% NativeOne native, one foreign-born parent 114 100.0% NativeChildren 6 to 17 years - Living with one parent Native parent 526 100.0% NativeForeign-born parent 51 52.9% Native45 47.1% Foreign-born