Races in Edgewood, Maryland (MD) Detailed Stats
Data:
Races - White alone (%)
Races - White alone (% change since 2000)
Races - Black alone (%)
Races - Black alone (% change since 2000)
Races - American Indian alone (%)
Races - American Indian alone (% change since 2000)
Races - Asian alone (%)
Races - Asian alone (% change since 2000)
Races - Hispanic (%)
Races - Hispanic (% change since 2000)
Races - Native Hawaiian and Other Pacific Islander alone (%)
Races - Native Hawaiian and Other Pacific Islander alone (% change since 2000)
Races - Two or more races(%)
Races - Two or more races(% change since 2000)
Races - Other race alone (%)
Races - Other race alone (% change since 2000)
Racial diversity
Place of birth - Born in state of residence (%)
Place of birth - Born in state of residence (%) - White
Place of birth - Born in state of residence (%) - Black or African American
Place of birth - Born in state of residence (%) - Asian
Place of birth - Born in state of residence (%) - Hispanic or Latino
Place of birth - Born in state of residence (%) - American Indian and Alaska Native
Place of birth - Born in state of residence (%) - Multirace
Place of birth - Born in state of residence (%) - Other Race
Place of birth - Born in other state (%)
Place of birth - Born in other state (%) - White
Place of birth - Born in other state (%) - Black or African American
Place of birth - Born in other state (%) - Asian
Place of birth - Born in other state (%) - Hispanic or Latino
Place of birth - Born in other state (%) - American Indian and Alaska Native
Place of birth - Born in other state (%) - Multirace
Place of birth - Born in other state (%) - Other Race
Place of birth - Native, outside of US (%)
Place of birth - Native, outside of US (%) - White
Place of birth - Native, outside of US (%) - Black or African American
Place of birth - Native, outside of US (%) - Asian
Place of birth - Native, outside of US (%) - Hispanic or Latino
Place of birth - Native, outside of US (%) - American Indian and Alaska Native
Place of birth - Native, outside of US (%) - Multirace
Place of birth - Native, outside of US (%) - Other Race
Place of birth - Foreign born (%)
Place of birth - Foreign born (%) - White
Place of birth - Foreign born (%) - Black or African American
Place of birth - Foreign born (%) - Asian
Place of birth - Foreign born (%) - Hispanic or Latino
Place of birth - Foreign born (%) - American Indian and Alaska Native
Place of birth - Foreign born (%) - Multirace
Place of birth - Foreign born (%) - Other Race
Residents speaking English at home (%)
Residents speaking English at home - Born in the United States (%)
Residents speaking English at home - Native, born elsewhere (%)
Residents speaking English at home - Foreign born (%)
Residents speaking Spanish at home (%)
Residents speaking Spanish at home - Born in the United States (%)
Residents speaking Spanish at home - Native, born elsewhere (%)
Residents speaking Spanish at home - Foreign born (%)
Residents speaking other language at home (%)
Residents speaking other language at home - Born in the United States (%)
Residents speaking other language at home - Native, born elsewhere (%)
Residents speaking other language at home - Foreign born (%)
Marital status - Never married (%)
Marital status - Now married (%)
Marital status - Separated (%)
Marital status - Widowed (%)
Marital status - Divorced (%)
Ancestries Reported - Arab (%)
Ancestries Reported - Czech (%)
Ancestries Reported - Danish (%)
Ancestries Reported - Dutch (%)
Ancestries Reported - English (%)
Ancestries Reported - French (%)
Ancestries Reported - French Canadian (%)
Ancestries Reported - German (%)
Ancestries Reported - Greek (%)
Ancestries Reported - Hungarian (%)
Ancestries Reported - Irish (%)
Ancestries Reported - Italian (%)
Ancestries Reported - Lithuanian (%)
Ancestries Reported - Norwegian (%)
Ancestries Reported - Polish (%)
Ancestries Reported - Portuguese (%)
Ancestries Reported - Russian (%)
Ancestries Reported - Scotch-Irish (%)
Ancestries Reported - Scottish (%)
Ancestries Reported - Slovak (%)
Ancestries Reported - Subsaharan African (%)
Ancestries Reported - Swedish (%)
Ancestries Reported - Swiss (%)
Ancestries Reported - Ukrainian (%)
Ancestries Reported - United States (%)
Ancestries Reported - Welsh (%)
Ancestries Reported - West Indian (%)
Ancestries Reported - Other (%)
Geographical mobility - Same house 1 year ago (%)
Geographical mobility - Same house 1 year ago (%) - White
Geographical mobility - Same house 1 year ago (%) - Black or African American
Geographical mobility - Same house 1 year ago (%) - Asian
Geographical mobility - Same house 1 year ago (%) - Hispanic or Latino
Geographical mobility - Same house 1 year ago (%) - American Indian and Alaska Native
Geographical mobility - Same house 1 year ago (%) - Multirace
Geographical mobility - Same house 1 year ago (%) - Other Race
Geographical mobility - Moved within same county (%)
Geographical mobility - Moved within same county (%) - White
Geographical mobility - Moved within same county (%) - Black or African American
Geographical mobility - Moved within same county (%) - Asian
Geographical mobility - Moved within same county (%) - Hispanic or Latino
Geographical mobility - Moved within same county (%) - American Indian and Alaska Native
Geographical mobility - Moved within same county (%) - Multirace
Geographical mobility - Moved within same county (%) - Other Race
Geographical mobility - Moved from different county within same state (%)
Geographical mobility - Moved from different county within same state (%) - White
Geographical mobility - Moved from different county within same state (%) - Black or African American
Geographical mobility - Moved from different county within same state (%) - Asian
Geographical mobility - Moved from different county within same state (%) - Hispanic or Latino
Geographical mobility - Moved from different county within same state (%) - American Indian and Alaska Native
Geographical mobility - Moved from different county within same state (%) - Multirace
Geographical mobility - Moved from different county within same state (%) - Other Race
Geographical mobility - Moved from different state (%)
Geographical mobility - Moved from different state (%) - White
Geographical mobility - Moved from different state (%) - Black or African American
Geographical mobility - Moved from different state (%) - Asian
Geographical mobility - Moved from different state (%) - Hispanic or Latino
Geographical mobility - Moved from different state (%) - American Indian and Alaska Native
Geographical mobility - Moved from different state (%) - Multirace
Geographical mobility - Moved from different state (%) - Other Race
Geographical mobility - Moved from abroad (%)
Geographical mobility - Moved from abroad (%) - White
Geographical mobility - Moved from abroad (%) - Black or African American
Geographical mobility - Moved from abroad (%) - Asian
Geographical mobility - Moved from abroad (%) - Hispanic or Latino
Geographical mobility - Moved from abroad (%) - American Indian and Alaska Native
Geographical mobility - Moved from abroad (%) - Multirace
Geographical mobility - Moved from abroad (%) - Other Race
Place of birth for the foreign-born population - Ireland (%)
Place of birth for the foreign-born population - Denmark (%)
Place of birth for the foreign-born population - Norway (%)
Place of birth for the foreign-born population - Sweden (%)
Place of birth for the foreign-born population - United Kingdom (%)
Place of birth for the foreign-born population - England (%)
Place of birth for the foreign-born population - Scotland (%)
Place of birth for the foreign-born population - Other Northern Europe (%)
Place of birth for the foreign-born population - Austria (%)
Place of birth for the foreign-born population - Belgium (%)
Place of birth for the foreign-born population - France (%)
Place of birth for the foreign-born population - Germany (%)
Place of birth for the foreign-born population - Netherlands (%)
Place of birth for the foreign-born population - Switzerland (%)
Place of birth for the foreign-born population - Other Western Europe (%)
Place of birth for the foreign-born population - Greece (%)
Place of birth for the foreign-born population - Italy (%)
Place of birth for the foreign-born population - Portugal (%)
Place of birth for the foreign-born population - Spain (%)
Place of birth for the foreign-born population - Other Southern Europe (%)
Place of birth for the foreign-born population - Albania (%)
Place of birth for the foreign-born population - Belarus (%)
Place of birth for the foreign-born population - Bosnia and Herzegovina (%)
Place of birth for the foreign-born population - Bulgaria (%)
Place of birth for the foreign-born population - Croatia (%)
Place of birth for the foreign-born population - Czechoslovakia (%)
Place of birth for the foreign-born population - Hungary (%)
Place of birth for the foreign-born population - Latvia (%)
Place of birth for the foreign-born population - Lithuania (%)
Place of birth for the foreign-born population - North Macedonia (Macedonia) (%)
Place of birth for the foreign-born population - Moldova (%)
Place of birth for the foreign-born population - Poland (%)
Place of birth for the foreign-born population - Romania (%)
Place of birth for the foreign-born population - Russia (%)
Place of birth for the foreign-born population - Serbia (%)
Place of birth for the foreign-born population - Ukraine (%)
Place of birth for the foreign-born population - Other Eastern Europe (%)
Place of birth for the foreign-born population - China (%)
Place of birth for the foreign-born population - Hong Kong (%)
Place of birth for the foreign-born population - Taiwan (%)
Place of birth for the foreign-born population - Japan (%)
Place of birth for the foreign-born population - Korea (%)
Place of birth for the foreign-born population - Other Eastern Asia (%)
Place of birth for the foreign-born population - Afghanistan (%)
Place of birth for the foreign-born population - Bangladesh (%)
Place of birth for the foreign-born population - India (%)
Place of birth for the foreign-born population - Iran (%)
Place of birth for the foreign-born population - Kazakhstan (%)
Place of birth for the foreign-born population - Nepal (%)
Place of birth for the foreign-born population - Pakistan (%)
Place of birth for the foreign-born population - Sri Lanka (%)
Place of birth for the foreign-born population - Uzbekistan (%)
Place of birth for the foreign-born population - Other South Central Asia (%)
Place of birth for the foreign-born population - Burma (%)
Place of birth for the foreign-born population - Cambodia (%)
Place of birth for the foreign-born population - Indonesia (%)
Place of birth for the foreign-born population - Laos (%)
Place of birth for the foreign-born population - Malaysia (%)
Place of birth for the foreign-born population - Philippines (%)
Place of birth for the foreign-born population - Singapore (%)
Place of birth for the foreign-born population - Thailand (%)
Place of birth for the foreign-born population - Vietnam (%)
Place of birth for the foreign-born population - Other South Eastern Asia (%)
Place of birth for the foreign-born population - Armenia (%)
Place of birth for the foreign-born population - Iraq (%)
Place of birth for the foreign-born population - Israel (%)
Place of birth for the foreign-born population - Jordan (%)
Place of birth for the foreign-born population - Kuwait (%)
Place of birth for the foreign-born population - Lebanon (%)
Place of birth for the foreign-born population - Saudi Arabia (%)
Place of birth for the foreign-born population - Syria (%)
Place of birth for the foreign-born population - Turkey (%)
Place of birth for the foreign-born population - Yemen (%)
Place of birth for the foreign-born population - Other Western Asia (%)
Place of birth for the foreign-born population - Eritrea (%)
Place of birth for the foreign-born population - Ethiopia (%)
Place of birth for the foreign-born population - Kenya (%)
Place of birth for the foreign-born population - Somalia (%)
Place of birth for the foreign-born population - Uganda (%)
Place of birth for the foreign-born population - Zimbabwe (%)
Place of birth for the foreign-born population - Other Eastern Africa (%)
Place of birth for the foreign-born population - Cameroon (%)
Place of birth for the foreign-born population - Congo (%)
Place of birth for the foreign-born population - Democratic Republic of Congo (Zaire) (%)
Place of birth for the foreign-born population - Other Middle Africa (%)
Place of birth for the foreign-born population - Egypt (%)
Place of birth for the foreign-born population - Morocco (%)
Place of birth for the foreign-born population - Sudan (%)
Place of birth for the foreign-born population - Other Northern Africa (%)
Place of birth for the foreign-born population - South Africa (%)
Place of birth for the foreign-born population - Other Southern Africa (%)
Place of birth for the foreign-born population - Cabo Verde (%)
Place of birth for the foreign-born population - Ghana (%)
Place of birth for the foreign-born population - Liberia (%)
Place of birth for the foreign-born population - Nigeria (%)
Place of birth for the foreign-born population - Senegal (%)
Place of birth for the foreign-born population - Sierra Leone (%)
Place of birth for the foreign-born population - Other Western Africa (%)
Place of birth for the foreign-born population - Australia (%)
Place of birth for the foreign-born population - New Zealand (%)
Place of birth for the foreign-born population - Fiji (%)
Place of birth for the foreign-born population - Micronesia (%)
Place of birth for the foreign-born population - Bahamas (%)
Place of birth for the foreign-born population - Barbados (%)
Place of birth for the foreign-born population - Cuba (%)
Place of birth for the foreign-born population - Dominica (%)
Place of birth for the foreign-born population - Dominican Republic (%)
Place of birth for the foreign-born population - Grenada (%)
Place of birth for the foreign-born population - Haiti (%)
Place of birth for the foreign-born population - Jamaica (%)
Place of birth for the foreign-born population - St. Vincent and the Grenadines (%)
Place of birth for the foreign-born population - Trinidad and Tobago (%)
Place of birth for the foreign-born population - West Indies (%)
Place of birth for the foreign-born population - Other Caribbean (%)
Place of birth for the foreign-born population - Belize (%)
Place of birth for the foreign-born population - Costa Rica (%)
Place of birth for the foreign-born population - El Salvador (%)
Place of birth for the foreign-born population - Guatemala (%)
Place of birth for the foreign-born population - Honduras (%)
Place of birth for the foreign-born population - Mexico (%)
Place of birth for the foreign-born population - Nicaragua (%)
Place of birth for the foreign-born population - Panama (%)
Place of birth for the foreign-born population - Other Central America (%)
Place of birth for the foreign-born population - Argentina (%)
Place of birth for the foreign-born population - Bolivia (%)
Place of birth for the foreign-born population - Brazil (%)
Place of birth for the foreign-born population - Chile (%)
Place of birth for the foreign-born population - Colombia (%)
Place of birth for the foreign-born population - Ecuador (%)
Place of birth for the foreign-born population - Guyana (%)
Place of birth for the foreign-born population - Peru (%)
Place of birth for the foreign-born population - Uruguay (%)
Place of birth for the foreign-born population - Venezuela (%)
Place of birth for the foreign-born population - Other South America (%)
Place of birth for the foreign-born population - Canada (%)
Place of birth for the foreign-born population - Other Northern America (%)
Place of birth for the foreign-born population - Other (%)
Latest news about races in Edgewood, MD collected exclusively by city-data.com from local newspapers, TV, and radio stations
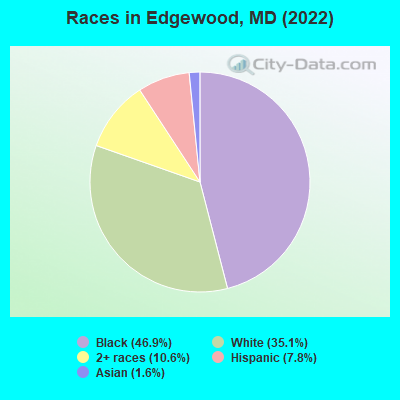
According to 2022 data, the most numerous races in Edgewood, MD are White alone (8,909 residents), Black alone (11,894 residents), and Hispanic (1,971 residents). 90.5% of Edgewood residents speak English at home. 5.5% of Edgewood, MD residents are foreign-born (1.6% born in Africa, 1.5% born in Latin America, 1.3% born in Europe, 0.8% born in Asia), which is 190.5% less than the foreign-born rate of 16.0% across the entire state of Maryland.
Race distribution in Edgewood
2000 2022
3,286,547 62.1% White alone 1,464,735 27.7% Black alone 227,916 4.3% Hispanic 209,738 4.0% Asian alone 82,946 1.6% Two or more races 13,312 0.3% American Indian alone 9,379 0.2% Other race alone 1,913 0.04% Native Hawaiian and Other
2,906,492 47.1% White alone 1,800,914 29.2% Black alone 705,842 11.4% Hispanic 401,818 6.5% Asian alone 291,317 4.7% Two or more races 46,930 0.8% Other race alone 8,930 0.1% American Indian alone 2,417 0.04% Native Hawaiian and Other
Income and house value in Edgewood Median household income in 2022 $70,414 White non-Hispanic householders$89,043 Black householders$97,747 Asian householders$111,188 Some other race householders$104,116 Two or more races householders$73,893 Hispanic or Latino race householdersMedian 2022 house value $246,348 White Non-Hispanic householders$228,153 Black or African American householders$155,613 American Indian or Alaska Native householders $283,695 Asian householders$246,109 Some other race householders$223,604 Two or more races householders$188,172 Hispanic or Latino householders
Median age by race in Edgewood
43.6 Median age for White residents42.4 44.0 35.0 Median age for Black or African American residents32.7 38.0 29.7 Median age for American Indian / Alaska Native residents-642,487,046.0 -676,818,950.3 63.2 Median age for Asian residents72.1 61.2 -763,333,332.6 Median age for Native Hawaiian / Pacific Islander residents-666,666,666.0 -760,942,760.2 37.0 Median age for Other race residents42.9 28.0 19.5 Median age for Two or more races residents14.4 23.9 43.5 Median age for White alone residents42.7 43.8 25.3 Median age for Hispanic or Latino residents20.6 28.4
Owner/renter occupied households by race in Edgewood
House owners and renters - White residents 3,142 66.8% Owner occupied1,560 33.2% Renter occupiedHouse owners and renters - Black or African American residents 2,840 72.6% Owner occupied1,073 27.4% Renter occupiedHouse owners and renters - American Indian / Alaska Native residents 36 100.0% Owner occupiedHouse owners and renters - Asian residents 177 87.2% Owner occupied26 12.8% Renter occupiedHouse owners and renters - Other race residents 235 100.0% Owner occupiedHouse owners and renters - Two or more races residents 736 96.9% Owner occupied23 3.1% Renter occupiedHouse owners and renters - White alone residents 3,029 67.1% Owner occupied1,483 32.9% Renter occupiedHouse owners and renters - Hispanic or Latino residents 521 88.2% Owner occupied70 11.8% Renter occupied
Language usage in Edgewood
English speakers - Total 90.5% of residents of Edgewood speak English at home.
5.3% of residents speak Spanish at home 849 67.2% Speak English very well415 32.8% Speak English less than very well4.1% of residents speak other language at home 764 78.1% Speak English very well214 21.9% Speak English less than very well
English speakers - Born in the United States 90.4% of residents of Edgewood speak English at home.
7.1% of residents speak Spanish at home 371 86.9% Speak English very well56 13.1% Speak English less than very well2.3% of residents speak other language at home 135 100.0% Speak English very well
English speakers - Native, born elsewhere 51.2% of residents of Edgewood speak English at home.
66.9% of residents speak Spanish at home 230 45.1% Speak English very well280 54.9% Speak English less than very well
English speakers - Foreign-born 53.5% of residents of Edgewood speak English at home.
10.0% of residents speak Spanish at home 87 56.5% Speak English very well67 43.5% Speak English less than very well37.1% of residents speak other language at home 362 63.3% Speak English very well210 36.7% Speak English less than very well
White (Caucasian) - Speak only English Native:
96.0% (8,446)Foreign-born:
52.3% (140)
White (Caucasian) - Speak another language Native:
4.0% (348)Foreign-born:
49.3% (132)
Black or African American - Speak only English Native:
98.1% (10,616)Foreign-born:
65.1% (379)
Black or African American - Speak another language Native:
1.7% (186)Foreign-born:
35.6% (207)
Asian - Speak another language Native:
42.8% (80)Foreign-born:
82.3% (181)
Other race - Speak another language Native:
90.9% (314)Foreign-born:
80.1% (125)
Two or more races - Speak only English Native:
82.3% (2,448)Foreign-born:
40.7% (33)
Two or more races - Speak another language Native:
18.1% (540)Foreign-born:
62.1% (51)
White alone - Speak only English Native:
98.6% (8,196)Foreign-born:
55.4% (164)
White alone - Speak another language Native:
1.2% (101)Foreign-born:
47.0% (139)
Hispanic or Latino - Speak only English Native:
48.8% (838)Foreign-born:
6.2% (10)
Hispanic or Latino - Speak another language Native:
46.0% (789)Foreign-born:
96.8% (163)
Foreign-born residents in Edgewood 1,398 residents are foreign born (1.6% Africa , 1.5% Latin America , 1.3% Europe , 0.8% Asia ).
This city:
5.5%Maryland:
15.7%
Marital status for residents in Edgewood Marital status - White (Caucasian) population 15 years and over
Males 38.1% Never married47.6% Now married3.4% Separated3.8% Widowed7.1% DivorcedFemales 32.2% Never married40.9% Now married0.9% Separated11.2% Widowed14.8% DivorcedWomen who gave birth in the past 12 months Now married:
69.3% (50)Unmarried:
30.7% (22)
Women who did not give birth in the past 12 months Now married:
34.6% (777)Unmarried:
65.4% (1,472)
Marital status - Black or African American population 15 years and over
Males 43.6% Never married40.6% Now married2.3% Separated3.3% Widowed10.2% DivorcedFemales 52.0% Never married32.7% Now married7.8% Separated1.6% Widowed5.8% DivorcedWomen who gave birth in the past 12 months Now married:
20.0% (21)Unmarried:
80.0% (84)
Women who did not give birth in the past 12 months Now married:
28.0% (819)Unmarried:
72.0% (2,110)
Marital status - American Indian / Alaska Native population 15 years and over
Males 0.0% Never married100.0% Now married0.0% Separated0.0% Widowed0.0% DivorcedFemales 0.0% Never married100.0% Now married0.0% Separated0.0% Widowed0.0% DivorcedWomen who did not give birth in the past 12 months Now married:
100.0% (27)Unmarried:
0.0% (0)
Marital status - Asian population 15 years and over
Males 55.6% Never married43.8% Now married0.0% Separated0.0% Widowed0.7% DivorcedFemales 13.6% Never married76.8% Now married0.0% Separated1.8% Widowed7.9% DivorcedWomen who did not give birth in the past 12 months Now married:
0.0% (0)Unmarried:
100.0% (49)
Marital status - Other race population 15 years and over
Males 0.0% Never married100.0% Now married0.0% Separated0.0% Widowed0.0% DivorcedFemales 32.8% Never married51.3% Now married0.0% Separated0.0% Widowed15.9% DivorcedWomen who did not give birth in the past 12 months Now married:
51.3% (122)Unmarried:
48.7% (115)
Marital status - Two or more races population 15 years and over
Males 50.7% Never married47.5% Now married1.8% Separated0.0% Widowed0.0% DivorcedFemales 50.7% Never married32.3% Now married0.0% Separated5.8% Widowed11.1% DivorcedWomen who gave birth in the past 12 months Now married:
100.0% (113)Unmarried:
0.0% (0)
Women who did not give birth in the past 12 months Now married:
17.6% (117)Unmarried:
82.4% (548)
Marital status - White alone, not Hispanic / Latino population 15 years and over
Males 38.0% Never married47.6% Now married3.7% Separated4.2% Widowed6.5% DivorcedFemales 32.0% Never married40.3% Now married0.9% Separated11.6% Widowed15.3% DivorcedWomen who gave birth in the past 12 months Now married:
69.3% (51)Unmarried:
30.7% (22)
Women who did not give birth in the past 12 months Now married:
33.7% (734)Unmarried:
66.3% (1,444)
Marital status - Hispanic or Latino population 15 years and over
Males 37.4% Never married54.9% Now married1.4% Separated0.0% Widowed6.3% DivorcedFemales 32.0% Never married37.7% Now married0.0% Separated9.2% Widowed21.1% DivorcedWomen who did not give birth in the past 12 months Now married:
47.5% (219)Unmarried:
52.5% (242)
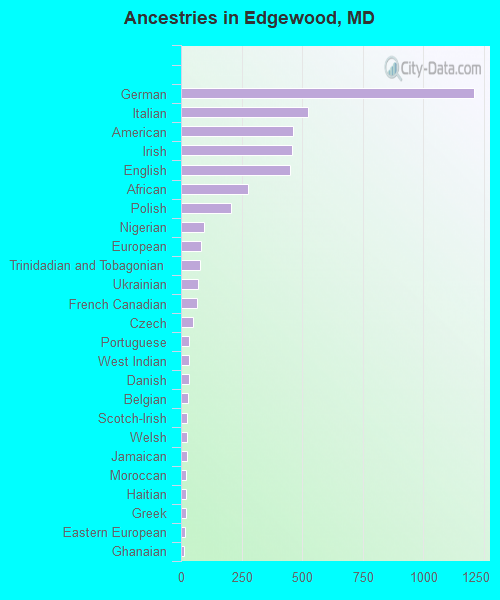
Ancestries in Edgewood
1,211 9.2% German523 4.0% Italian462 3.5% American459 3.5% Irish450 3.4% English277 2.1% African205 1.6% Polish94 0.7% Nigerian83 0.6% European77 0.6% Trinidadian and Tobagonian72 0.5% Ukrainian67 0.5% French Canadian49 0.4% Czech34 0.3% Portuguese33 0.2% West Indian32 0.2% Danish28 0.2% Belgian26 0.2% Scotch-Irish25 0.2% Welsh24 0.2% Jamaican22 0.2% Moroccan21 0.2% Haitian19 0.1% Greek17 0.1% Eastern European13 0.10% Ghanaian11 0.08% Croatian9 0.07% Dutch9 0.07% French8 0.06% Canadian3 0.02% British
Geographical mobility in Edgewood Same house 1 year ago 8,177 87.3% White (Caucasian)9,458 80.3% Black or African American37 39.6% American Indian / Alaska Native375 99.7% Asian526 93.8% Other race2,753 79.3% Two or more races7,882 88.6% White alone, not Hispanic / Latino1,559 81.9% Hispanic or LatinoMoved within same county 695 7.4% White / Caucasian1,026 8.7% Black or African American9 1.6% Other race186 5.4% Two or more races478 5.4% White alone, not Hispanic / Latino224 11.8% Hispanic or LatinoMoved within same state 379 4.0% White / Caucasian1,535 13.0% Black or African American37 6.7% Other race268 7.7% Two or more races382 4.3% White alone, not Hispanic / Latino39 2.0% Hispanic or LatinoMoved from different state 73 0.8% White / Caucasian32 0.3% Black or African American219 6.3% Two or more races76 0.9% White alone, not Hispanic / LatinoMoved from abroad 23 0.2% White48 0.4% Black or African American68 72.3% American Indian / Alaska Native25 0.3% White alone, not Hispanic / Latino44 2.3% Hispanic or Latino
Children Nativity (place of birth) in Edgewood
Children under 6 years - Living with two parents Both parents native 696 100.0% NativeBoth parents foreign-born 17 38.0% Native28 62.0% Foreign-bornOne native, one foreign-born parent 183 100.0% NativeChildren under 6 years - Living with one parent Native parent 808 100.0% NativeChildren 6 to 17 years - Living with two parents Both parents native 1,214 100.0% NativeBoth parents foreign-born 31 41.0% Native45 59.0% Foreign-bornOne native, one foreign-born parent 621 100.0% NativeChildren 6 to 17 years - Living with one parent Native parent 2,031 100.0% NativeForeign-born parent 35 31.1% Native77 68.9% Foreign-born
Grandparents responsible for own grandchildren in Edgewood
Grandparents (30 to 59 years) White / Caucasian 28 87.8% Responsible for grandchildren4 12.2% Not responsible for grandchildrenBlack or African American 107 65.3% Responsible for grandchildren57 34.7% Not responsible for grandchildrenWhite alone, not Hispanic / Latino 28 87.4% Responsible for grandchildren4 12.6% Not responsible for grandchildrenGrandparents (60 years and over) White / Caucasian 102 65.9% Responsible for grandchildren53 34.1% Not responsible for grandchildrenBlack or African American 49 73.3% Responsible for grandchildren18 26.7% Not responsible for grandchildrenWhite alone, not Hispanic / Latino 102 65.5% Responsible for grandchildren54 34.5% Not responsible for grandchildren