Races in El Mirage, Arizona (AZ) Detailed Stats
Data:
Races - White alone (%)
Races - White alone (% change since 2000)
Races - Black alone (%)
Races - Black alone (% change since 2000)
Races - American Indian alone (%)
Races - American Indian alone (% change since 2000)
Races - Asian alone (%)
Races - Asian alone (% change since 2000)
Races - Hispanic (%)
Races - Hispanic (% change since 2000)
Races - Native Hawaiian and Other Pacific Islander alone (%)
Races - Native Hawaiian and Other Pacific Islander alone (% change since 2000)
Races - Two or more races(%)
Races - Two or more races(% change since 2000)
Races - Other race alone (%)
Races - Other race alone (% change since 2000)
Racial diversity
Place of birth - Born in state of residence (%)
Place of birth - Born in state of residence (%) - White
Place of birth - Born in state of residence (%) - Black or African American
Place of birth - Born in state of residence (%) - Asian
Place of birth - Born in state of residence (%) - Hispanic or Latino
Place of birth - Born in state of residence (%) - American Indian and Alaska Native
Place of birth - Born in state of residence (%) - Multirace
Place of birth - Born in state of residence (%) - Other Race
Place of birth - Born in other state (%)
Place of birth - Born in other state (%) - White
Place of birth - Born in other state (%) - Black or African American
Place of birth - Born in other state (%) - Asian
Place of birth - Born in other state (%) - Hispanic or Latino
Place of birth - Born in other state (%) - American Indian and Alaska Native
Place of birth - Born in other state (%) - Multirace
Place of birth - Born in other state (%) - Other Race
Place of birth - Native, outside of US (%)
Place of birth - Native, outside of US (%) - White
Place of birth - Native, outside of US (%) - Black or African American
Place of birth - Native, outside of US (%) - Asian
Place of birth - Native, outside of US (%) - Hispanic or Latino
Place of birth - Native, outside of US (%) - American Indian and Alaska Native
Place of birth - Native, outside of US (%) - Multirace
Place of birth - Native, outside of US (%) - Other Race
Place of birth - Foreign born (%)
Place of birth - Foreign born (%) - White
Place of birth - Foreign born (%) - Black or African American
Place of birth - Foreign born (%) - Asian
Place of birth - Foreign born (%) - Hispanic or Latino
Place of birth - Foreign born (%) - American Indian and Alaska Native
Place of birth - Foreign born (%) - Multirace
Place of birth - Foreign born (%) - Other Race
Residents speaking English at home (%)
Residents speaking English at home - Born in the United States (%)
Residents speaking English at home - Native, born elsewhere (%)
Residents speaking English at home - Foreign born (%)
Residents speaking Spanish at home (%)
Residents speaking Spanish at home - Born in the United States (%)
Residents speaking Spanish at home - Native, born elsewhere (%)
Residents speaking Spanish at home - Foreign born (%)
Residents speaking other language at home (%)
Residents speaking other language at home - Born in the United States (%)
Residents speaking other language at home - Native, born elsewhere (%)
Residents speaking other language at home - Foreign born (%)
Marital status - Never married (%)
Marital status - Now married (%)
Marital status - Separated (%)
Marital status - Widowed (%)
Marital status - Divorced (%)
Ancestries Reported - Arab (%)
Ancestries Reported - Czech (%)
Ancestries Reported - Danish (%)
Ancestries Reported - Dutch (%)
Ancestries Reported - English (%)
Ancestries Reported - French (%)
Ancestries Reported - French Canadian (%)
Ancestries Reported - German (%)
Ancestries Reported - Greek (%)
Ancestries Reported - Hungarian (%)
Ancestries Reported - Irish (%)
Ancestries Reported - Italian (%)
Ancestries Reported - Lithuanian (%)
Ancestries Reported - Norwegian (%)
Ancestries Reported - Polish (%)
Ancestries Reported - Portuguese (%)
Ancestries Reported - Russian (%)
Ancestries Reported - Scotch-Irish (%)
Ancestries Reported - Scottish (%)
Ancestries Reported - Slovak (%)
Ancestries Reported - Subsaharan African (%)
Ancestries Reported - Swedish (%)
Ancestries Reported - Swiss (%)
Ancestries Reported - Ukrainian (%)
Ancestries Reported - United States (%)
Ancestries Reported - Welsh (%)
Ancestries Reported - West Indian (%)
Ancestries Reported - Other (%)
Geographical mobility - Same house 1 year ago (%)
Geographical mobility - Same house 1 year ago (%) - White
Geographical mobility - Same house 1 year ago (%) - Black or African American
Geographical mobility - Same house 1 year ago (%) - Asian
Geographical mobility - Same house 1 year ago (%) - Hispanic or Latino
Geographical mobility - Same house 1 year ago (%) - American Indian and Alaska Native
Geographical mobility - Same house 1 year ago (%) - Multirace
Geographical mobility - Same house 1 year ago (%) - Other Race
Geographical mobility - Moved within same county (%)
Geographical mobility - Moved within same county (%) - White
Geographical mobility - Moved within same county (%) - Black or African American
Geographical mobility - Moved within same county (%) - Asian
Geographical mobility - Moved within same county (%) - Hispanic or Latino
Geographical mobility - Moved within same county (%) - American Indian and Alaska Native
Geographical mobility - Moved within same county (%) - Multirace
Geographical mobility - Moved within same county (%) - Other Race
Geographical mobility - Moved from different county within same state (%)
Geographical mobility - Moved from different county within same state (%) - White
Geographical mobility - Moved from different county within same state (%) - Black or African American
Geographical mobility - Moved from different county within same state (%) - Asian
Geographical mobility - Moved from different county within same state (%) - Hispanic or Latino
Geographical mobility - Moved from different county within same state (%) - American Indian and Alaska Native
Geographical mobility - Moved from different county within same state (%) - Multirace
Geographical mobility - Moved from different county within same state (%) - Other Race
Geographical mobility - Moved from different state (%)
Geographical mobility - Moved from different state (%) - White
Geographical mobility - Moved from different state (%) - Black or African American
Geographical mobility - Moved from different state (%) - Asian
Geographical mobility - Moved from different state (%) - Hispanic or Latino
Geographical mobility - Moved from different state (%) - American Indian and Alaska Native
Geographical mobility - Moved from different state (%) - Multirace
Geographical mobility - Moved from different state (%) - Other Race
Geographical mobility - Moved from abroad (%)
Geographical mobility - Moved from abroad (%) - White
Geographical mobility - Moved from abroad (%) - Black or African American
Geographical mobility - Moved from abroad (%) - Asian
Geographical mobility - Moved from abroad (%) - Hispanic or Latino
Geographical mobility - Moved from abroad (%) - American Indian and Alaska Native
Geographical mobility - Moved from abroad (%) - Multirace
Geographical mobility - Moved from abroad (%) - Other Race
Place of birth for the foreign-born population - Ireland (%)
Place of birth for the foreign-born population - Denmark (%)
Place of birth for the foreign-born population - Norway (%)
Place of birth for the foreign-born population - Sweden (%)
Place of birth for the foreign-born population - United Kingdom (%)
Place of birth for the foreign-born population - England (%)
Place of birth for the foreign-born population - Scotland (%)
Place of birth for the foreign-born population - Other Northern Europe (%)
Place of birth for the foreign-born population - Austria (%)
Place of birth for the foreign-born population - Belgium (%)
Place of birth for the foreign-born population - France (%)
Place of birth for the foreign-born population - Germany (%)
Place of birth for the foreign-born population - Netherlands (%)
Place of birth for the foreign-born population - Switzerland (%)
Place of birth for the foreign-born population - Other Western Europe (%)
Place of birth for the foreign-born population - Greece (%)
Place of birth for the foreign-born population - Italy (%)
Place of birth for the foreign-born population - Portugal (%)
Place of birth for the foreign-born population - Spain (%)
Place of birth for the foreign-born population - Other Southern Europe (%)
Place of birth for the foreign-born population - Albania (%)
Place of birth for the foreign-born population - Belarus (%)
Place of birth for the foreign-born population - Bosnia and Herzegovina (%)
Place of birth for the foreign-born population - Bulgaria (%)
Place of birth for the foreign-born population - Croatia (%)
Place of birth for the foreign-born population - Czechoslovakia (%)
Place of birth for the foreign-born population - Hungary (%)
Place of birth for the foreign-born population - Latvia (%)
Place of birth for the foreign-born population - Lithuania (%)
Place of birth for the foreign-born population - North Macedonia (Macedonia) (%)
Place of birth for the foreign-born population - Moldova (%)
Place of birth for the foreign-born population - Poland (%)
Place of birth for the foreign-born population - Romania (%)
Place of birth for the foreign-born population - Russia (%)
Place of birth for the foreign-born population - Serbia (%)
Place of birth for the foreign-born population - Ukraine (%)
Place of birth for the foreign-born population - Other Eastern Europe (%)
Place of birth for the foreign-born population - China (%)
Place of birth for the foreign-born population - Hong Kong (%)
Place of birth for the foreign-born population - Taiwan (%)
Place of birth for the foreign-born population - Japan (%)
Place of birth for the foreign-born population - Korea (%)
Place of birth for the foreign-born population - Other Eastern Asia (%)
Place of birth for the foreign-born population - Afghanistan (%)
Place of birth for the foreign-born population - Bangladesh (%)
Place of birth for the foreign-born population - India (%)
Place of birth for the foreign-born population - Iran (%)
Place of birth for the foreign-born population - Kazakhstan (%)
Place of birth for the foreign-born population - Nepal (%)
Place of birth for the foreign-born population - Pakistan (%)
Place of birth for the foreign-born population - Sri Lanka (%)
Place of birth for the foreign-born population - Uzbekistan (%)
Place of birth for the foreign-born population - Other South Central Asia (%)
Place of birth for the foreign-born population - Burma (%)
Place of birth for the foreign-born population - Cambodia (%)
Place of birth for the foreign-born population - Indonesia (%)
Place of birth for the foreign-born population - Laos (%)
Place of birth for the foreign-born population - Malaysia (%)
Place of birth for the foreign-born population - Philippines (%)
Place of birth for the foreign-born population - Singapore (%)
Place of birth for the foreign-born population - Thailand (%)
Place of birth for the foreign-born population - Vietnam (%)
Place of birth for the foreign-born population - Other South Eastern Asia (%)
Place of birth for the foreign-born population - Armenia (%)
Place of birth for the foreign-born population - Iraq (%)
Place of birth for the foreign-born population - Israel (%)
Place of birth for the foreign-born population - Jordan (%)
Place of birth for the foreign-born population - Kuwait (%)
Place of birth for the foreign-born population - Lebanon (%)
Place of birth for the foreign-born population - Saudi Arabia (%)
Place of birth for the foreign-born population - Syria (%)
Place of birth for the foreign-born population - Turkey (%)
Place of birth for the foreign-born population - Yemen (%)
Place of birth for the foreign-born population - Other Western Asia (%)
Place of birth for the foreign-born population - Eritrea (%)
Place of birth for the foreign-born population - Ethiopia (%)
Place of birth for the foreign-born population - Kenya (%)
Place of birth for the foreign-born population - Somalia (%)
Place of birth for the foreign-born population - Uganda (%)
Place of birth for the foreign-born population - Zimbabwe (%)
Place of birth for the foreign-born population - Other Eastern Africa (%)
Place of birth for the foreign-born population - Cameroon (%)
Place of birth for the foreign-born population - Congo (%)
Place of birth for the foreign-born population - Democratic Republic of Congo (Zaire) (%)
Place of birth for the foreign-born population - Other Middle Africa (%)
Place of birth for the foreign-born population - Egypt (%)
Place of birth for the foreign-born population - Morocco (%)
Place of birth for the foreign-born population - Sudan (%)
Place of birth for the foreign-born population - Other Northern Africa (%)
Place of birth for the foreign-born population - South Africa (%)
Place of birth for the foreign-born population - Other Southern Africa (%)
Place of birth for the foreign-born population - Cabo Verde (%)
Place of birth for the foreign-born population - Ghana (%)
Place of birth for the foreign-born population - Liberia (%)
Place of birth for the foreign-born population - Nigeria (%)
Place of birth for the foreign-born population - Senegal (%)
Place of birth for the foreign-born population - Sierra Leone (%)
Place of birth for the foreign-born population - Other Western Africa (%)
Place of birth for the foreign-born population - Australia (%)
Place of birth for the foreign-born population - New Zealand (%)
Place of birth for the foreign-born population - Fiji (%)
Place of birth for the foreign-born population - Micronesia (%)
Place of birth for the foreign-born population - Bahamas (%)
Place of birth for the foreign-born population - Barbados (%)
Place of birth for the foreign-born population - Cuba (%)
Place of birth for the foreign-born population - Dominica (%)
Place of birth for the foreign-born population - Dominican Republic (%)
Place of birth for the foreign-born population - Grenada (%)
Place of birth for the foreign-born population - Haiti (%)
Place of birth for the foreign-born population - Jamaica (%)
Place of birth for the foreign-born population - St. Vincent and the Grenadines (%)
Place of birth for the foreign-born population - Trinidad and Tobago (%)
Place of birth for the foreign-born population - West Indies (%)
Place of birth for the foreign-born population - Other Caribbean (%)
Place of birth for the foreign-born population - Belize (%)
Place of birth for the foreign-born population - Costa Rica (%)
Place of birth for the foreign-born population - El Salvador (%)
Place of birth for the foreign-born population - Guatemala (%)
Place of birth for the foreign-born population - Honduras (%)
Place of birth for the foreign-born population - Mexico (%)
Place of birth for the foreign-born population - Nicaragua (%)
Place of birth for the foreign-born population - Panama (%)
Place of birth for the foreign-born population - Other Central America (%)
Place of birth for the foreign-born population - Argentina (%)
Place of birth for the foreign-born population - Bolivia (%)
Place of birth for the foreign-born population - Brazil (%)
Place of birth for the foreign-born population - Chile (%)
Place of birth for the foreign-born population - Colombia (%)
Place of birth for the foreign-born population - Ecuador (%)
Place of birth for the foreign-born population - Guyana (%)
Place of birth for the foreign-born population - Peru (%)
Place of birth for the foreign-born population - Uruguay (%)
Place of birth for the foreign-born population - Venezuela (%)
Place of birth for the foreign-born population - Other South America (%)
Place of birth for the foreign-born population - Canada (%)
Place of birth for the foreign-born population - Other Northern America (%)
Place of birth for the foreign-born population - Other (%)
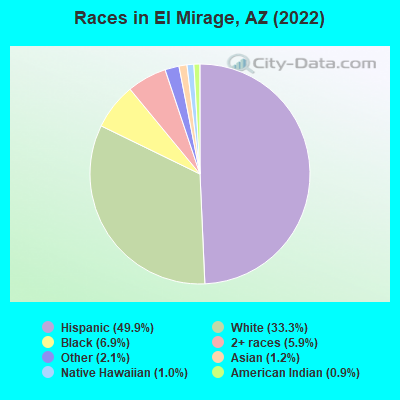
According to 2022 data, the most numerous races in El Mirage, AZ are White alone (14,315 residents), Hispanic (18,204 residents), and Black alone (3,136 residents). 67.0% of El Mirage residents speak English at home. 12.6% of El Mirage, AZ residents are foreign-born (9.0% born in Latin America, 1.8% born in Asia), which is 3.3% less than the foreign-born rate of 13.0% across the entire state of Arizona.
Race distribution in El Mirage
2000 2022
3,274,258 63.8% White alone 1,295,617 25.3% Hispanic 233,370 4.5% American Indian alone 149,941 2.9% Black alone 89,315 1.7% Asian alone 76,372 1.5% Two or more races 6,120 0.1% Other race alone 5,639 0.1% Native Hawaiian and Other
3,814,587 51.8% White alone 2,388,520 32.5% Hispanic 322,459 4.4% Black alone 284,994 3.9% Two or more races 257,020 3.5% Asian alone 241,688 3.3% American Indian alone 36,042 0.5% Other race alone 13,887 0.2% Native Hawaiian and Other
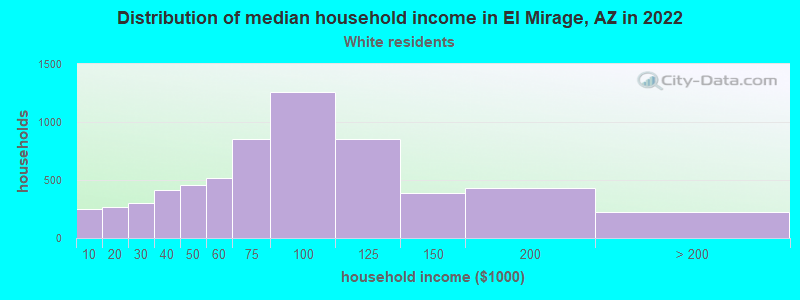
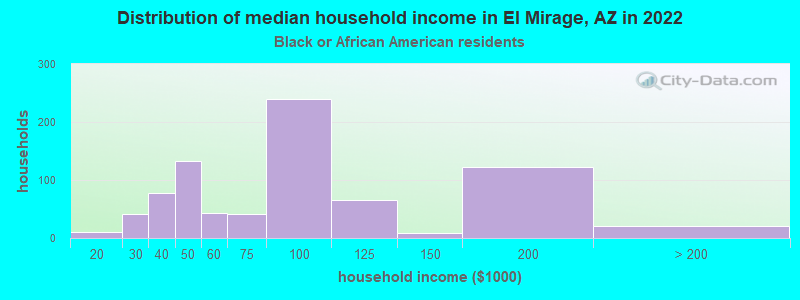
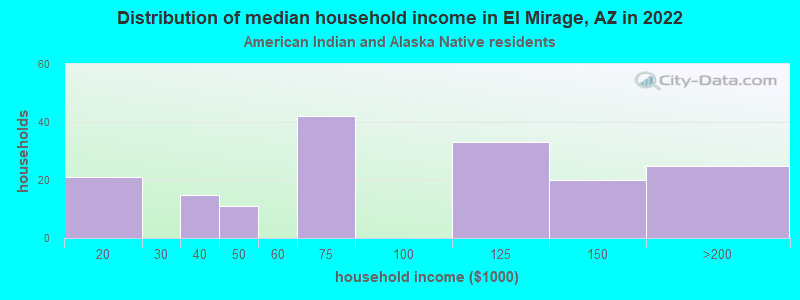
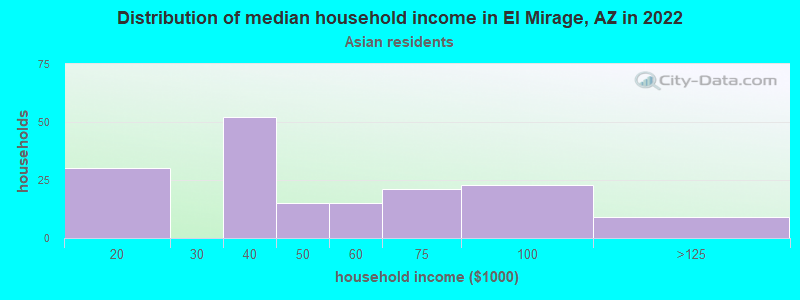
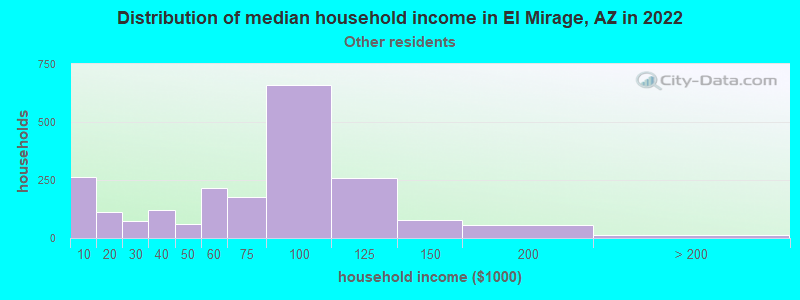
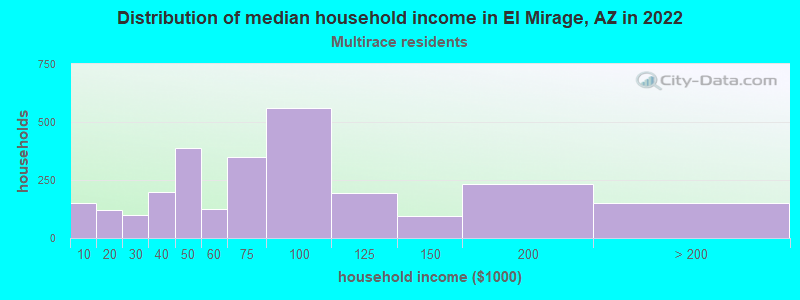
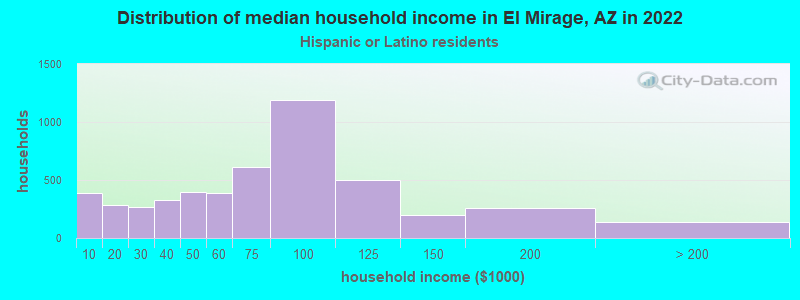
Income and house value in El Mirage Median household income in 2022 $78,887 White non-Hispanic householders$64,862 Black householders$56,477 American Indian and Alaska Native householders$64,647 Asian householders$54,488 Native Hawaiian and other Pacific Islander householders$92,297 Some other race householders$121,794 Two or more races householders$77,514 Hispanic or Latino race householdersMedian 2022 house value $376,290 White Non-Hispanic householders$247,791 Black or African American householders$349,780 American Indian or Alaska Native householders $276,142 Asian householders$466,865 Native Hawaiian and other Pacific Islander householders$251,473 Some other race householders$444,773 Two or more races householders$270,619 Hispanic or Latino householders
Median age by race in El Mirage
33.8 Median age for White residents31.8 35.1 27.3 Median age for Black or African American residents21.1 32.9 38.6 Median age for American Indian / Alaska Native residents35.6 42.8 52.7 Median age for Asian residents45.1 52.0 26.3 Median age for Native Hawaiian / Pacific Islander residents24.8 29.7 36.7 Median age for Other race residents38.4 35.6 21.5 Median age for Two or more races residents21.0 22.6 37.5 Median age for White alone residents36.3 40.7 28.0 Median age for Hispanic or Latino residents26.2 29.1
Owner/renter occupied households by race in El Mirage
House owners and renters - White residents 5,486 66.0% Owner occupied2,830 34.0% Renter occupiedHouse owners and renters - Black or African American residents 799 76.2% Owner occupied249 23.8% Renter occupiedHouse owners and renters - American Indian / Alaska Native residents 117 68.2% Owner occupied55 31.8% Renter occupiedHouse owners and renters - Asian residents 130 62.8% Owner occupied77 37.2% Renter occupiedHouse owners and renters - Native Hawaiian / Pacific Islander residents 21 41.7% Owner occupied30 58.3% Renter occupiedHouse owners and renters - Other race residents 664 78.4% Owner occupied183 21.6% Renter occupiedHouse owners and renters - Two or more races residents 705 73.8% Owner occupied251 26.2% Renter occupiedHouse owners and renters - White alone residents 3,976 72.5% Owner occupied1,511 27.5% Renter occupiedHouse owners and renters - Hispanic or Latino residents 2,981 59.8% Owner occupied2,006 40.2% Renter occupied
Language usage in El Mirage
English speakers - Total 67.0% of residents of El Mirage speak English at home.
29.0% of residents speak Spanish at home 7,120 73.9% Speak English very well2,520 26.1% Speak English less than very well3.8% of residents speak other language at home 835 65.3% Speak English very well443 34.7% Speak English less than very well
English speakers - Born in the United States 80.6% of residents of El Mirage speak English at home.
17.9% of residents speak Spanish at home 2,330 93.2% Speak English very well169 6.8% Speak English less than very well1.6% of residents speak other language at home 220 100.0% Speak English very well
English speakers - Native, born elsewhere 46.7% of residents of El Mirage speak English at home.
43.9% of residents speak Spanish at home 293 89.9% Speak English very well33 10.1% Speak English less than very well8.6% of residents speak other language at home 57 89.1% Speak English very well7 10.9% Speak English less than very well
English speakers - Foreign-born 20.1% of residents of El Mirage speak English at home.
62.9% of residents speak Spanish at home 1,207 42.3% Speak English very well1,647 57.7% Speak English less than very well17.0% of residents speak other language at home 409 52.9% Speak English very well364 47.1% Speak English less than very well
White (Caucasian) - Speak only English Native:
76.8% (15,593)Foreign-born:
25.8% (553)
White (Caucasian) - Speak another language Native:
19.6% (3,980)Foreign-born:
74.2% (1,594)
Black or African American - Speak only English Native:
99.4% (3,024)Foreign-born:
78.3% (353)
Black or African American - Speak another language Native:
1.0% (31)Foreign-born:
34.6% (156)
American Indian / Alaska Native - Speak another language Native:
17.6% (62)Foreign-born:
93.1% (13)
Asian - Speak only English Native:
70.4% (160)Foreign-born:
24.9% (100)
Asian - Speak another language Native:
29.6% (67)Foreign-born:
76.2% (306)
Other race - Speak only English Native:
39.8% (818)Foreign-born:
3.1% (19)
Other race - Speak another language Native:
58.9% (1,211)Foreign-born:
92.9% (575)
Two or more races - Speak only English Native:
64.5% (2,910)Foreign-born:
14.8% (66)
Two or more races - Speak another language Native:
34.7% (1,564)Foreign-born:
56.8% (253)
White alone - Speak only English Native:
94.3% (11,859)Foreign-born:
49.5% (424)
White alone - Speak another language Native:
5.5% (689)Foreign-born:
50.3% (431)
Hispanic or Latino - Speak only English Native:
50.6% (6,932)Foreign-born:
10.5% (323)
Hispanic or Latino - Speak another language Native:
49.4% (6,779)Foreign-born:
90.3% (2,782)
Foreign-born residents in El Mirage 4,687 residents are foreign born (9.0% Latin America , 1.8% Asia ).
This city:
12.6%Arizona:
100.0%
Marital status for residents in El Mirage Marital status - White (Caucasian) population 15 years and over
Males 40.1% Never married45.3% Now married1.2% Separated1.7% Widowed11.7% DivorcedFemales 27.8% Never married44.4% Now married3.2% Separated7.1% Widowed17.5% DivorcedWomen who gave birth in the past 12 months Now married:
79.2% (238)Unmarried:
20.8% (62)
Women who did not give birth in the past 12 months Now married:
46.0% (2,528)Unmarried:
54.0% (2,970)
Marital status - Black or African American population 15 years and over
Males 40.2% Never married46.4% Now married0.0% Separated0.8% Widowed12.7% DivorcedFemales 35.3% Never married41.7% Now married0.9% Separated6.6% Widowed15.5% DivorcedWomen who gave birth in the past 12 months Now married:
100.0% (31)Unmarried:
0.0% (0)
Women who did not give birth in the past 12 months Now married:
44.3% (412)Unmarried:
55.7% (519)
Marital status - American Indian / Alaska Native population 15 years and over
Males 41.7% Never married58.3% Now married0.0% Separated0.0% Widowed0.0% DivorcedFemales 28.4% Never married23.9% Now married6.2% Separated10.8% Widowed30.7% DivorcedWomen who did not give birth in the past 12 months Now married:
34.7% (35)Unmarried:
65.3% (67)
Marital status - Asian population 15 years and over
Males 41.9% Never married36.8% Now married0.0% Separated0.0% Widowed21.3% DivorcedFemales 14.3% Never married55.8% Now married3.6% Separated24.8% Widowed1.5% DivorcedWomen who gave birth in the past 12 months Now married:
0.0% (0)Unmarried:
100.0% (9)
Women who did not give birth in the past 12 months Now married:
48.0% (100)Unmarried:
52.0% (108)
Marital status - Native Hawaiian / Pacific Islander population 15 years and over
Males 68.8% Never married31.3% Now married0.0% Separated0.0% Widowed0.0% DivorcedFemales 51.3% Never married26.3% Now married0.0% Separated10.5% Widowed11.8% DivorcedWomen who did not give birth in the past 12 months Now married:
29.4% (19)Unmarried:
70.6% (47)
Marital status - Other race population 15 years and over
Males 39.5% Never married49.5% Now married0.0% Separated0.0% Widowed10.9% DivorcedFemales 42.4% Never married37.7% Now married4.1% Separated4.4% Widowed11.5% DivorcedWomen who gave birth in the past 12 months Now married:
100.0% (10)Unmarried:
0.0% (0)
Women who did not give birth in the past 12 months Now married:
38.8% (349)Unmarried:
61.2% (550)
Marital status - Two or more races population 15 years and over
Males 76.5% Never married13.0% Now married0.0% Separated3.8% Widowed6.6% DivorcedFemales 65.4% Never married12.3% Now married0.0% Separated4.6% Widowed17.6% DivorcedWomen who did not give birth in the past 12 months Now married:
14.5% (162)Unmarried:
85.5% (950)
Marital status - White alone, not Hispanic / Latino population 15 years and over
Males 34.9% Never married46.8% Now married1.6% Separated1.9% Widowed14.8% DivorcedFemales 24.4% Never married43.2% Now married2.2% Separated9.2% Widowed21.0% DivorcedWomen who gave birth in the past 12 months Now married:
71.1% (156)Unmarried:
28.9% (63)
Women who did not give birth in the past 12 months Now married:
43.3% (1,283)Unmarried:
56.7% (1,681)
Marital status - Hispanic or Latino population 15 years and over
Males 45.5% Never married43.8% Now married0.5% Separated1.3% Widowed8.9% DivorcedFemales 35.9% Never married43.0% Now married4.2% Separated4.6% Widowed12.3% DivorcedWomen who gave birth in the past 12 months Now married:
95.9% (129)Unmarried:
4.1% (5)
Women who did not give birth in the past 12 months Now married:
45.4% (2,216)Unmarried:
54.6% (2,667)
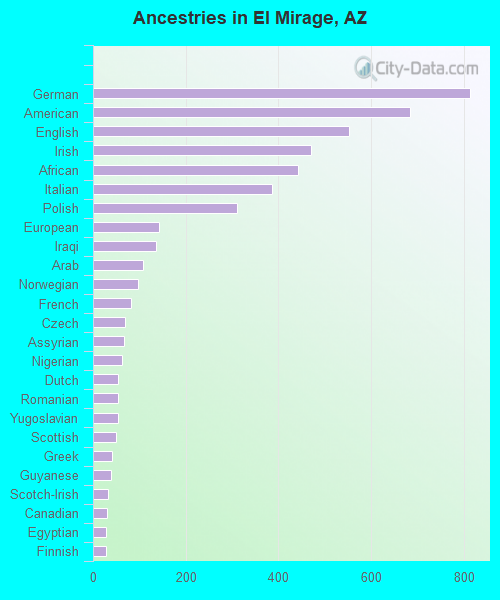
Ancestries in El Mirage
1,892 8.7% American738 3.4% German495 2.3% Irish478 2.2% English472 2.2% African390 1.8% Italian307 1.4% Assyrian203 0.9% Norwegian189 0.9% European174 0.8% Albanian167 0.8% Nigerian135 0.6% Polish90 0.4% French90 0.4% Brazilian89 0.4% Canadian76 0.4% Dutch68 0.3% Iraqi57 0.3% Yugoslavian55 0.3% Scottish40 0.2% Arab37 0.2% Greek32 0.1% Czech25 0.1% British25 0.1% French Canadian24 0.1% Lithuanian23 0.1% Eastern European23 0.1% Scotch-Irish23 0.1% West Indian23 0.1% Swedish16 0.07% Icelander14 0.06% Guyanese14 0.06% Haitian13 0.06% Hungarian10 0.05% Northern European10 0.05% Welsh8 0.04% Scandinavian5 0.02% Portuguese4 0.02% Finnish4 0.02% Romanian4 0.02% Russian4 0.02% Swiss
Geographical mobility in El Mirage Same house 1 year ago 22,523 93.1% White (Caucasian)3,291 86.9% Black or African American337 88.5% American Indian / Alaska Native526 81.6% Asian104 81.4% Native Hawaiian / Pacific Islander2,300 88.1% Other race4,735 87.2% Two or more races12,535 90.4% White alone, not Hispanic / Latino15,783 92.0% Hispanic or LatinoMoved within same county 1,482 6.1% White / Caucasian415 11.0% Black or African American17 4.6% American Indian / Alaska Native27 4.2% Asian250 9.6% Other race552 10.2% Two or more races904 6.5% White alone, not Hispanic / Latino1,270 7.4% Hispanic or LatinoMoved within same state 100 0.4% White / Caucasian34 9.1% American Indian / Alaska Native29 0.5% Two or more races100 0.7% White alone, not Hispanic / Latino28 0.2% Hispanic or LatinoMoved from different state 358 1.5% White / Caucasian118 3.1% Black or African American72 11.2% Asian7 5.7% Native Hawaiian / Pacific Islander49 1.9% Other race130 2.4% Two or more races379 2.7% White alone, not Hispanic / Latino217 1.3% Hispanic or LatinoMoved from abroad 37 0.2% White40 0.3% White alone, not Hispanic / Latino9 0.1% Hispanic or Latino
Children Nativity (place of birth) in El Mirage
Children under 6 years - Living with two parents Both parents native 1,249 100.0% NativeBoth parents foreign-born 135 100.0% NativeOne native, one foreign-born parent 439 100.0% NativeChildren under 6 years - Living with one parent Native parent 1,031 99.3% Native7 0.7% Foreign-bornForeign-born parent 80 100.0% NativeChildren 6 to 17 years - Living with two parents Both parents native 2,163 100.0% NativeBoth parents foreign-born 736 89.6% Native86 10.4% Foreign-bornOne native, one foreign-born parent 907 97.7% Native21 2.3% Foreign-bornChildren 6 to 17 years - Living with one parent Native parent 2,714 100.0% NativeForeign-born parent 488 52.4% Native443 47.6% Foreign-born
Grandparents responsible for own grandchildren in El Mirage
Grandparents (30 to 59 years) White / Caucasian 109 48.3% Responsible for grandchildren116 51.7% Not responsible for grandchildrenBlack or African American 22 26.6% Responsible for grandchildren59 73.4% Not responsible for grandchildrenAmerican Indian / Alaska Native 5 100.0% Not responsible for grandchildrenAsian 13 100.0% Not responsible for grandchildrenNative Hawaiian / Pacific Islander 16 100.0% Not responsible for grandchildrenOther race 11 100.0% Not responsible for grandchildrenTwo or more races 195 100.0% Not responsible for grandchildrenWhite alone, not Hispanic / Latino 85 45.4% Responsible for grandchildren102 54.6% Not responsible for grandchildrenHispanic or Latino 32 23.5% Responsible for grandchildren105 76.5% Not responsible for grandchildrenGrandparents (60 years and over) White / Caucasian 68 22.2% Responsible for grandchildren239 77.8% Not responsible for grandchildrenBlack or African American 5 11.7% Responsible for grandchildren40 88.3% Not responsible for grandchildrenAmerican Indian / Alaska Native 10 100.0% Responsible for grandchildrenAsian 12 100.0% Responsible for grandchildrenNative Hawaiian / Pacific Islander 21 100.0% Not responsible for grandchildrenOther race 1 1.7% Responsible for grandchildren85 98.3% Not responsible for grandchildrenTwo or more races 47 100.0% Responsible for grandchildrenWhite alone, not Hispanic / Latino 64 32.7% Responsible for grandchildren132 67.3% Not responsible for grandchildrenHispanic or Latino 35 13.9% Responsible for grandchildren215 86.1% Not responsible for grandchildren