Races in Folcroft, Pennsylvania (PA) Detailed Stats
Data:
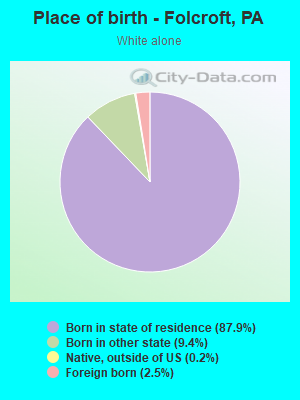
Races - White alone (%)
Races - White alone (% change since 2000)
Races - Black alone (%)
Races - Black alone (% change since 2000)
Races - American Indian alone (%)
Races - American Indian alone (% change since 2000)
Races - Asian alone (%)
Races - Asian alone (% change since 2000)
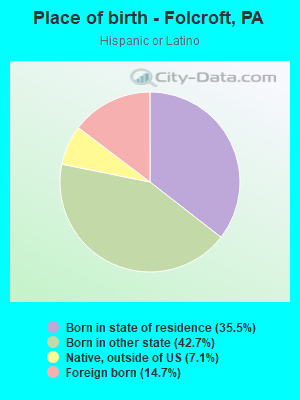
Races - Hispanic (%)
Races - Hispanic (% change since 2000)
Races - Native Hawaiian and Other Pacific Islander alone (%)
Races - Native Hawaiian and Other Pacific Islander alone (% change since 2000)
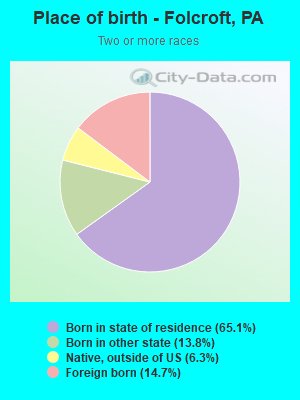
Races - Two or more races(%)
Races - Two or more races(% change since 2000)
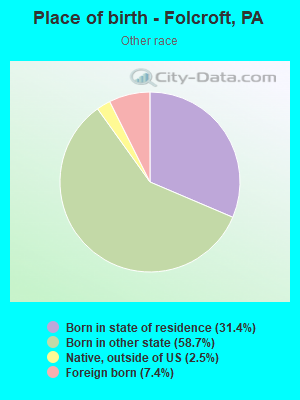
Races - Other race alone (%)
Races - Other race alone (% change since 2000)
Racial diversity
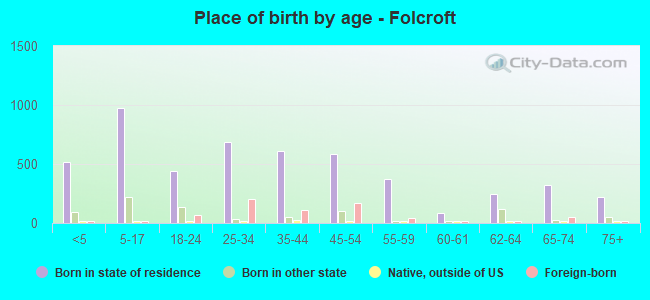
Place of birth - Born in state of residence (%)
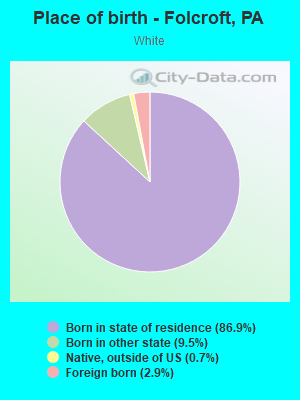
Place of birth - Born in state of residence (%) - White
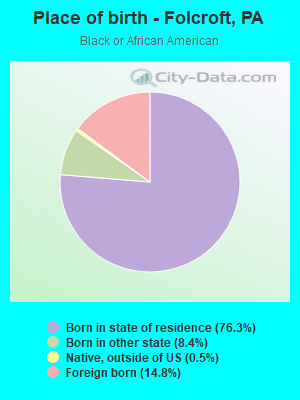
Place of birth - Born in state of residence (%) - Black or African American
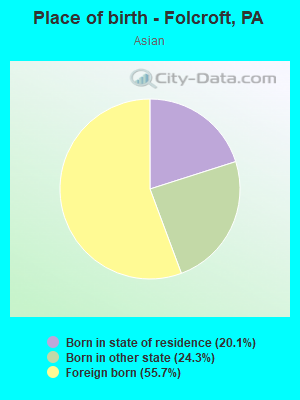
Place of birth - Born in state of residence (%) - Asian
Place of birth - Born in state of residence (%) - Hispanic or Latino
Place of birth - Born in state of residence (%) - American Indian and Alaska Native
Place of birth - Born in state of residence (%) - Multirace
Place of birth - Born in state of residence (%) - Other Race
Place of birth - Born in other state (%)
Place of birth - Born in other state (%) - White
Place of birth - Born in other state (%) - Black or African American
Place of birth - Born in other state (%) - Asian
Place of birth - Born in other state (%) - Hispanic or Latino
Place of birth - Born in other state (%) - American Indian and Alaska Native
Place of birth - Born in other state (%) - Multirace
Place of birth - Born in other state (%) - Other Race
Place of birth - Native, outside of US (%)
Place of birth - Native, outside of US (%) - White
Place of birth - Native, outside of US (%) - Black or African American
Place of birth - Native, outside of US (%) - Asian
Place of birth - Native, outside of US (%) - Hispanic or Latino
Place of birth - Native, outside of US (%) - American Indian and Alaska Native
Place of birth - Native, outside of US (%) - Multirace
Place of birth - Native, outside of US (%) - Other Race
Place of birth - Foreign born (%)
Place of birth - Foreign born (%) - White
Place of birth - Foreign born (%) - Black or African American
Place of birth - Foreign born (%) - Asian
Place of birth - Foreign born (%) - Hispanic or Latino
Place of birth - Foreign born (%) - American Indian and Alaska Native
Place of birth - Foreign born (%) - Multirace
Place of birth - Foreign born (%) - Other Race
Residents speaking English at home (%)
Residents speaking English at home - Born in the United States (%)
Residents speaking English at home - Native, born elsewhere (%)
Residents speaking English at home - Foreign born (%)
Residents speaking Spanish at home (%)
Residents speaking Spanish at home - Born in the United States (%)
Residents speaking Spanish at home - Native, born elsewhere (%)
Residents speaking Spanish at home - Foreign born (%)
Residents speaking other language at home (%)
Residents speaking other language at home - Born in the United States (%)
Residents speaking other language at home - Native, born elsewhere (%)
Residents speaking other language at home - Foreign born (%)
Marital status - Never married (%)
Marital status - Now married (%)
Marital status - Separated (%)
Marital status - Widowed (%)
Marital status - Divorced (%)
Ancestries Reported - Arab (%)
Ancestries Reported - Czech (%)
Ancestries Reported - Danish (%)
Ancestries Reported - Dutch (%)
Ancestries Reported - English (%)
Ancestries Reported - French (%)
Ancestries Reported - French Canadian (%)
Ancestries Reported - German (%)
Ancestries Reported - Greek (%)
Ancestries Reported - Hungarian (%)
Ancestries Reported - Irish (%)
Ancestries Reported - Italian (%)
Ancestries Reported - Lithuanian (%)
Ancestries Reported - Norwegian (%)
Ancestries Reported - Polish (%)
Ancestries Reported - Portuguese (%)
Ancestries Reported - Russian (%)
Ancestries Reported - Scotch-Irish (%)
Ancestries Reported - Scottish (%)
Ancestries Reported - Slovak (%)
Ancestries Reported - Subsaharan African (%)
Ancestries Reported - Swedish (%)
Ancestries Reported - Swiss (%)
Ancestries Reported - Ukrainian (%)
Ancestries Reported - United States (%)
Ancestries Reported - Welsh (%)
Ancestries Reported - West Indian (%)
Ancestries Reported - Other (%)
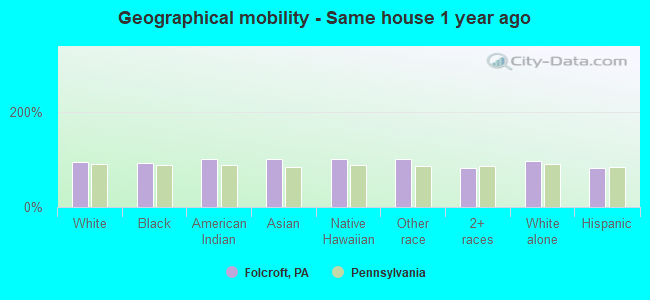
Geographical mobility - Same house 1 year ago (%)
Geographical mobility - Same house 1 year ago (%) - White
Geographical mobility - Same house 1 year ago (%) - Black or African American
Geographical mobility - Same house 1 year ago (%) - Asian
Geographical mobility - Same house 1 year ago (%) - Hispanic or Latino
Geographical mobility - Same house 1 year ago (%) - American Indian and Alaska Native
Geographical mobility - Same house 1 year ago (%) - Multirace
Geographical mobility - Same house 1 year ago (%) - Other Race
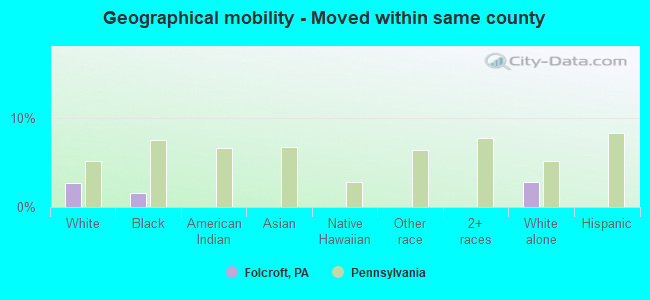
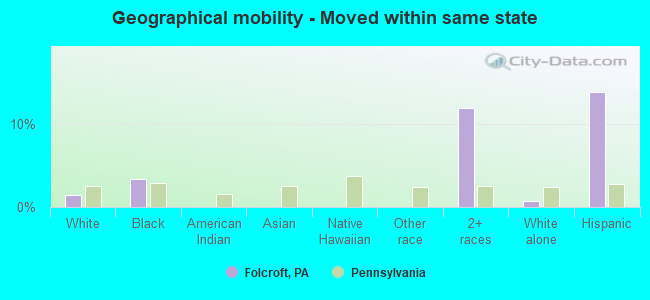
Geographical mobility - Moved within same county (%)
Geographical mobility - Moved within same county (%) - White
Geographical mobility - Moved within same county (%) - Black or African American
Geographical mobility - Moved within same county (%) - Asian
Geographical mobility - Moved within same county (%) - Hispanic or Latino
Geographical mobility - Moved within same county (%) - American Indian and Alaska Native
Geographical mobility - Moved within same county (%) - Multirace
Geographical mobility - Moved within same county (%) - Other Race
Geographical mobility - Moved from different county within same state (%)
Geographical mobility - Moved from different county within same state (%) - White
Geographical mobility - Moved from different county within same state (%) - Black or African American
Geographical mobility - Moved from different county within same state (%) - Asian
Geographical mobility - Moved from different county within same state (%) - Hispanic or Latino
Geographical mobility - Moved from different county within same state (%) - American Indian and Alaska Native
Geographical mobility - Moved from different county within same state (%) - Multirace
Geographical mobility - Moved from different county within same state (%) - Other Race
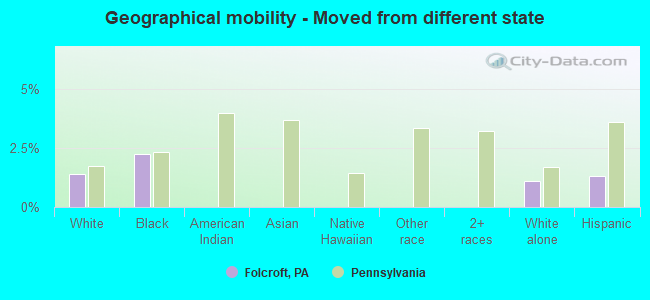
Geographical mobility - Moved from different state (%)
Geographical mobility - Moved from different state (%) - White
Geographical mobility - Moved from different state (%) - Black or African American
Geographical mobility - Moved from different state (%) - Asian
Geographical mobility - Moved from different state (%) - Hispanic or Latino
Geographical mobility - Moved from different state (%) - American Indian and Alaska Native
Geographical mobility - Moved from different state (%) - Multirace
Geographical mobility - Moved from different state (%) - Other Race
Geographical mobility - Moved from abroad (%)
Geographical mobility - Moved from abroad (%) - White
Geographical mobility - Moved from abroad (%) - Black or African American
Geographical mobility - Moved from abroad (%) - Asian
Geographical mobility - Moved from abroad (%) - Hispanic or Latino
Geographical mobility - Moved from abroad (%) - American Indian and Alaska Native
Geographical mobility - Moved from abroad (%) - Multirace
Geographical mobility - Moved from abroad (%) - Other Race
Place of birth for the foreign-born population - Ireland (%)
Place of birth for the foreign-born population - Denmark (%)
Place of birth for the foreign-born population - Norway (%)
Place of birth for the foreign-born population - Sweden (%)
Place of birth for the foreign-born population - United Kingdom (%)
Place of birth for the foreign-born population - England (%)
Place of birth for the foreign-born population - Scotland (%)
Place of birth for the foreign-born population - Other Northern Europe (%)
Place of birth for the foreign-born population - Austria (%)
Place of birth for the foreign-born population - Belgium (%)
Place of birth for the foreign-born population - France (%)
Place of birth for the foreign-born population - Germany (%)
Place of birth for the foreign-born population - Netherlands (%)
Place of birth for the foreign-born population - Switzerland (%)
Place of birth for the foreign-born population - Other Western Europe (%)
Place of birth for the foreign-born population - Greece (%)
Place of birth for the foreign-born population - Italy (%)
Place of birth for the foreign-born population - Portugal (%)
Place of birth for the foreign-born population - Spain (%)
Place of birth for the foreign-born population - Other Southern Europe (%)
Place of birth for the foreign-born population - Albania (%)
Place of birth for the foreign-born population - Belarus (%)
Place of birth for the foreign-born population - Bosnia and Herzegovina (%)
Place of birth for the foreign-born population - Bulgaria (%)
Place of birth for the foreign-born population - Croatia (%)
Place of birth for the foreign-born population - Czechoslovakia (%)
Place of birth for the foreign-born population - Hungary (%)
Place of birth for the foreign-born population - Latvia (%)
Place of birth for the foreign-born population - Lithuania (%)
Place of birth for the foreign-born population - North Macedonia (Macedonia) (%)
Place of birth for the foreign-born population - Moldova (%)
Place of birth for the foreign-born population - Poland (%)
Place of birth for the foreign-born population - Romania (%)
Place of birth for the foreign-born population - Russia (%)
Place of birth for the foreign-born population - Serbia (%)
Place of birth for the foreign-born population - Ukraine (%)
Place of birth for the foreign-born population - Other Eastern Europe (%)
Place of birth for the foreign-born population - China (%)
Place of birth for the foreign-born population - Hong Kong (%)
Place of birth for the foreign-born population - Taiwan (%)
Place of birth for the foreign-born population - Japan (%)
Place of birth for the foreign-born population - Korea (%)
Place of birth for the foreign-born population - Other Eastern Asia (%)
Place of birth for the foreign-born population - Afghanistan (%)
Place of birth for the foreign-born population - Bangladesh (%)
Place of birth for the foreign-born population - India (%)
Place of birth for the foreign-born population - Iran (%)
Place of birth for the foreign-born population - Kazakhstan (%)
Place of birth for the foreign-born population - Nepal (%)
Place of birth for the foreign-born population - Pakistan (%)
Place of birth for the foreign-born population - Sri Lanka (%)
Place of birth for the foreign-born population - Uzbekistan (%)
Place of birth for the foreign-born population - Other South Central Asia (%)
Place of birth for the foreign-born population - Burma (%)
Place of birth for the foreign-born population - Cambodia (%)
Place of birth for the foreign-born population - Indonesia (%)
Place of birth for the foreign-born population - Laos (%)
Place of birth for the foreign-born population - Malaysia (%)
Place of birth for the foreign-born population - Philippines (%)
Place of birth for the foreign-born population - Singapore (%)
Place of birth for the foreign-born population - Thailand (%)
Place of birth for the foreign-born population - Vietnam (%)
Place of birth for the foreign-born population - Other South Eastern Asia (%)
Place of birth for the foreign-born population - Armenia (%)
Place of birth for the foreign-born population - Iraq (%)
Place of birth for the foreign-born population - Israel (%)
Place of birth for the foreign-born population - Jordan (%)
Place of birth for the foreign-born population - Kuwait (%)
Place of birth for the foreign-born population - Lebanon (%)
Place of birth for the foreign-born population - Saudi Arabia (%)
Place of birth for the foreign-born population - Syria (%)
Place of birth for the foreign-born population - Turkey (%)
Place of birth for the foreign-born population - Yemen (%)
Place of birth for the foreign-born population - Other Western Asia (%)
Place of birth for the foreign-born population - Eritrea (%)
Place of birth for the foreign-born population - Ethiopia (%)
Place of birth for the foreign-born population - Kenya (%)
Place of birth for the foreign-born population - Somalia (%)
Place of birth for the foreign-born population - Uganda (%)
Place of birth for the foreign-born population - Zimbabwe (%)
Place of birth for the foreign-born population - Other Eastern Africa (%)
Place of birth for the foreign-born population - Cameroon (%)
Place of birth for the foreign-born population - Congo (%)
Place of birth for the foreign-born population - Democratic Republic of Congo (Zaire) (%)
Place of birth for the foreign-born population - Other Middle Africa (%)
Place of birth for the foreign-born population - Egypt (%)
Place of birth for the foreign-born population - Morocco (%)
Place of birth for the foreign-born population - Sudan (%)
Place of birth for the foreign-born population - Other Northern Africa (%)
Place of birth for the foreign-born population - South Africa (%)
Place of birth for the foreign-born population - Other Southern Africa (%)
Place of birth for the foreign-born population - Cabo Verde (%)
Place of birth for the foreign-born population - Ghana (%)
Place of birth for the foreign-born population - Liberia (%)
Place of birth for the foreign-born population - Nigeria (%)
Place of birth for the foreign-born population - Senegal (%)
Place of birth for the foreign-born population - Sierra Leone (%)
Place of birth for the foreign-born population - Other Western Africa (%)
Place of birth for the foreign-born population - Australia (%)
Place of birth for the foreign-born population - New Zealand (%)
Place of birth for the foreign-born population - Fiji (%)
Place of birth for the foreign-born population - Micronesia (%)
Place of birth for the foreign-born population - Bahamas (%)
Place of birth for the foreign-born population - Barbados (%)
Place of birth for the foreign-born population - Cuba (%)
Place of birth for the foreign-born population - Dominica (%)
Place of birth for the foreign-born population - Dominican Republic (%)
Place of birth for the foreign-born population - Grenada (%)
Place of birth for the foreign-born population - Haiti (%)
Place of birth for the foreign-born population - Jamaica (%)
Place of birth for the foreign-born population - St. Vincent and the Grenadines (%)
Place of birth for the foreign-born population - Trinidad and Tobago (%)
Place of birth for the foreign-born population - West Indies (%)
Place of birth for the foreign-born population - Other Caribbean (%)
Place of birth for the foreign-born population - Belize (%)
Place of birth for the foreign-born population - Costa Rica (%)
Place of birth for the foreign-born population - El Salvador (%)
Place of birth for the foreign-born population - Guatemala (%)
Place of birth for the foreign-born population - Honduras (%)
Place of birth for the foreign-born population - Mexico (%)
Place of birth for the foreign-born population - Nicaragua (%)
Place of birth for the foreign-born population - Panama (%)
Place of birth for the foreign-born population - Other Central America (%)
Place of birth for the foreign-born population - Argentina (%)
Place of birth for the foreign-born population - Bolivia (%)
Place of birth for the foreign-born population - Brazil (%)
Place of birth for the foreign-born population - Chile (%)
Place of birth for the foreign-born population - Colombia (%)
Place of birth for the foreign-born population - Ecuador (%)
Place of birth for the foreign-born population - Guyana (%)
Place of birth for the foreign-born population - Peru (%)
Place of birth for the foreign-born population - Uruguay (%)
Place of birth for the foreign-born population - Venezuela (%)
Place of birth for the foreign-born population - Other South America (%)
Place of birth for the foreign-born population - Canada (%)
Place of birth for the foreign-born population - Other Northern America (%)
Place of birth for the foreign-born population - Other (%)
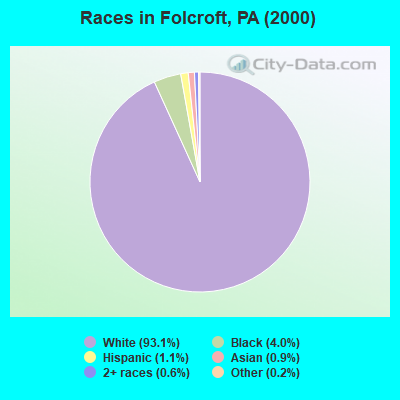
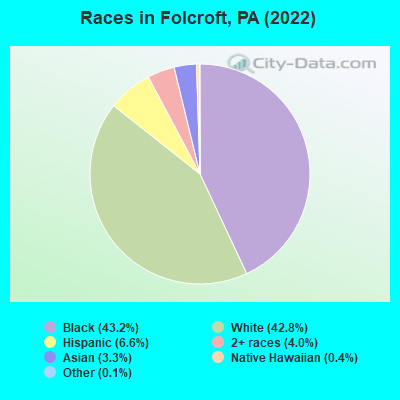
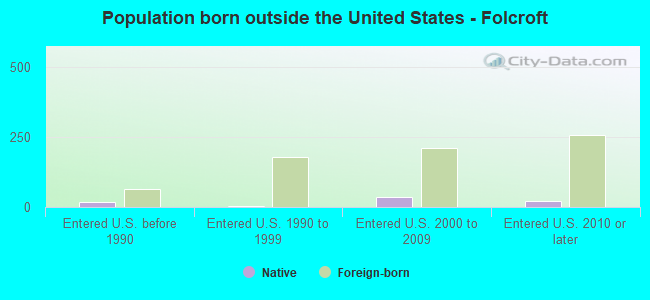
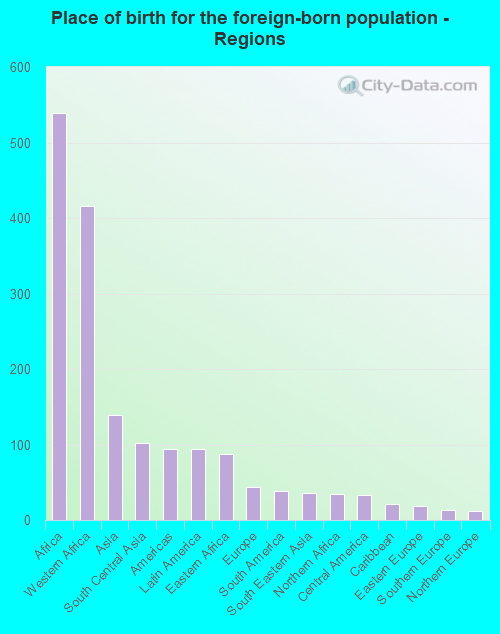
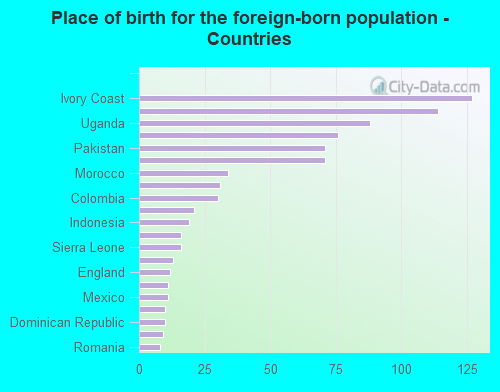
According to 2022 data, the most numerous races in Folcroft, PA are White alone (2,892 residents), Black alone (2,920 residents), and Hispanic (443 residents). 79.9% of Folcroft residents speak English at home. 12.1% of Folcroft, PA residents are foreign-born (7.7% born in Africa, 2.0% born in Asia, 1.3% born in Latin America), which is 42.1% greater than the foreign-born rate of 7.0% across the entire state of Pennsylvania.
Race distribution in Folcroft
2000 2022
10,322,455 84.1% White alone 1,202,437 9.8% Black alone 394,088 3.2% Hispanic 218,296 1.8% Asian alone 113,097 0.9% Two or more races 13,086 0.1% Other race alone 14,904 0.1% American Indian alone 2,691 0.02% Native Hawaiian and Other
9,487,228 73.1% White alone 1,311,581 10.1% Black alone 1,115,997 8.6% Hispanic 493,942 3.8% Two or more races 487,124 3.8% Asian alone 63,582 0.5% Other race alone 10,130 0.08% American Indian alone 2,424 0.02% Native Hawaiian and Other
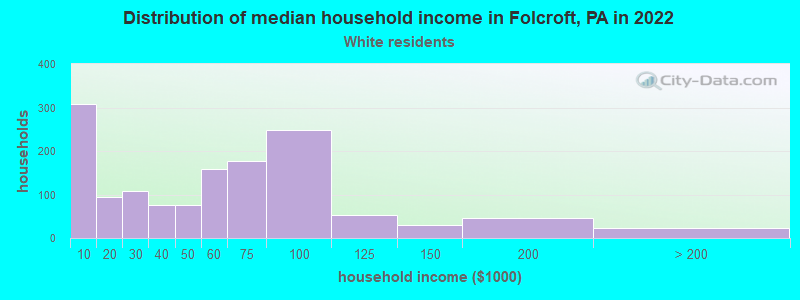
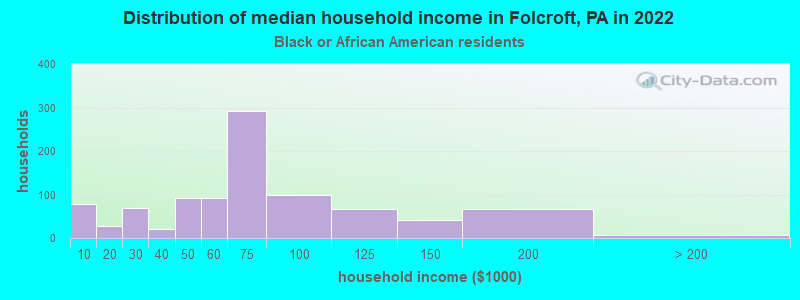
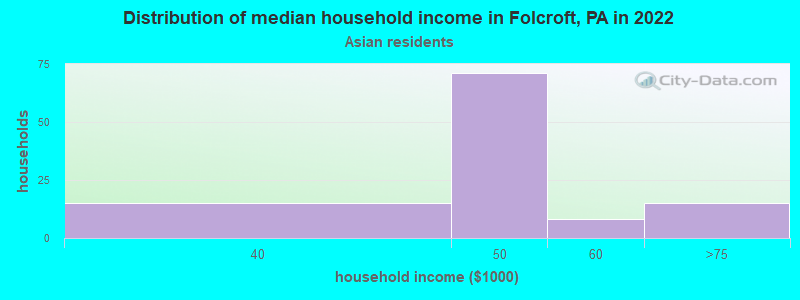
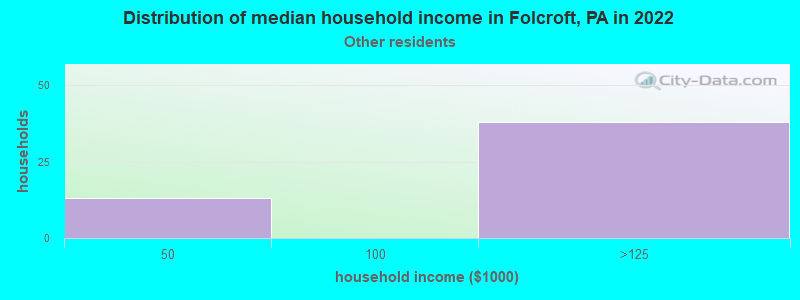
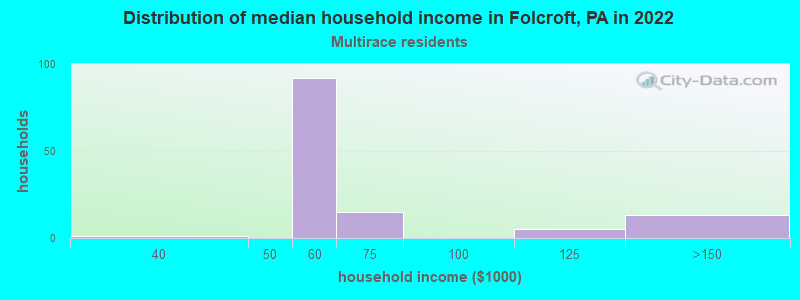
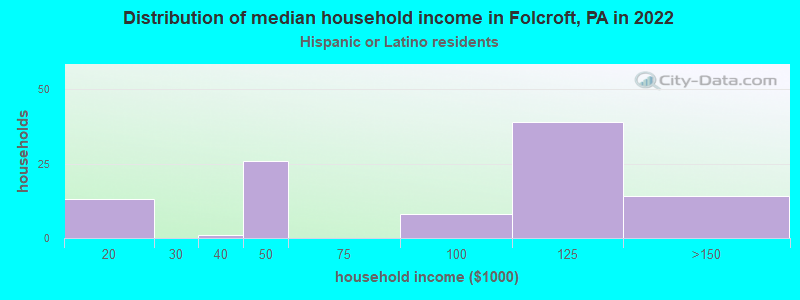
Income and house value in Folcroft Median household income in 2022 $49,172 White non-Hispanic householders$63,658 Black householders$49,904 Asian householders$48,598 Two or more races householders$95,465 Hispanic or Latino race householdersMedian 2022 house value $150,702 White Non-Hispanic householders$194,859 Black or African American householders $224,230 Asian householders$264,944 Hispanic or Latino householders
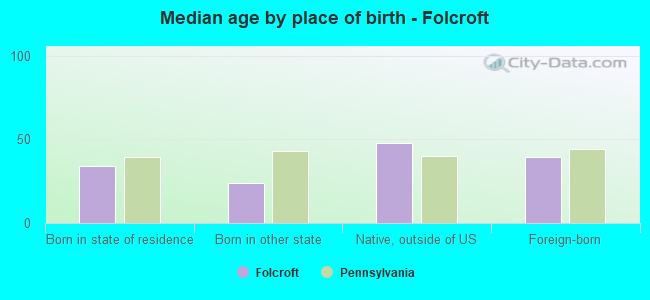
Median age by race in Folcroft
44.0 Median age for White residents39.0 45.7 27.2 Median age for Black or African American residents24.9 33.6 -1,210,144,926.3 Median age for American Indian / Alaska Native residents-1,478,964,399.8 -897,163,119.7 26.4 Median age for Asian residents26.4 28.1 -680,432,644.4 Median age for Native Hawaiian / Pacific Islander residents-666,666,666.0 -747,474,746.7 38.9 Median age for Other race residents44.0 41.8 13.6 Median age for Two or more races residents9.6 13.6 45.2 Median age for White alone residents41.3 45.7 31.8 Median age for Hispanic or Latino residents31.7 31.7
Owner/renter occupied households by race in Folcroft
House owners and renters - White residents 1,080 82.4% Owner occupied231 17.6% Renter occupiedHouse owners and renters - Black or African American residents 642 70.4% Owner occupied269 29.6% Renter occupiedHouse owners and renters - American Indian / Alaska Native residents 20 100.0% Renter occupiedHouse owners and renters - Asian residents 47 48.6% Owner occupied50 51.4% Renter occupiedHouse owners and renters - Other race residents 49 100.0% Owner occupiedHouse owners and renters - Two or more races residents 29 27.7% Owner occupied75 72.3% Renter occupiedHouse owners and renters - White alone residents 1,065 81.8% Owner occupied237 18.2% Renter occupiedHouse owners and renters - Hispanic or Latino residents 86 80.7% Owner occupied21 19.3% Renter occupied
Language usage in Folcroft
English speakers - Total 79.9% of residents of Folcroft speak English at home.
6.4% of residents speak Spanish at home 177 44.9% Speak English very well217 55.1% Speak English less than very well13.4% of residents speak other language at home 418 50.7% Speak English very well407 49.3% Speak English less than very well
English speakers - Born in the United States 61.1% of residents of Folcroft speak English at home.
23.0% of residents speak Spanish at home 73 44.2% Speak English very well92 55.8% Speak English less than very well24.7% of residents speak other language at home 96 54.2% Speak English very well81 45.8% Speak English less than very well
English speakers - Native, born elsewhere 21.2% of residents of Folcroft speak English at home.
23.8% of residents speak Spanish at home 19 100.0% Speak English very well36.2% of residents speak other language at home 29 100.0% Speak English very well
English speakers - Foreign-born 10.7% of residents of Folcroft speak English at home.
7.9% of residents speak Spanish at home 15 26.3% Speak English very well42 73.7% Speak English less than very well78.9% of residents speak other language at home 261 45.8% Speak English very well309 54.2% Speak English less than very well
White (Caucasian) - Speak only English Native:
95.0% (2,643)Foreign-born:
31.2% (26)
White (Caucasian) - Speak another language Native:
4.5% (124)Foreign-born:
66.8% (57)
Black or African American - Speak only English Native:
93.0% (1,934)Foreign-born:
8.4% (36)
Black or African American - Speak another language Native:
7.0% (145)Foreign-born:
90.2% (392)
Asian - Speak another language Native:
100.0% (86)Foreign-born:
94.7% (118)
Other race - Speak another language Native:
88.1% (252)Foreign-born:
100.0% (24)
Two or more races - Speak only English Native:
91.9% (193)Foreign-born:
28.6% (14)
Two or more races - Speak another language Native:
8.3% (17)Foreign-born:
67.6% (32)
White alone - Speak only English Native:
95.9% (2,647)Foreign-born:
36.8% (27)
White alone - Speak another language Native:
3.9% (106)Foreign-born:
62.9% (46)
Hispanic or Latino - Speak only English Native:
28.5% (103)Foreign-born:
9.1% (5)
Hispanic or Latino - Speak another language Native:
68.2% (246)Foreign-born:
88.7% (52)
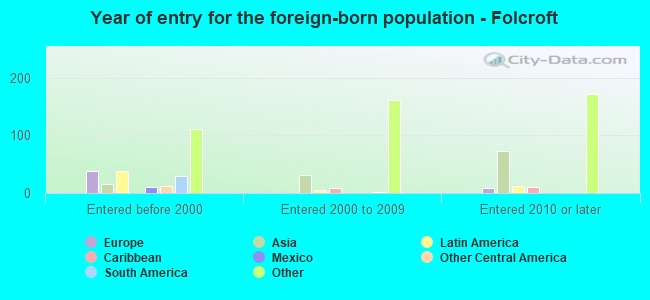
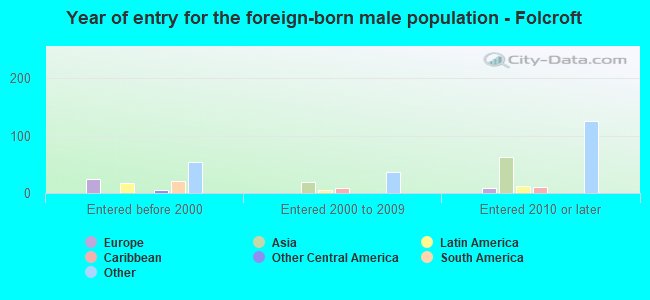
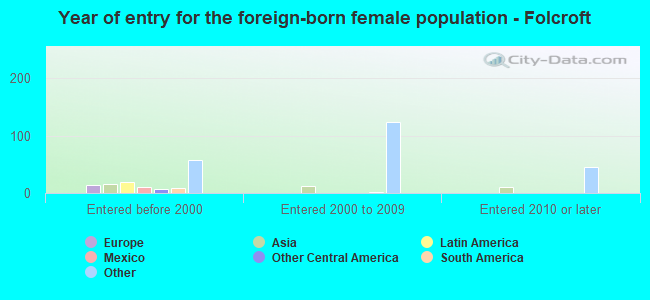
Foreign-born residents in Folcroft 817 residents are foreign born (7.7% Africa , 2.0% Asia , 1.3% Latin America ).
This city:
12.1%Pennsylvania:
7.3%
Marital status for residents in Folcroft Marital status - White (Caucasian) population 15 years and over
Males 50.9% Never married34.8% Now married5.6% Separated3.8% Widowed4.8% DivorcedFemales 40.6% Never married29.9% Now married0.8% Separated14.2% Widowed14.5% DivorcedWomen who gave birth in the past 12 months Now married:
65.7% (44)Unmarried:
34.3% (23)
Women who did not give birth in the past 12 months Now married:
11.8% (63)Unmarried:
88.2% (472)
Marital status - Black or African American population 15 years and over
Males 51.3% Never married42.2% Now married1.0% Separated0.0% Widowed5.5% DivorcedFemales 34.8% Never married41.4% Now married1.7% Separated3.4% Widowed18.7% DivorcedWomen who gave birth in the past 12 months Now married:
62.1% (65)Unmarried:
37.9% (39)
Women who did not give birth in the past 12 months Now married:
51.5% (344)Unmarried:
48.5% (324)
Marital status - Asian population 15 years and over
Males 17.7% Never married82.3% Now married0.0% Separated0.0% Widowed0.0% DivorcedFemales 25.5% Never married36.4% Now married0.0% Separated0.0% Widowed38.2% DivorcedWomen who did not give birth in the past 12 months Now married:
40.0% (21)Unmarried:
60.0% (31)
Marital status - Other race population 15 years and over
Males 65.9% Never married34.1% Now married0.0% Separated0.0% Widowed0.0% DivorcedFemales 44.9% Never married22.1% Now married0.0% Separated33.1% Widowed0.0% DivorcedWomen who did not give birth in the past 12 months Now married:
33.0% (37)Unmarried:
67.0% (76)
Marital status - Two or more races population 15 years and over
Males 0.0% Never married100.0% Now married0.0% Separated0.0% Widowed0.0% DivorcedFemales 50.0% Never married39.4% Now married0.0% Separated9.6% Widowed1.0% DivorcedWomen who did not give birth in the past 12 months Now married:
26.8% (23)Unmarried:
73.2% (62)
Marital status - White alone, not Hispanic / Latino population 15 years and over
Males 52.0% Never married34.0% Now married5.8% Separated3.9% Widowed4.3% DivorcedFemales 40.6% Never married29.4% Now married0.8% Separated14.4% Widowed14.8% DivorcedWomen who gave birth in the past 12 months Now married:
65.7% (45)Unmarried:
34.3% (23)
Women who did not give birth in the past 12 months Now married:
9.8% (51)Unmarried:
90.2% (467)
Marital status - Hispanic or Latino population 15 years and over
Males 51.5% Never married43.3% Now married0.0% Separated0.0% Widowed5.2% DivorcedFemales 43.2% Never married34.7% Now married0.0% Separated21.6% Widowed0.5% DivorcedWomen who did not give birth in the past 12 months Now married:
40.6% (69)Unmarried:
59.4% (100)
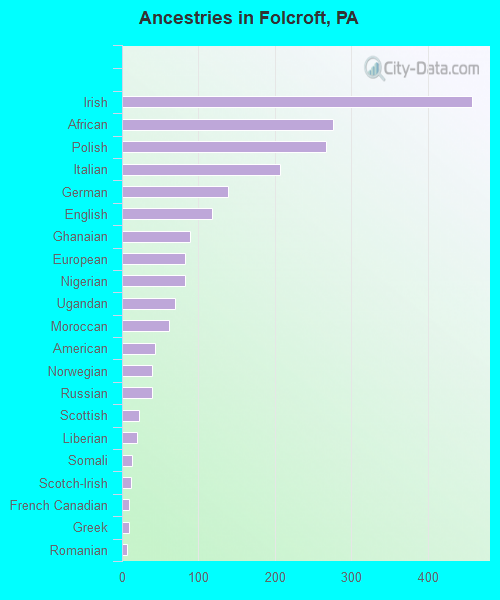
Ancestries in Folcroft
457 10.5% Irish276 6.3% African267 6.1% Polish207 4.7% Italian138 3.2% German118 2.7% English89 2.0% Ghanaian82 1.9% European82 1.9% Nigerian69 1.6% Ugandan62 1.4% Moroccan43 1.0% American39 0.9% Norwegian39 0.9% Russian22 0.5% Scottish19 0.4% Liberian13 0.3% Somali12 0.3% Scotch-Irish9 0.2% French Canadian9 0.2% Greek7 0.2% Romanian4 0.09% Iranian
Children Nativity (place of birth) in Folcroft
Children under 6 years - Living with two parents Both parents native 178 100.0% NativeBoth parents foreign-born 104 100.0% NativeOne native, one foreign-born parent 5 100.0% NativeChildren under 6 years - Living with one parent Native parent 274 100.0% NativeForeign-born parent 76 100.0% NativeChildren 6 to 17 years - Living with two parents Both parents native 328 100.0% NativeBoth parents foreign-born 84 100.0% NativeOne native, one foreign-born parent 136 100.0% NativeChildren 6 to 17 years - Living with one parent Native parent 310 100.0% NativeForeign-born parent 111 55.6% Native89 44.4% Foreign-born
Grandparents responsible for own grandchildren in Folcroft
Grandparents (30 to 59 years) White / Caucasian 168 97.1% Responsible for grandchildren5 2.9% Not responsible for grandchildrenBlack or African American 16 21.4% Responsible for grandchildren58 78.6% Not responsible for grandchildrenWhite alone, not Hispanic / Latino 168 100.0% Responsible for grandchildrenHispanic or Latino 9 100.0% Not responsible for grandchildrenGrandparents (60 years and over) White / Caucasian 23 47.0% Responsible for grandchildren26 53.0% Not responsible for grandchildrenBlack or African American 4 25.3% Responsible for grandchildren11 74.7% Not responsible for grandchildrenWhite alone, not Hispanic / Latino 23 46.7% Responsible for grandchildren26 53.3% Not responsible for grandchildrenHispanic or Latino 48 100.0% Not responsible for grandchildren