Races in Forestport, New York (NY) Detailed Stats
Ancestries, Foreign-born residents, place of birth

Recent posts about races in Forestport, New York on our local forum with over 2,400,000 registered users:
 | "Quaint" communities (43 replies) |
| Moving to Adirondacks from NYC (78 replies) |
| Adirondacks destinations (9 replies) |
| Syracuse Chat thread (6337 replies) |
1.3% of Forestport, NY residents are foreign-born , which is 1592.0% less than the foreign-born rate of 22.0% across the entire state of New York.
Race distribution in Forestport

- 1,66798.5%White alone
- 100.6%Two or more races
- 60.4%Black alone
- 50.3%American Indian alone
- 30.2%Asian alone
- 10.06%Hispanic

2000
2022
-
- 11,760,98162.0%White alone
- 2,867,58315.1%Hispanic
- 2,812,62314.8%Black alone
- 1,035,9265.5%Asian alone
- 366,1161.9%Two or more races
- 75,4990.4%Other race alone
- 52,4990.3%American Indian alone
- 5,2300.03%Native Hawaiian and Other
Pacific Islander alone

-
- 10,408,93352.9%White alone
- 3,867,29919.7%Hispanic
- 2,633,84013.4%Black alone
- 1,776,2869.0%Asian alone
- 732,6703.7%Two or more races
- 216,1101.1%Other race alone
- 35,0820.2%American Indian alone
- 6,9310.04%Native Hawaiian and Other
Pacific Islander alone

Income and house value in Forestport
- Median household income in 2022
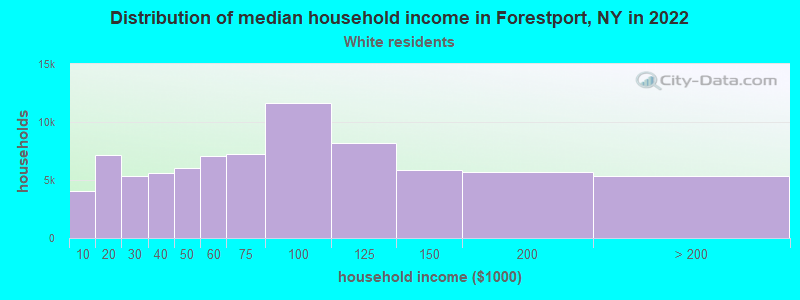
- $63,296White non-Hispanic householders
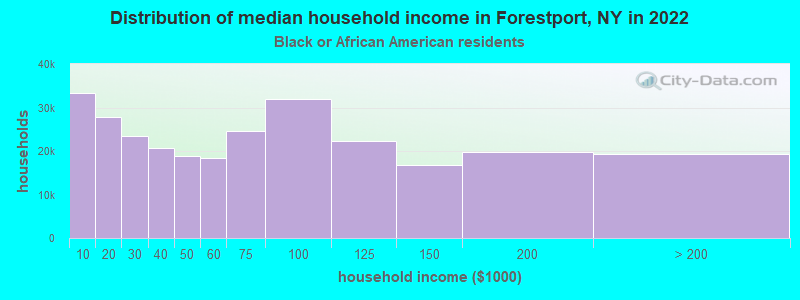
- $25,915Black householders
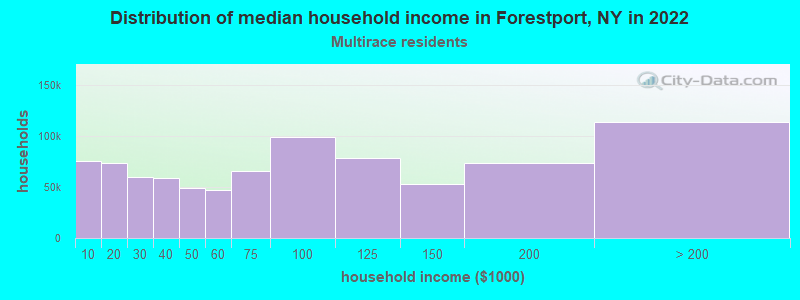
- over $200,000Two or more races householders
- Median 2022 house value
- $169,276White Non-Hispanic householders
- $315,385Black or African American householders
- $126,154Two or more races householders
Household income for White non-Hispanic householders
Household income for Black householders
Household income for American Indian and Alaska Native householders

Household income for Two or more races householders
Foreign-born residents in Forestport
22 residents are foreign born
| This city: | 1.3% |
| New York: | 20.4% |
Ancestries in Forestport

- 42920.2%German
- 41319.5%Irish
- 30514.4%English
- 1798.4%French
- 1768.3%Italian
- 1065.0%Welsh
- 1044.9%Polish
- 874.1%United States
- 813.8%Other
- 562.6%Scottish
- 512.4%French Canadian
- 442.1%Dutch
- 200.9%Russian
- 170.8%Scotch-Irish
- 160.8%Swiss
- 110.5%Ukrainian
- 90.4%Hungarian
- 50.2%Danish
- 30.1%Lithuanian
- 30.1%Subsaharan African
- 20.09%Arab
- 20.09%Swedish

Zip codes: 13338.