Races in Fort Drum, New York (NY) Detailed Stats
Data:
Races - White alone (%)
Races - White alone (% change since 2000)
Races - Black alone (%)
Races - Black alone (% change since 2000)
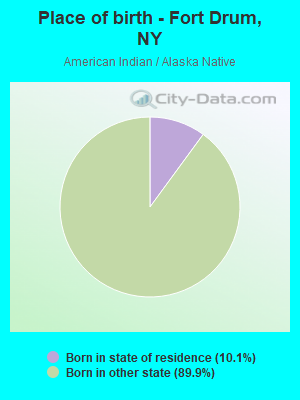
Races - American Indian alone (%)
Races - American Indian alone (% change since 2000)
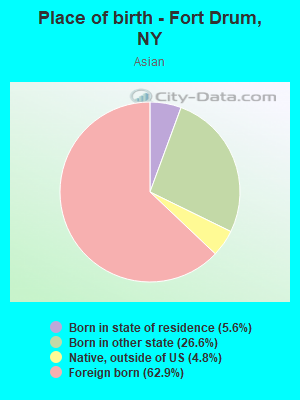
Races - Asian alone (%)
Races - Asian alone (% change since 2000)
Races - Hispanic (%)
Races - Hispanic (% change since 2000)
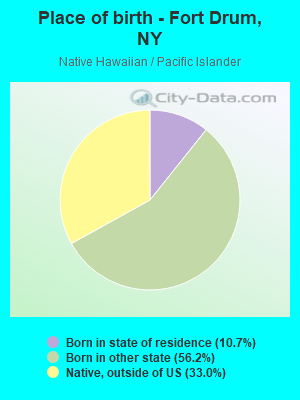
Races - Native Hawaiian and Other Pacific Islander alone (%)
Races - Native Hawaiian and Other Pacific Islander alone (% change since 2000)
Races - Two or more races(%)
Races - Two or more races(% change since 2000)
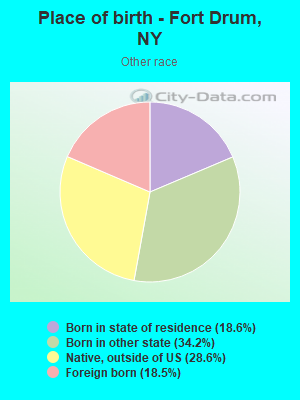
Races - Other race alone (%)
Races - Other race alone (% change since 2000)
Racial diversity
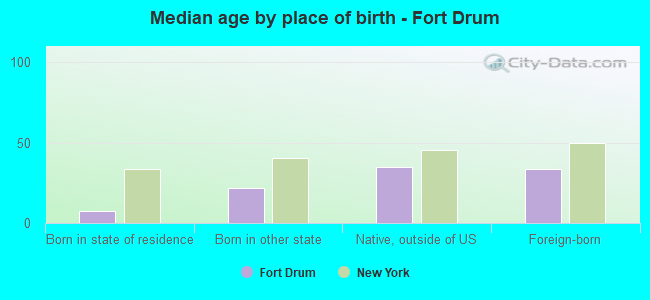
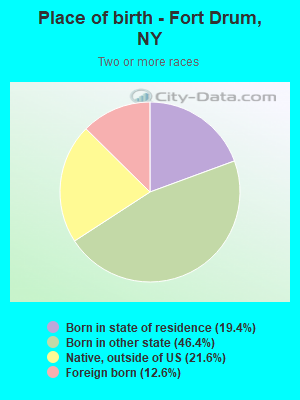
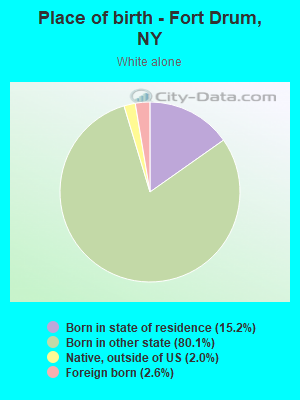
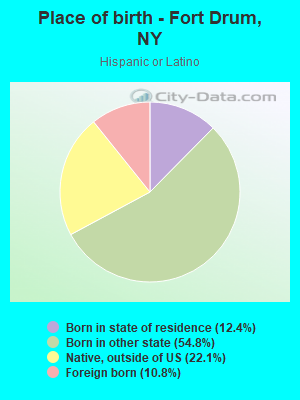
Place of birth - Born in state of residence (%)
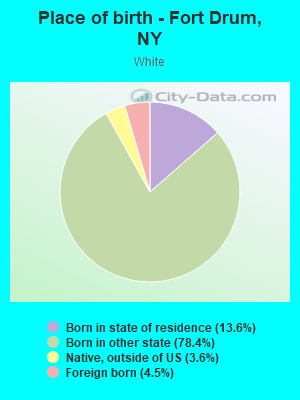
Place of birth - Born in state of residence (%) - White
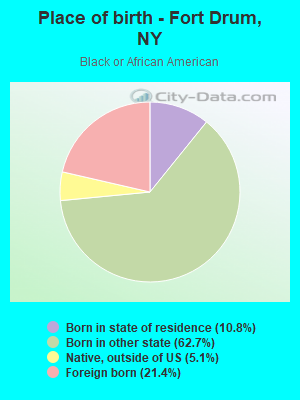
Place of birth - Born in state of residence (%) - Black or African American
Place of birth - Born in state of residence (%) - Asian
Place of birth - Born in state of residence (%) - Hispanic or Latino
Place of birth - Born in state of residence (%) - American Indian and Alaska Native
Place of birth - Born in state of residence (%) - Multirace
Place of birth - Born in state of residence (%) - Other Race
Place of birth - Born in other state (%)
Place of birth - Born in other state (%) - White
Place of birth - Born in other state (%) - Black or African American
Place of birth - Born in other state (%) - Asian
Place of birth - Born in other state (%) - Hispanic or Latino
Place of birth - Born in other state (%) - American Indian and Alaska Native
Place of birth - Born in other state (%) - Multirace
Place of birth - Born in other state (%) - Other Race
Place of birth - Native, outside of US (%)
Place of birth - Native, outside of US (%) - White
Place of birth - Native, outside of US (%) - Black or African American
Place of birth - Native, outside of US (%) - Asian
Place of birth - Native, outside of US (%) - Hispanic or Latino
Place of birth - Native, outside of US (%) - American Indian and Alaska Native
Place of birth - Native, outside of US (%) - Multirace
Place of birth - Native, outside of US (%) - Other Race
Place of birth - Foreign born (%)
Place of birth - Foreign born (%) - White
Place of birth - Foreign born (%) - Black or African American
Place of birth - Foreign born (%) - Asian
Place of birth - Foreign born (%) - Hispanic or Latino
Place of birth - Foreign born (%) - American Indian and Alaska Native
Place of birth - Foreign born (%) - Multirace
Place of birth - Foreign born (%) - Other Race
Residents speaking English at home (%)
Residents speaking English at home - Born in the United States (%)
Residents speaking English at home - Native, born elsewhere (%)
Residents speaking English at home - Foreign born (%)
Residents speaking Spanish at home (%)
Residents speaking Spanish at home - Born in the United States (%)
Residents speaking Spanish at home - Native, born elsewhere (%)
Residents speaking Spanish at home - Foreign born (%)
Residents speaking other language at home (%)
Residents speaking other language at home - Born in the United States (%)
Residents speaking other language at home - Native, born elsewhere (%)
Residents speaking other language at home - Foreign born (%)
Marital status - Never married (%)
Marital status - Now married (%)
Marital status - Separated (%)
Marital status - Widowed (%)
Marital status - Divorced (%)
Ancestries Reported - Arab (%)
Ancestries Reported - Czech (%)
Ancestries Reported - Danish (%)
Ancestries Reported - Dutch (%)
Ancestries Reported - English (%)
Ancestries Reported - French (%)
Ancestries Reported - French Canadian (%)
Ancestries Reported - German (%)
Ancestries Reported - Greek (%)
Ancestries Reported - Hungarian (%)
Ancestries Reported - Irish (%)
Ancestries Reported - Italian (%)
Ancestries Reported - Lithuanian (%)
Ancestries Reported - Norwegian (%)
Ancestries Reported - Polish (%)
Ancestries Reported - Portuguese (%)
Ancestries Reported - Russian (%)
Ancestries Reported - Scotch-Irish (%)
Ancestries Reported - Scottish (%)
Ancestries Reported - Slovak (%)
Ancestries Reported - Subsaharan African (%)
Ancestries Reported - Swedish (%)
Ancestries Reported - Swiss (%)
Ancestries Reported - Ukrainian (%)
Ancestries Reported - United States (%)
Ancestries Reported - Welsh (%)
Ancestries Reported - West Indian (%)
Ancestries Reported - Other (%)
Geographical mobility - Same house 1 year ago (%)
Geographical mobility - Same house 1 year ago (%) - White
Geographical mobility - Same house 1 year ago (%) - Black or African American
Geographical mobility - Same house 1 year ago (%) - Asian
Geographical mobility - Same house 1 year ago (%) - Hispanic or Latino
Geographical mobility - Same house 1 year ago (%) - American Indian and Alaska Native
Geographical mobility - Same house 1 year ago (%) - Multirace
Geographical mobility - Same house 1 year ago (%) - Other Race
Geographical mobility - Moved within same county (%)
Geographical mobility - Moved within same county (%) - White
Geographical mobility - Moved within same county (%) - Black or African American
Geographical mobility - Moved within same county (%) - Asian
Geographical mobility - Moved within same county (%) - Hispanic or Latino
Geographical mobility - Moved within same county (%) - American Indian and Alaska Native
Geographical mobility - Moved within same county (%) - Multirace
Geographical mobility - Moved within same county (%) - Other Race
Geographical mobility - Moved from different county within same state (%)
Geographical mobility - Moved from different county within same state (%) - White
Geographical mobility - Moved from different county within same state (%) - Black or African American
Geographical mobility - Moved from different county within same state (%) - Asian
Geographical mobility - Moved from different county within same state (%) - Hispanic or Latino
Geographical mobility - Moved from different county within same state (%) - American Indian and Alaska Native
Geographical mobility - Moved from different county within same state (%) - Multirace
Geographical mobility - Moved from different county within same state (%) - Other Race
Geographical mobility - Moved from different state (%)
Geographical mobility - Moved from different state (%) - White
Geographical mobility - Moved from different state (%) - Black or African American
Geographical mobility - Moved from different state (%) - Asian
Geographical mobility - Moved from different state (%) - Hispanic or Latino
Geographical mobility - Moved from different state (%) - American Indian and Alaska Native
Geographical mobility - Moved from different state (%) - Multirace
Geographical mobility - Moved from different state (%) - Other Race
Geographical mobility - Moved from abroad (%)
Geographical mobility - Moved from abroad (%) - White
Geographical mobility - Moved from abroad (%) - Black or African American
Geographical mobility - Moved from abroad (%) - Asian
Geographical mobility - Moved from abroad (%) - Hispanic or Latino
Geographical mobility - Moved from abroad (%) - American Indian and Alaska Native
Geographical mobility - Moved from abroad (%) - Multirace
Geographical mobility - Moved from abroad (%) - Other Race
Place of birth for the foreign-born population - Ireland (%)
Place of birth for the foreign-born population - Denmark (%)
Place of birth for the foreign-born population - Norway (%)
Place of birth for the foreign-born population - Sweden (%)
Place of birth for the foreign-born population - United Kingdom (%)
Place of birth for the foreign-born population - England (%)
Place of birth for the foreign-born population - Scotland (%)
Place of birth for the foreign-born population - Other Northern Europe (%)
Place of birth for the foreign-born population - Austria (%)
Place of birth for the foreign-born population - Belgium (%)
Place of birth for the foreign-born population - France (%)
Place of birth for the foreign-born population - Germany (%)
Place of birth for the foreign-born population - Netherlands (%)
Place of birth for the foreign-born population - Switzerland (%)
Place of birth for the foreign-born population - Other Western Europe (%)
Place of birth for the foreign-born population - Greece (%)
Place of birth for the foreign-born population - Italy (%)
Place of birth for the foreign-born population - Portugal (%)
Place of birth for the foreign-born population - Spain (%)
Place of birth for the foreign-born population - Other Southern Europe (%)
Place of birth for the foreign-born population - Albania (%)
Place of birth for the foreign-born population - Belarus (%)
Place of birth for the foreign-born population - Bosnia and Herzegovina (%)
Place of birth for the foreign-born population - Bulgaria (%)
Place of birth for the foreign-born population - Croatia (%)
Place of birth for the foreign-born population - Czechoslovakia (%)
Place of birth for the foreign-born population - Hungary (%)
Place of birth for the foreign-born population - Latvia (%)
Place of birth for the foreign-born population - Lithuania (%)
Place of birth for the foreign-born population - North Macedonia (Macedonia) (%)
Place of birth for the foreign-born population - Moldova (%)
Place of birth for the foreign-born population - Poland (%)
Place of birth for the foreign-born population - Romania (%)
Place of birth for the foreign-born population - Russia (%)
Place of birth for the foreign-born population - Serbia (%)
Place of birth for the foreign-born population - Ukraine (%)
Place of birth for the foreign-born population - Other Eastern Europe (%)
Place of birth for the foreign-born population - China (%)
Place of birth for the foreign-born population - Hong Kong (%)
Place of birth for the foreign-born population - Taiwan (%)
Place of birth for the foreign-born population - Japan (%)
Place of birth for the foreign-born population - Korea (%)
Place of birth for the foreign-born population - Other Eastern Asia (%)
Place of birth for the foreign-born population - Afghanistan (%)
Place of birth for the foreign-born population - Bangladesh (%)
Place of birth for the foreign-born population - India (%)
Place of birth for the foreign-born population - Iran (%)
Place of birth for the foreign-born population - Kazakhstan (%)
Place of birth for the foreign-born population - Nepal (%)
Place of birth for the foreign-born population - Pakistan (%)
Place of birth for the foreign-born population - Sri Lanka (%)
Place of birth for the foreign-born population - Uzbekistan (%)
Place of birth for the foreign-born population - Other South Central Asia (%)
Place of birth for the foreign-born population - Burma (%)
Place of birth for the foreign-born population - Cambodia (%)
Place of birth for the foreign-born population - Indonesia (%)
Place of birth for the foreign-born population - Laos (%)
Place of birth for the foreign-born population - Malaysia (%)
Place of birth for the foreign-born population - Philippines (%)
Place of birth for the foreign-born population - Singapore (%)
Place of birth for the foreign-born population - Thailand (%)
Place of birth for the foreign-born population - Vietnam (%)
Place of birth for the foreign-born population - Other South Eastern Asia (%)
Place of birth for the foreign-born population - Armenia (%)
Place of birth for the foreign-born population - Iraq (%)
Place of birth for the foreign-born population - Israel (%)
Place of birth for the foreign-born population - Jordan (%)
Place of birth for the foreign-born population - Kuwait (%)
Place of birth for the foreign-born population - Lebanon (%)
Place of birth for the foreign-born population - Saudi Arabia (%)
Place of birth for the foreign-born population - Syria (%)
Place of birth for the foreign-born population - Turkey (%)
Place of birth for the foreign-born population - Yemen (%)
Place of birth for the foreign-born population - Other Western Asia (%)
Place of birth for the foreign-born population - Eritrea (%)
Place of birth for the foreign-born population - Ethiopia (%)
Place of birth for the foreign-born population - Kenya (%)
Place of birth for the foreign-born population - Somalia (%)
Place of birth for the foreign-born population - Uganda (%)
Place of birth for the foreign-born population - Zimbabwe (%)
Place of birth for the foreign-born population - Other Eastern Africa (%)
Place of birth for the foreign-born population - Cameroon (%)
Place of birth for the foreign-born population - Congo (%)
Place of birth for the foreign-born population - Democratic Republic of Congo (Zaire) (%)
Place of birth for the foreign-born population - Other Middle Africa (%)
Place of birth for the foreign-born population - Egypt (%)
Place of birth for the foreign-born population - Morocco (%)
Place of birth for the foreign-born population - Sudan (%)
Place of birth for the foreign-born population - Other Northern Africa (%)
Place of birth for the foreign-born population - South Africa (%)
Place of birth for the foreign-born population - Other Southern Africa (%)
Place of birth for the foreign-born population - Cabo Verde (%)
Place of birth for the foreign-born population - Ghana (%)
Place of birth for the foreign-born population - Liberia (%)
Place of birth for the foreign-born population - Nigeria (%)
Place of birth for the foreign-born population - Senegal (%)
Place of birth for the foreign-born population - Sierra Leone (%)
Place of birth for the foreign-born population - Other Western Africa (%)
Place of birth for the foreign-born population - Australia (%)
Place of birth for the foreign-born population - New Zealand (%)
Place of birth for the foreign-born population - Fiji (%)
Place of birth for the foreign-born population - Micronesia (%)
Place of birth for the foreign-born population - Bahamas (%)
Place of birth for the foreign-born population - Barbados (%)
Place of birth for the foreign-born population - Cuba (%)
Place of birth for the foreign-born population - Dominica (%)
Place of birth for the foreign-born population - Dominican Republic (%)
Place of birth for the foreign-born population - Grenada (%)
Place of birth for the foreign-born population - Haiti (%)
Place of birth for the foreign-born population - Jamaica (%)
Place of birth for the foreign-born population - St. Vincent and the Grenadines (%)
Place of birth for the foreign-born population - Trinidad and Tobago (%)
Place of birth for the foreign-born population - West Indies (%)
Place of birth for the foreign-born population - Other Caribbean (%)
Place of birth for the foreign-born population - Belize (%)
Place of birth for the foreign-born population - Costa Rica (%)
Place of birth for the foreign-born population - El Salvador (%)
Place of birth for the foreign-born population - Guatemala (%)
Place of birth for the foreign-born population - Honduras (%)
Place of birth for the foreign-born population - Mexico (%)
Place of birth for the foreign-born population - Nicaragua (%)
Place of birth for the foreign-born population - Panama (%)
Place of birth for the foreign-born population - Other Central America (%)
Place of birth for the foreign-born population - Argentina (%)
Place of birth for the foreign-born population - Bolivia (%)
Place of birth for the foreign-born population - Brazil (%)
Place of birth for the foreign-born population - Chile (%)
Place of birth for the foreign-born population - Colombia (%)
Place of birth for the foreign-born population - Ecuador (%)
Place of birth for the foreign-born population - Guyana (%)
Place of birth for the foreign-born population - Peru (%)
Place of birth for the foreign-born population - Uruguay (%)
Place of birth for the foreign-born population - Venezuela (%)
Place of birth for the foreign-born population - Other South America (%)
Place of birth for the foreign-born population - Canada (%)
Place of birth for the foreign-born population - Other Northern America (%)
Place of birth for the foreign-born population - Other (%)
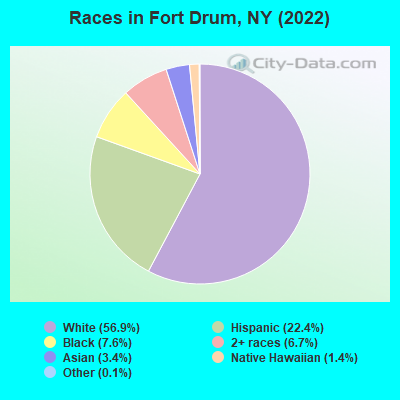
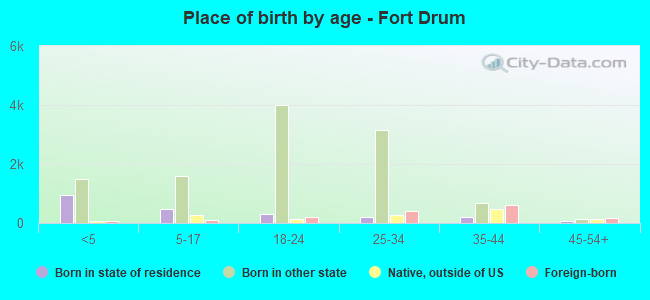
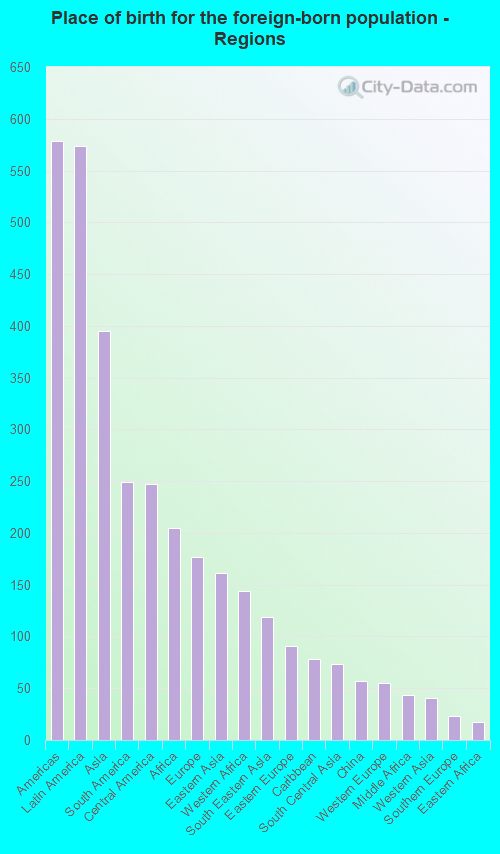
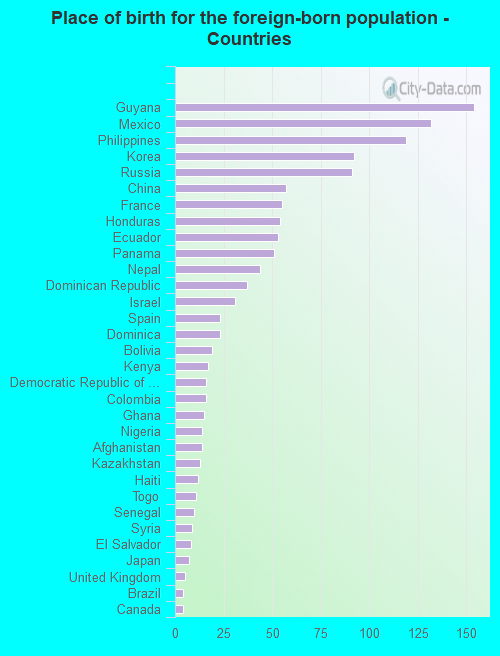
According to 2022 data, the most numerous races in Fort Drum, NY are White alone (9,208 residents), Hispanic (3,630 residents), and Black alone (1,226 residents). 77.9% of Fort Drum residents speak English at home. 8.4% of Fort Drum, NY residents are foreign-born (3.6% born in Latin America, 2.5% born in Asia, 1.3% born in Africa, 1.1% born in Europe), which is 162.2% less than the foreign-born rate of 22.0% across the entire state of New York.
Race distribution in Fort Drum
2000 2022
11,760,981 62.0% White alone 2,867,583 15.1% Hispanic 2,812,623 14.8% Black alone 1,035,926 5.5% Asian alone 366,116 1.9% Two or more races 75,499 0.4% Other race alone 52,499 0.3% American Indian alone 5,230 0.03% Native Hawaiian and Other
10,408,933 52.9% White alone 3,867,299 19.7% Hispanic 2,633,840 13.4% Black alone 1,776,286 9.0% Asian alone 732,670 3.7% Two or more races 216,110 1.1% Other race alone 35,082 0.2% American Indian alone 6,931 0.04% Native Hawaiian and Other
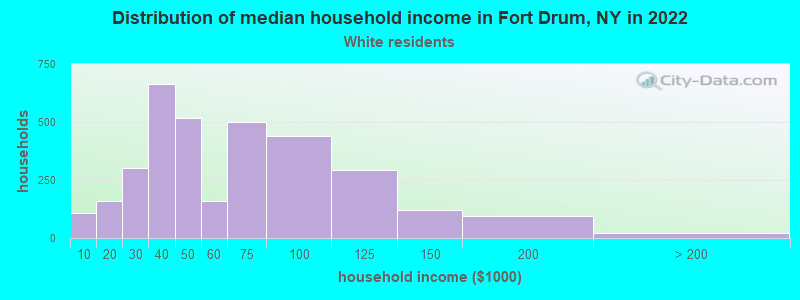
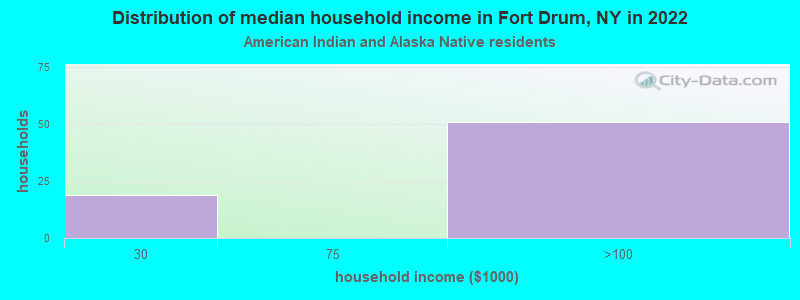
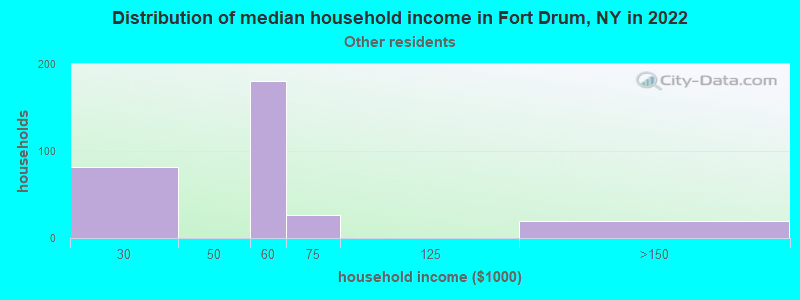
Income and house value in Fort Drum Median household income in 2022 $54,314 White non-Hispanic householders$56,634 Black householders$93,639 Asian householders$56,061 Some other race householders$120,295 Two or more races householders$44,274 Hispanic or Latino race householders
Median age by race in Fort Drum
21.9 Median age for White residents22.6 21.5 29.1 Median age for Black or African American residents29.0 37.0 24.3 Median age for American Indian / Alaska Native residents25.8 22.7 24.7 Median age for Asian residents26.0 27.2 24.7 Median age for Native Hawaiian / Pacific Islander residents27.3 18.2 26.7 Median age for Other race residents26.6 28.3 19.5 Median age for Two or more races residents21.1 17.8 21.9 Median age for White alone residents22.1 21.1 20.9 Median age for Hispanic or Latino residents19.4 23.2
Owner/renter occupied households by race in Fort Drum
House owners and renters - White residents 124 3.6% Owner occupied3,301 96.4% Renter occupiedHouse owners and renters - Black or African American residents 436 100.0% Renter occupiedHouse owners and renters - American Indian / Alaska Native residents 71 100.0% Renter occupiedHouse owners and renters - Asian residents 135 100.0% Renter occupiedHouse owners and renters - Native Hawaiian / Pacific Islander residents 48 100.0% Renter occupiedHouse owners and renters - Other race residents 144 100.0% Renter occupiedHouse owners and renters - Two or more races residents 298 100.0% Renter occupiedHouse owners and renters - White alone residents 99 3.5% Owner occupied2,706 96.5% Renter occupiedHouse owners and renters - Hispanic or Latino residents 50 4.8% Owner occupied982 95.2% Renter occupied
Language usage in Fort Drum
English speakers - Total 77.9% of residents of Fort Drum speak English at home.
11.5% of residents speak Spanish at home 1,088 69.8% Speak English very well471 30.2% Speak English less than very well9.0% of residents speak other language at home 818 67.1% Speak English very well401 32.9% Speak English less than very well
English speakers - Born in the United States 93.0% of residents of Fort Drum speak English at home.
5.1% of residents speak Spanish at home 458 93.5% Speak English very well32 6.5% Speak English less than very well1.3% of residents speak other language at home 116 94.3% Speak English very well7 5.7% Speak English less than very well
English speakers - Native, born elsewhere 39.6% of residents of Fort Drum speak English at home.
59.8% of residents speak Spanish at home 302 38.5% Speak English very well482 61.5% Speak English less than very well1.8% of residents speak other language at home 23 100.0% Speak English very well
English speakers - Foreign-born 13.1% of residents of Fort Drum speak English at home.
31.3% of residents speak Spanish at home 419 87.8% Speak English very well58 12.2% Speak English less than very well65.4% of residents speak other language at home 515 51.6% Speak English very well483 48.4% Speak English less than very well
White (Caucasian) - Speak only English Native:
89.6% (7,730)Foreign-born:
27.8% (123)
White (Caucasian) - Speak another language Native:
6.8% (583)Foreign-born:
71.0% (314)
Black or African American - Speak only English Native:
80.5% (725)Foreign-born:
9.2% (38)
Black or African American - Speak another language Native:
13.6% (123)Foreign-born:
96.5% (395)
Asian - Speak only English Native:
100.0% (100)Foreign-born:
8.9% (32)
Asian - Speak another language Native:
46.2% (46)Foreign-born:
92.0% (330)
Other race - Speak another language Native:
67.9% (309)Foreign-born:
99.8% (239)
Two or more races - Speak only English Native:
68.6% (1,054)Foreign-born:
0.2% (1)
Two or more races - Speak another language Native:
34.9% (536)Foreign-born:
100.0% (283)
White alone - Speak only English Native:
96.9% (7,071)Foreign-born:
23.4% (58)
White alone - Speak another language Native:
2.9% (210)Foreign-born:
57.3% (142)
Hispanic or Latino - Speak only English Native:
53.8% (1,434)Foreign-born:
19.7% (58)
Hispanic or Latino - Speak another language Native:
42.3% (1,127)Foreign-born:
97.0% (288)
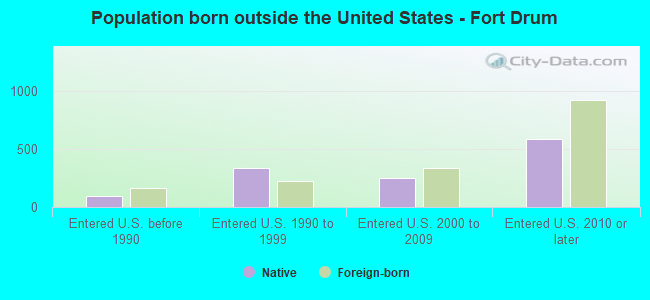
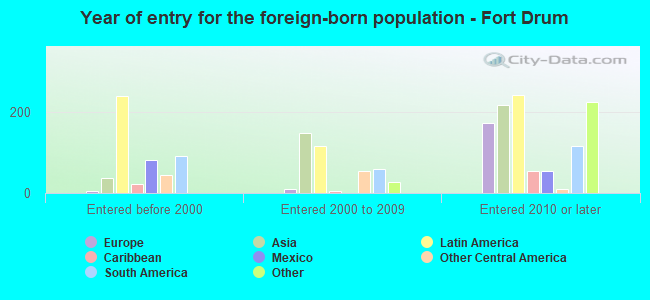
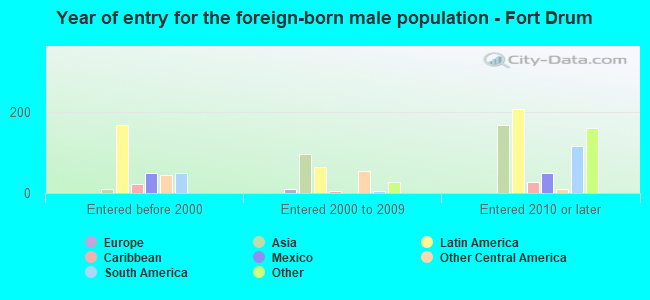
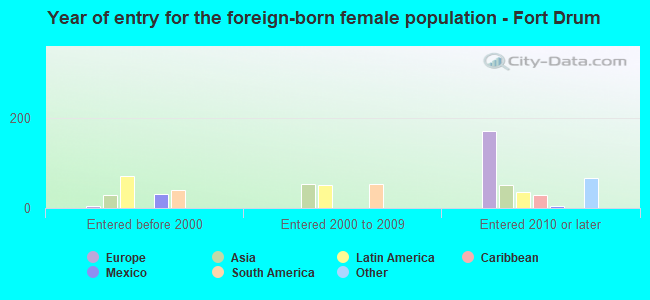
Foreign-born residents in Fort Drum 1,358 residents are foreign born (3.6% Latin America , 2.5% Asia , 1.3% Africa , 1.1% Europe ).
This city:
8.4%New York:
22.6%
Marital status for residents in Fort Drum Marital status - White (Caucasian) population 15 years and over
Males 35.4% Never married63.9% Now married0.0% Separated0.0% Widowed0.7% DivorcedFemales 9.8% Never married86.9% Now married0.6% Separated0.0% Widowed2.7% DivorcedWomen who gave birth in the past 12 months Now married:
93.0% (585)Unmarried:
7.0% (44)
Women who did not give birth in the past 12 months Now married:
85.3% (1,790)Unmarried:
14.7% (308)
Marital status - Black or African American population 15 years and over
Males 47.3% Never married48.7% Now married0.0% Separated0.0% Widowed4.0% DivorcedFemales 21.2% Never married78.8% Now married0.0% Separated0.0% Widowed0.0% DivorcedWomen who gave birth in the past 12 months Now married:
100.0% (67)Unmarried:
0.0% (0)
Women who did not give birth in the past 12 months Now married:
75.8% (367)Unmarried:
24.2% (117)
Marital status - American Indian / Alaska Native population 15 years and over
Males 36.9% Never married63.1% Now married0.0% Separated0.0% Widowed0.0% DivorcedFemales 31.7% Never married68.3% Now married0.0% Separated0.0% Widowed0.0% DivorcedWomen who gave birth in the past 12 months Now married:
100.0% (40)Unmarried:
0.0% (0)
Women who did not give birth in the past 12 months Now married:
0.0% (0)Unmarried:
100.0% (19)
Marital status - Asian population 15 years and over
Males 74.4% Never married25.6% Now married0.0% Separated0.0% Widowed0.0% DivorcedFemales 14.2% Never married85.8% Now married0.0% Separated0.0% Widowed0.0% DivorcedWomen who gave birth in the past 12 months Now married:
100.0% (6)Unmarried:
0.0% (0)
Women who did not give birth in the past 12 months Now married:
83.1% (117)Unmarried:
16.9% (24)
Marital status - Native Hawaiian / Pacific Islander population 15 years and over
Males 51.4% Never married48.6% Now married0.0% Separated0.0% Widowed0.0% DivorcedFemales 0.0% Never married100.0% Now married0.0% Separated0.0% Widowed0.0% DivorcedWomen who gave birth in the past 12 months Now married:
100.0% (16)Unmarried:
0.0% (0)
Women who did not give birth in the past 12 months Now married:
100.0% (38)Unmarried:
0.0% (0)
Marital status - Other race population 15 years and over
Males 29.8% Never married70.2% Now married0.0% Separated0.0% Widowed0.0% DivorcedFemales 8.6% Never married91.4% Now married0.0% Separated0.0% Widowed0.0% DivorcedWomen who did not give birth in the past 12 months Now married:
91.4% (106)Unmarried:
8.6% (10)
Marital status - Two or more races population 15 years and over
Males 57.3% Never married42.7% Now married0.0% Separated0.0% Widowed0.0% DivorcedFemales 42.9% Never married52.6% Now married4.5% Separated0.0% Widowed0.0% DivorcedWomen who did not give birth in the past 12 months Now married:
57.1% (235)Unmarried:
42.9% (177)
Marital status - White alone, not Hispanic / Latino population 15 years and over
Males 37.0% Never married62.2% Now married0.1% Separated0.0% Widowed0.8% DivorcedFemales 9.4% Never married87.3% Now married0.0% Separated0.0% Widowed3.3% DivorcedWomen who gave birth in the past 12 months Now married:
92.1% (518)Unmarried:
7.9% (45)
Women who did not give birth in the past 12 months Now married:
85.5% (1,488)Unmarried:
14.5% (253)
Marital status - Hispanic or Latino population 15 years and over
Males 34.5% Never married65.5% Now married0.0% Separated0.0% Widowed0.0% DivorcedFemales 19.2% Never married79.0% Now married1.9% Separated0.0% Widowed0.0% DivorcedWomen who gave birth in the past 12 months Now married:
100.0% (101)Unmarried:
0.0% (0)
Women who did not give birth in the past 12 months Now married:
76.5% (551)Unmarried:
23.5% (169)
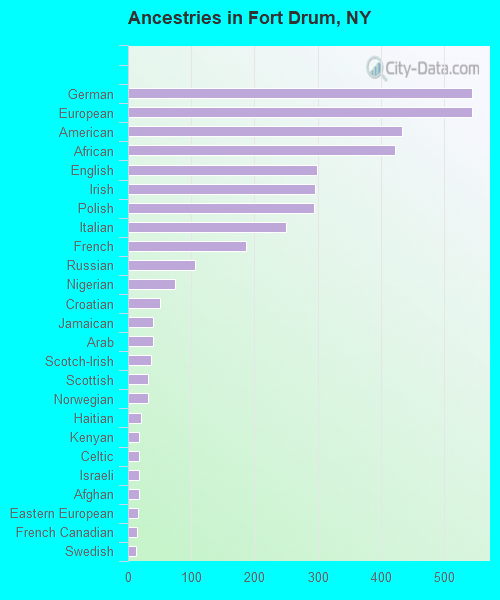
Ancestries in Fort Drum
544 7.5% German544 7.5% European434 6.0% American422 5.8% African299 4.1% English296 4.1% Irish294 4.1% Polish250 3.4% Italian186 2.6% French106 1.5% Russian75 1.0% Nigerian51 0.7% Croatian40 0.6% Jamaican39 0.5% Arab37 0.5% Scotch-Irish32 0.4% Scottish31 0.4% Norwegian20 0.3% Haitian18 0.2% Kenyan18 0.2% Celtic17 0.2% Israeli17 0.2% Afghan16 0.2% Eastern European14 0.2% French Canadian13 0.2% Swedish10 0.1% Syrian8 0.1% British6 0.08% Hungarian6 0.08% Greek5 0.07% Canadian4 0.06% Ukrainian3 0.04% Slovak2 0.03% Portuguese
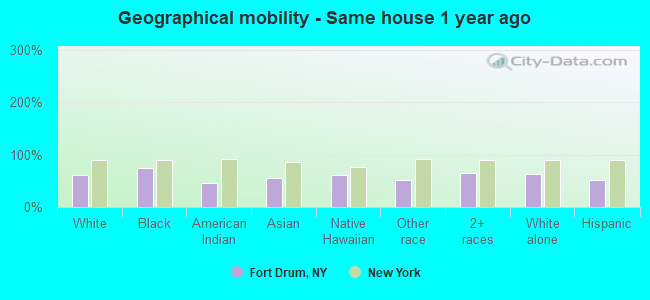
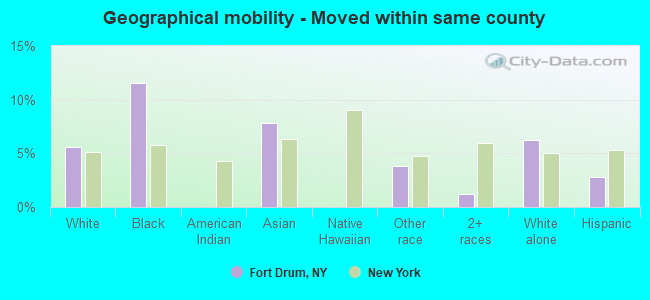
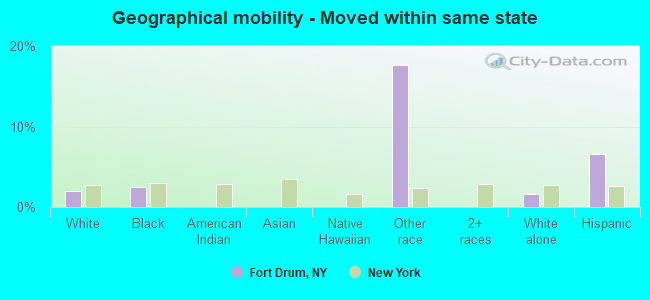
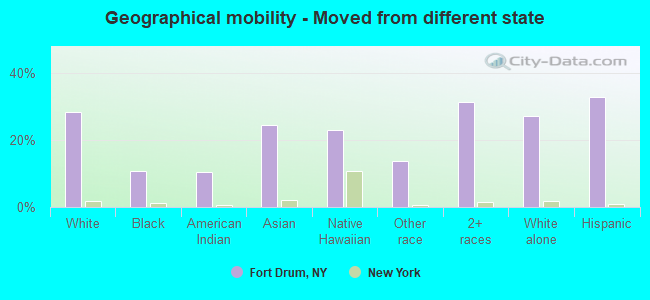
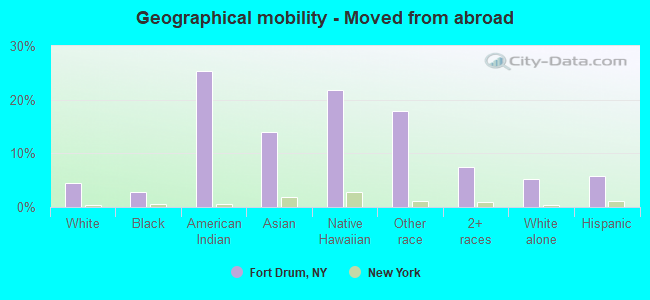
Geographical mobility in Fort Drum Same house 1 year ago 6,396 61.3% White (Caucasian)1,350 74.0% Black or African American86 46.5% American Indian / Alaska Native241 55.5% Asian103 60.3% Native Hawaiian / Pacific Islander422 51.7% Other race1,194 64.5% Two or more races5,522 63.4% White alone, not Hispanic / Latino1,701 51.2% Hispanic or LatinoMoved within same county 579 5.6% White / Caucasian211 11.6% Black or African American34 7.8% Asian31 3.8% Other race22 1.2% Two or more races541 6.2% White alone, not Hispanic / Latino92 2.8% Hispanic or LatinoMoved within same state 209 2.0% White / Caucasian45 2.5% Black or African American144 17.6% Other race146 1.7% White alone, not Hispanic / Latino217 6.6% Hispanic or LatinoMoved from different state 2,943 28.2% White / Caucasian196 10.8% Black or African American19 10.4% American Indian / Alaska Native107 24.5% Asian39 22.8% Native Hawaiian / Pacific Islander113 13.9% Other race580 31.3% Two or more races2,364 27.1% White alone, not Hispanic / Latino1,091 32.9% Hispanic or LatinoMoved from abroad 476 4.6% White51 2.8% Black or African American47 25.3% American Indian / Alaska Native61 14.0% Asian37 21.9% Native Hawaiian / Pacific Islander146 17.8% Other race139 7.5% Two or more races453 5.2% White alone, not Hispanic / Latino193 5.8% Hispanic or Latino
Children Nativity (place of birth) in Fort Drum
Children under 6 years - Living with two parents Both parents native 2,376 100.0% NativeBoth parents foreign-born 230 100.0% NativeOne native, one foreign-born parent 90 100.0% NativeChildren under 6 years - Living with one parent Native parent 141 100.0% NativeForeign-born parent 40 100.0% NativeChildren 6 to 17 years - Living with two parents Both parents native 1,680 100.0% NativeBoth parents foreign-born 20 30.6% Native45 69.4% Foreign-bornOne native, one foreign-born parent 351 100.0% NativeChildren 6 to 17 years - Living with one parent Native parent 33 100.0% NativeForeign-born parent 72 50.4% Native71 49.6% Foreign-born
Grandparents responsible for own grandchildren in Fort Drum
Grandparents (30 to 59 years) White / Caucasian 22 100.0% Not responsible for grandchildrenHispanic or Latino 23 100.0% Not responsible for grandchildren
Grandparents (60 years and over)