Races in Fort Walton Beach, Florida (FL) Detailed Stats
Data:
Races - White alone (%)
Races - White alone (% change since 2000)
Races - Black alone (%)
Races - Black alone (% change since 2000)
Races - American Indian alone (%)
Races - American Indian alone (% change since 2000)
Races - Asian alone (%)
Races - Asian alone (% change since 2000)
Races - Hispanic (%)
Races - Hispanic (% change since 2000)
Races - Native Hawaiian and Other Pacific Islander alone (%)
Races - Native Hawaiian and Other Pacific Islander alone (% change since 2000)
Races - Two or more races(%)
Races - Two or more races(% change since 2000)
Races - Other race alone (%)
Races - Other race alone (% change since 2000)
Racial diversity
Place of birth - Born in state of residence (%)
Place of birth - Born in state of residence (%) - White
Place of birth - Born in state of residence (%) - Black or African American
Place of birth - Born in state of residence (%) - Asian
Place of birth - Born in state of residence (%) - Hispanic or Latino
Place of birth - Born in state of residence (%) - American Indian and Alaska Native
Place of birth - Born in state of residence (%) - Multirace
Place of birth - Born in state of residence (%) - Other Race
Place of birth - Born in other state (%)
Place of birth - Born in other state (%) - White
Place of birth - Born in other state (%) - Black or African American
Place of birth - Born in other state (%) - Asian
Place of birth - Born in other state (%) - Hispanic or Latino
Place of birth - Born in other state (%) - American Indian and Alaska Native
Place of birth - Born in other state (%) - Multirace
Place of birth - Born in other state (%) - Other Race
Place of birth - Native, outside of US (%)
Place of birth - Native, outside of US (%) - White
Place of birth - Native, outside of US (%) - Black or African American
Place of birth - Native, outside of US (%) - Asian
Place of birth - Native, outside of US (%) - Hispanic or Latino
Place of birth - Native, outside of US (%) - American Indian and Alaska Native
Place of birth - Native, outside of US (%) - Multirace
Place of birth - Native, outside of US (%) - Other Race
Place of birth - Foreign born (%)
Place of birth - Foreign born (%) - White
Place of birth - Foreign born (%) - Black or African American
Place of birth - Foreign born (%) - Asian
Place of birth - Foreign born (%) - Hispanic or Latino
Place of birth - Foreign born (%) - American Indian and Alaska Native
Place of birth - Foreign born (%) - Multirace
Place of birth - Foreign born (%) - Other Race
Residents speaking English at home (%)
Residents speaking English at home - Born in the United States (%)
Residents speaking English at home - Native, born elsewhere (%)
Residents speaking English at home - Foreign born (%)
Residents speaking Spanish at home (%)
Residents speaking Spanish at home - Born in the United States (%)
Residents speaking Spanish at home - Native, born elsewhere (%)
Residents speaking Spanish at home - Foreign born (%)
Residents speaking other language at home (%)
Residents speaking other language at home - Born in the United States (%)
Residents speaking other language at home - Native, born elsewhere (%)
Residents speaking other language at home - Foreign born (%)
Marital status - Never married (%)
Marital status - Now married (%)
Marital status - Separated (%)
Marital status - Widowed (%)
Marital status - Divorced (%)
Ancestries Reported - Arab (%)
Ancestries Reported - Czech (%)
Ancestries Reported - Danish (%)
Ancestries Reported - Dutch (%)
Ancestries Reported - English (%)
Ancestries Reported - French (%)
Ancestries Reported - French Canadian (%)
Ancestries Reported - German (%)
Ancestries Reported - Greek (%)
Ancestries Reported - Hungarian (%)
Ancestries Reported - Irish (%)
Ancestries Reported - Italian (%)
Ancestries Reported - Lithuanian (%)
Ancestries Reported - Norwegian (%)
Ancestries Reported - Polish (%)
Ancestries Reported - Portuguese (%)
Ancestries Reported - Russian (%)
Ancestries Reported - Scotch-Irish (%)
Ancestries Reported - Scottish (%)
Ancestries Reported - Slovak (%)
Ancestries Reported - Subsaharan African (%)
Ancestries Reported - Swedish (%)
Ancestries Reported - Swiss (%)
Ancestries Reported - Ukrainian (%)
Ancestries Reported - United States (%)
Ancestries Reported - Welsh (%)
Ancestries Reported - West Indian (%)
Ancestries Reported - Other (%)
Geographical mobility - Same house 1 year ago (%)
Geographical mobility - Same house 1 year ago (%) - White
Geographical mobility - Same house 1 year ago (%) - Black or African American
Geographical mobility - Same house 1 year ago (%) - Asian
Geographical mobility - Same house 1 year ago (%) - Hispanic or Latino
Geographical mobility - Same house 1 year ago (%) - American Indian and Alaska Native
Geographical mobility - Same house 1 year ago (%) - Multirace
Geographical mobility - Same house 1 year ago (%) - Other Race
Geographical mobility - Moved within same county (%)
Geographical mobility - Moved within same county (%) - White
Geographical mobility - Moved within same county (%) - Black or African American
Geographical mobility - Moved within same county (%) - Asian
Geographical mobility - Moved within same county (%) - Hispanic or Latino
Geographical mobility - Moved within same county (%) - American Indian and Alaska Native
Geographical mobility - Moved within same county (%) - Multirace
Geographical mobility - Moved within same county (%) - Other Race
Geographical mobility - Moved from different county within same state (%)
Geographical mobility - Moved from different county within same state (%) - White
Geographical mobility - Moved from different county within same state (%) - Black or African American
Geographical mobility - Moved from different county within same state (%) - Asian
Geographical mobility - Moved from different county within same state (%) - Hispanic or Latino
Geographical mobility - Moved from different county within same state (%) - American Indian and Alaska Native
Geographical mobility - Moved from different county within same state (%) - Multirace
Geographical mobility - Moved from different county within same state (%) - Other Race
Geographical mobility - Moved from different state (%)
Geographical mobility - Moved from different state (%) - White
Geographical mobility - Moved from different state (%) - Black or African American
Geographical mobility - Moved from different state (%) - Asian
Geographical mobility - Moved from different state (%) - Hispanic or Latino
Geographical mobility - Moved from different state (%) - American Indian and Alaska Native
Geographical mobility - Moved from different state (%) - Multirace
Geographical mobility - Moved from different state (%) - Other Race
Geographical mobility - Moved from abroad (%)
Geographical mobility - Moved from abroad (%) - White
Geographical mobility - Moved from abroad (%) - Black or African American
Geographical mobility - Moved from abroad (%) - Asian
Geographical mobility - Moved from abroad (%) - Hispanic or Latino
Geographical mobility - Moved from abroad (%) - American Indian and Alaska Native
Geographical mobility - Moved from abroad (%) - Multirace
Geographical mobility - Moved from abroad (%) - Other Race
Place of birth for the foreign-born population - Ireland (%)
Place of birth for the foreign-born population - Denmark (%)
Place of birth for the foreign-born population - Norway (%)
Place of birth for the foreign-born population - Sweden (%)
Place of birth for the foreign-born population - United Kingdom (%)
Place of birth for the foreign-born population - England (%)
Place of birth for the foreign-born population - Scotland (%)
Place of birth for the foreign-born population - Other Northern Europe (%)
Place of birth for the foreign-born population - Austria (%)
Place of birth for the foreign-born population - Belgium (%)
Place of birth for the foreign-born population - France (%)
Place of birth for the foreign-born population - Germany (%)
Place of birth for the foreign-born population - Netherlands (%)
Place of birth for the foreign-born population - Switzerland (%)
Place of birth for the foreign-born population - Other Western Europe (%)
Place of birth for the foreign-born population - Greece (%)
Place of birth for the foreign-born population - Italy (%)
Place of birth for the foreign-born population - Portugal (%)
Place of birth for the foreign-born population - Spain (%)
Place of birth for the foreign-born population - Other Southern Europe (%)
Place of birth for the foreign-born population - Albania (%)
Place of birth for the foreign-born population - Belarus (%)
Place of birth for the foreign-born population - Bosnia and Herzegovina (%)
Place of birth for the foreign-born population - Bulgaria (%)
Place of birth for the foreign-born population - Croatia (%)
Place of birth for the foreign-born population - Czechoslovakia (%)
Place of birth for the foreign-born population - Hungary (%)
Place of birth for the foreign-born population - Latvia (%)
Place of birth for the foreign-born population - Lithuania (%)
Place of birth for the foreign-born population - North Macedonia (Macedonia) (%)
Place of birth for the foreign-born population - Moldova (%)
Place of birth for the foreign-born population - Poland (%)
Place of birth for the foreign-born population - Romania (%)
Place of birth for the foreign-born population - Russia (%)
Place of birth for the foreign-born population - Serbia (%)
Place of birth for the foreign-born population - Ukraine (%)
Place of birth for the foreign-born population - Other Eastern Europe (%)
Place of birth for the foreign-born population - China (%)
Place of birth for the foreign-born population - Hong Kong (%)
Place of birth for the foreign-born population - Taiwan (%)
Place of birth for the foreign-born population - Japan (%)
Place of birth for the foreign-born population - Korea (%)
Place of birth for the foreign-born population - Other Eastern Asia (%)
Place of birth for the foreign-born population - Afghanistan (%)
Place of birth for the foreign-born population - Bangladesh (%)
Place of birth for the foreign-born population - India (%)
Place of birth for the foreign-born population - Iran (%)
Place of birth for the foreign-born population - Kazakhstan (%)
Place of birth for the foreign-born population - Nepal (%)
Place of birth for the foreign-born population - Pakistan (%)
Place of birth for the foreign-born population - Sri Lanka (%)
Place of birth for the foreign-born population - Uzbekistan (%)
Place of birth for the foreign-born population - Other South Central Asia (%)
Place of birth for the foreign-born population - Burma (%)
Place of birth for the foreign-born population - Cambodia (%)
Place of birth for the foreign-born population - Indonesia (%)
Place of birth for the foreign-born population - Laos (%)
Place of birth for the foreign-born population - Malaysia (%)
Place of birth for the foreign-born population - Philippines (%)
Place of birth for the foreign-born population - Singapore (%)
Place of birth for the foreign-born population - Thailand (%)
Place of birth for the foreign-born population - Vietnam (%)
Place of birth for the foreign-born population - Other South Eastern Asia (%)
Place of birth for the foreign-born population - Armenia (%)
Place of birth for the foreign-born population - Iraq (%)
Place of birth for the foreign-born population - Israel (%)
Place of birth for the foreign-born population - Jordan (%)
Place of birth for the foreign-born population - Kuwait (%)
Place of birth for the foreign-born population - Lebanon (%)
Place of birth for the foreign-born population - Saudi Arabia (%)
Place of birth for the foreign-born population - Syria (%)
Place of birth for the foreign-born population - Turkey (%)
Place of birth for the foreign-born population - Yemen (%)
Place of birth for the foreign-born population - Other Western Asia (%)
Place of birth for the foreign-born population - Eritrea (%)
Place of birth for the foreign-born population - Ethiopia (%)
Place of birth for the foreign-born population - Kenya (%)
Place of birth for the foreign-born population - Somalia (%)
Place of birth for the foreign-born population - Uganda (%)
Place of birth for the foreign-born population - Zimbabwe (%)
Place of birth for the foreign-born population - Other Eastern Africa (%)
Place of birth for the foreign-born population - Cameroon (%)
Place of birth for the foreign-born population - Congo (%)
Place of birth for the foreign-born population - Democratic Republic of Congo (Zaire) (%)
Place of birth for the foreign-born population - Other Middle Africa (%)
Place of birth for the foreign-born population - Egypt (%)
Place of birth for the foreign-born population - Morocco (%)
Place of birth for the foreign-born population - Sudan (%)
Place of birth for the foreign-born population - Other Northern Africa (%)
Place of birth for the foreign-born population - South Africa (%)
Place of birth for the foreign-born population - Other Southern Africa (%)
Place of birth for the foreign-born population - Cabo Verde (%)
Place of birth for the foreign-born population - Ghana (%)
Place of birth for the foreign-born population - Liberia (%)
Place of birth for the foreign-born population - Nigeria (%)
Place of birth for the foreign-born population - Senegal (%)
Place of birth for the foreign-born population - Sierra Leone (%)
Place of birth for the foreign-born population - Other Western Africa (%)
Place of birth for the foreign-born population - Australia (%)
Place of birth for the foreign-born population - New Zealand (%)
Place of birth for the foreign-born population - Fiji (%)
Place of birth for the foreign-born population - Micronesia (%)
Place of birth for the foreign-born population - Bahamas (%)
Place of birth for the foreign-born population - Barbados (%)
Place of birth for the foreign-born population - Cuba (%)
Place of birth for the foreign-born population - Dominica (%)
Place of birth for the foreign-born population - Dominican Republic (%)
Place of birth for the foreign-born population - Grenada (%)
Place of birth for the foreign-born population - Haiti (%)
Place of birth for the foreign-born population - Jamaica (%)
Place of birth for the foreign-born population - St. Vincent and the Grenadines (%)
Place of birth for the foreign-born population - Trinidad and Tobago (%)
Place of birth for the foreign-born population - West Indies (%)
Place of birth for the foreign-born population - Other Caribbean (%)
Place of birth for the foreign-born population - Belize (%)
Place of birth for the foreign-born population - Costa Rica (%)
Place of birth for the foreign-born population - El Salvador (%)
Place of birth for the foreign-born population - Guatemala (%)
Place of birth for the foreign-born population - Honduras (%)
Place of birth for the foreign-born population - Mexico (%)
Place of birth for the foreign-born population - Nicaragua (%)
Place of birth for the foreign-born population - Panama (%)
Place of birth for the foreign-born population - Other Central America (%)
Place of birth for the foreign-born population - Argentina (%)
Place of birth for the foreign-born population - Bolivia (%)
Place of birth for the foreign-born population - Brazil (%)
Place of birth for the foreign-born population - Chile (%)
Place of birth for the foreign-born population - Colombia (%)
Place of birth for the foreign-born population - Ecuador (%)
Place of birth for the foreign-born population - Guyana (%)
Place of birth for the foreign-born population - Peru (%)
Place of birth for the foreign-born population - Uruguay (%)
Place of birth for the foreign-born population - Venezuela (%)
Place of birth for the foreign-born population - Other South America (%)
Place of birth for the foreign-born population - Canada (%)
Place of birth for the foreign-born population - Other Northern America (%)
Place of birth for the foreign-born population - Other (%)
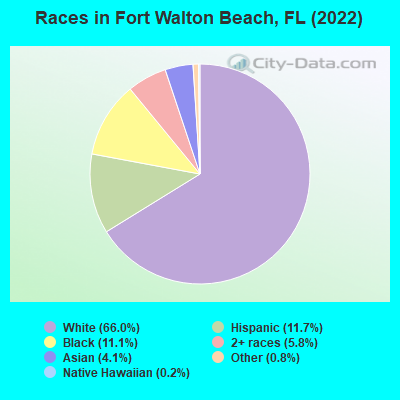
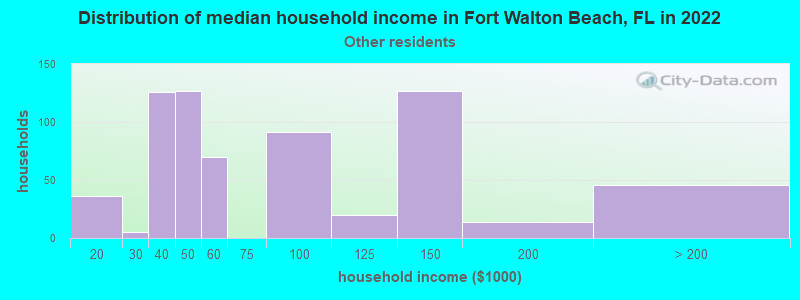
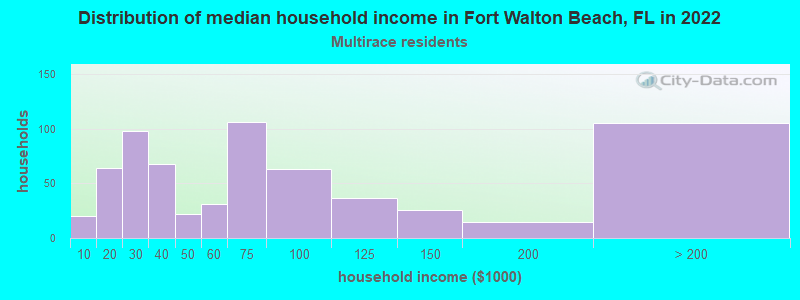
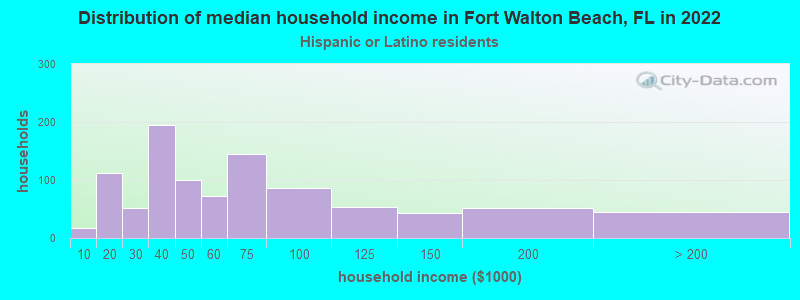
According to 2022 data, the most numerous races in Fort Walton Beach, FL are White alone (14,094 residents), Hispanic (2,493 residents), and Black alone (2,368 residents). 87.5% of Fort Walton Beach residents speak English at home. 9.6% of Fort Walton Beach, FL residents are foreign-born (4.1% born in Latin America, 3.3% born in Asia, 1.6% born in Europe), which is 119.8% less than the foreign-born rate of 21.0% across the entire state of Florida.
Race distribution in Fort Walton Beach
2000 2022
10,458,509 65.4% White alone 2,682,715 16.8% Hispanic 2,264,268 14.2% Black alone 261,693 1.6% Asian alone 236,954 1.5% Two or more races 42,358 0.3% American Indian alone 28,994 0.2% Other race alone 6,887 0.04% Native Hawaiian and Other
11,309,403 50.8% White alone 6,025,039 27.1% Hispanic 3,241,015 14.6% Black alone 861,630 3.9% Two or more races 623,692 2.8% Asian alone 152,054 0.7% Other race alone 22,504 0.1% American Indian alone 9,486 0.04% Native Hawaiian and Other
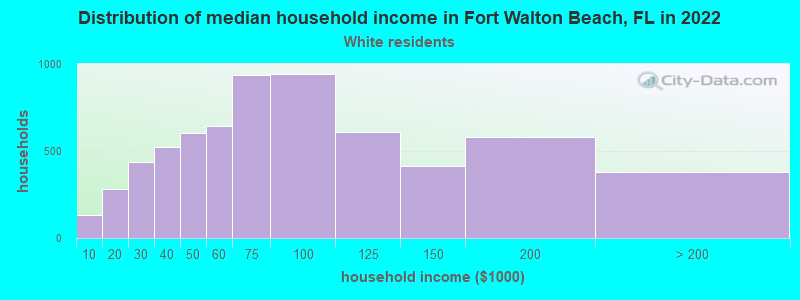
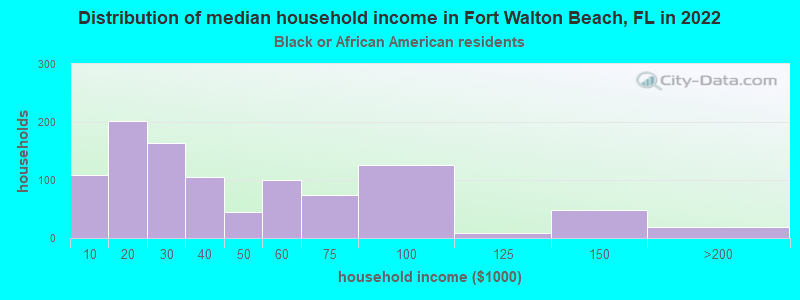
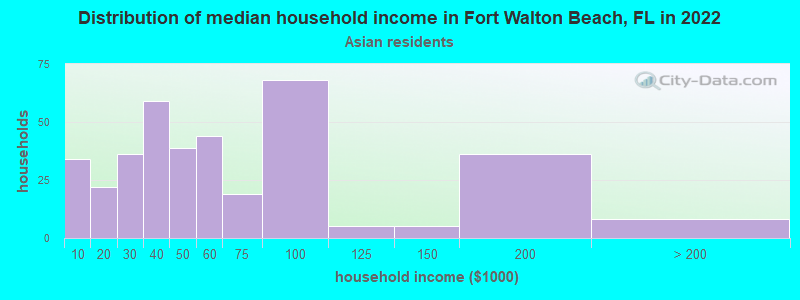
Income and house value in Fort Walton Beach Median household income in 2022 $67,596 White non-Hispanic householders$37,956 Black householders$58,157 Asian householders$58,427 Some other race householders$61,371 Two or more races householders$58,265 Hispanic or Latino race householdersMedian 2022 house value $329,785 White Non-Hispanic householders$273,462 Black or African American householders$305,700 American Indian or Alaska Native householders $320,151 Asian householders$323,857 Some other race householders$257,529 Two or more races householders$306,811 Hispanic or Latino householders
Median age by race in Fort Walton Beach
45.3 Median age for White residents44.0 48.4 31.7 Median age for Black or African American residents36.1 28.1 -598,566,307.6 Median age for American Indian / Alaska Native residents-611,418,047.3 -594,925,633.7 37.8 Median age for Asian residents42.5 35.3 15.6 Median age for Native Hawaiian / Pacific Islander residents15.8 11.0 30.9 Median age for Other race residents36.9 23.8 28.5 Median age for Two or more races residents22.2 37.2 46.0 Median age for White alone residents44.1 48.1 33.2 Median age for Hispanic or Latino residents32.2 32.9
Owner/renter occupied households by race in Fort Walton Beach
House owners and renters - White residents 4,542 70.4% Owner occupied1,909 29.6% Renter occupiedHouse owners and renters - Black or African American residents 430 39.6% Owner occupied656 60.4% Renter occupiedHouse owners and renters - American Indian / Alaska Native residents 13 100.0% Owner occupiedHouse owners and renters - Asian residents 263 65.8% Owner occupied136 34.2% Renter occupiedHouse owners and renters - Native Hawaiian / Pacific Islander residents 9 100.0% Renter occupiedHouse owners and renters - Other race residents 220 39.2% Owner occupied342 60.8% Renter occupiedHouse owners and renters - Two or more races residents 332 47.5% Owner occupied367 52.5% Renter occupiedHouse owners and renters - White alone residents 4,452 71.4% Owner occupied1,785 28.6% Renter occupiedHouse owners and renters - Hispanic or Latino residents 383 39.9% Owner occupied576 60.1% Renter occupied
Language usage in Fort Walton Beach
English speakers - Total 87.5% of residents of Fort Walton Beach speak English at home.
7.9% of residents speak Spanish at home 855 53.8% Speak English very well734 46.2% Speak English less than very well4.6% of residents speak other language at home 409 43.9% Speak English very well523 56.1% Speak English less than very well
English speakers - Born in the United States 96.0% of residents of Fort Walton Beach speak English at home.
3.0% of residents speak Spanish at home 331 99.4% Speak English very well2 0.6% Speak English less than very well1.0% of residents speak other language at home 73 62.9% Speak English very well43 37.1% Speak English less than very well
English speakers - Native, born elsewhere 68.5% of residents of Fort Walton Beach speak English at home.
30.7% of residents speak Spanish at home 209 74.4% Speak English very well72 25.6% Speak English less than very well2.4% of residents speak other language at home 22 100.0% Speak English very well
English speakers - Foreign-born 24.2% of residents of Fort Walton Beach speak English at home.
36.1% of residents speak Spanish at home 84 12.2% Speak English very well607 87.8% Speak English less than very well40.4% of residents speak other language at home 257 33.2% Speak English very well517 66.8% Speak English less than very well
White (Caucasian) - Speak only English Native:
98.1% (13,295)Foreign-born:
34.1% (175)
White (Caucasian) - Speak another language Native:
1.9% (259)Foreign-born:
66.7% (342)
Black or African American - Speak only English Native:
99.4% (1,959)Foreign-born:
97.0% (109)
Asian - Speak only English Native:
100.0% (281)Foreign-born:
9.5% (59)
Asian - Speak another language Native:
26.9% (75)Foreign-born:
89.1% (556)
Other race - Speak only English Native:
16.7% (114)Foreign-born:
4.8% (28)
Other race - Speak another language Native:
96.5% (661)Foreign-born:
94.7% (547)
Two or more races - Speak only English Native:
86.7% (1,533)Foreign-born:
9.2% (9)
Two or more races - Speak another language Native:
12.6% (223)Foreign-born:
81.7% (76)
White alone - Speak only English Native:
98.9% (13,059)Foreign-born:
54.2% (181)
White alone - Speak another language Native:
1.3% (176)Foreign-born:
44.0% (147)
Hispanic or Latino - Speak only English Native:
56.5% (932)Foreign-born:
5.7% (41)
Hispanic or Latino - Speak another language Native:
43.3% (714)Foreign-born:
91.4% (656)
Foreign-born residents in Fort Walton Beach 2,041 residents are foreign born (4.1% Latin America , 3.3% Asia , 1.6% Europe ).
This city:
9.6%Florida:
21.1%
Marital status for residents in Fort Walton Beach Marital status - White (Caucasian) population 15 years and over
Males 32.3% Never married51.3% Now married0.7% Separated2.2% Widowed13.4% DivorcedFemales 20.1% Never married47.5% Now married3.5% Separated11.3% Widowed17.5% DivorcedWomen who gave birth in the past 12 months Now married:
89.4% (192)Unmarried:
10.6% (23)
Women who did not give birth in the past 12 months Now married:
52.4% (1,505)Unmarried:
47.6% (1,368)
Marital status - Black or African American population 15 years and over
Males 45.3% Never married28.5% Now married0.7% Separated0.2% Widowed25.4% DivorcedFemales 51.6% Never married27.7% Now married5.0% Separated6.5% Widowed9.1% DivorcedWomen who gave birth in the past 12 months Now married:
12.3% (9)Unmarried:
87.7% (65)
Women who did not give birth in the past 12 months Now married:
30.3% (155)Unmarried:
69.7% (356)
Marital status - Asian population 15 years and over
Males 29.1% Never married50.0% Now married0.0% Separated18.1% Widowed2.8% DivorcedFemales 24.5% Never married40.6% Now married0.0% Separated28.2% Widowed6.7% DivorcedWomen who did not give birth in the past 12 months Now married:
44.7% (99)Unmarried:
55.3% (123)
Marital status - Native Hawaiian / Pacific Islander population 15 years and over
Males 78.9% Never married0.0% Now married0.0% Separated0.0% Widowed21.1% DivorcedFemales 100.0% Never married0.0% Now married0.0% Separated0.0% Widowed0.0% DivorcedWomen who did not give birth in the past 12 months Now married:
0.0% (0)Unmarried:
100.0% (40)
Marital status - Other race population 15 years and over
Males 44.4% Never married52.5% Now married0.0% Separated0.0% Widowed3.1% DivorcedFemales 44.7% Never married47.3% Now married5.7% Separated2.3% Widowed0.0% DivorcedWomen who did not give birth in the past 12 months Now married:
49.0% (173)Unmarried:
51.0% (180)
Marital status - Two or more races population 15 years and over
Males 34.3% Never married40.8% Now married1.9% Separated10.6% Widowed12.3% DivorcedFemales 28.0% Never married36.8% Now married2.1% Separated10.3% Widowed22.9% DivorcedWomen who gave birth in the past 12 months Now married:
43.5% (11)Unmarried:
56.5% (14)
Women who did not give birth in the past 12 months Now married:
50.6% (136)Unmarried:
49.4% (133)
Marital status - White alone, not Hispanic / Latino population 15 years and over
Males 33.0% Never married50.9% Now married0.6% Separated2.3% Widowed13.2% DivorcedFemales 20.4% Never married47.5% Now married3.2% Separated11.1% Widowed17.7% DivorcedWomen who gave birth in the past 12 months Now married:
88.7% (180)Unmarried:
11.3% (23)
Women who did not give birth in the past 12 months Now married:
50.9% (1,383)Unmarried:
49.1% (1,333)
Marital status - Hispanic or Latino population 15 years and over
Males 31.7% Never married55.0% Now married1.2% Separated6.3% Widowed5.8% DivorcedFemales 27.6% Never married47.9% Now married6.9% Separated9.8% Widowed7.8% DivorcedWomen who gave birth in the past 12 months Now married:
94.1% (17)Unmarried:
5.9% (1)
Women who did not give birth in the past 12 months Now married:
59.2% (328)Unmarried:
40.8% (226)
Ancestries in Fort Walton Beach
1,607 13.9% English1,451 12.5% American676 5.8% German589 5.1% Irish460 4.0% Scottish316 2.7% Italian267 2.3% European209 1.8% Polish163 1.4% British142 1.2% Russian141 1.2% Greek121 1.0% Portuguese118 1.0% Scotch-Irish70 0.6% French68 0.6% Jamaican56 0.5% French Canadian54 0.5% Finnish50 0.4% Welsh45 0.4% Swedish43 0.4% Turkish42 0.4% Arab35 0.3% Dutch31 0.3% Northern European29 0.3% Brazilian27 0.2% Belgian24 0.2% Canadian24 0.2% Scandinavian18 0.2% Liberian15 0.1% Estonian13 0.1% Croatian10 0.09% Serbian8 0.07% Danish7 0.06% Norwegian7 0.06% Romanian5 0.04% Syrian4 0.03% Australian4 0.03% Bulgarian1 0.01% African
Geographical mobility in Fort Walton Beach Same house 1 year ago 12,887 88.4% White (Caucasian)1,828 77.0% Black or African American16 100.0% American Indian / Alaska Native838 81.1% Asian92 95.1% Native Hawaiian / Pacific Islander1,319 85.7% Other race1,434 75.9% Two or more races12,497 89.0% White alone, not Hispanic / Latino2,138 87.4% Hispanic or LatinoMoved within same county 721 5.0% White / Caucasian120 5.1% Black or African American6 0.6% Asian134 8.7% Other race279 14.8% Two or more races666 4.7% White alone, not Hispanic / Latino219 9.0% Hispanic or LatinoMoved within same state 378 2.6% White / Caucasian90 3.8% Black or African American62 6.0% Asian33 2.1% Other race108 5.7% Two or more races355 2.5% White alone, not Hispanic / Latino91 3.7% Hispanic or LatinoMoved from different state 641 4.4% White / Caucasian387 16.3% Black or African American27 2.6% Asian14 14.3% Native Hawaiian / Pacific Islander24 1.5% Other race77 4.1% Two or more races598 4.3% White alone, not Hispanic / Latino37 1.5% Hispanic or LatinoMoved from abroad 50 0.3% White31 1.3% Black or African American113 11.0% Asian13 0.8% Other race20 0.1% White alone, not Hispanic / Latino28 1.1% Hispanic or Latino
Children Nativity (place of birth) in Fort Walton Beach
Children under 6 years - Living with two parents Both parents native 619 100.0% NativeBoth parents foreign-born 70 100.0% NativeOne native, one foreign-born parent 296 100.0% NativeChildren under 6 years - Living with one parent Native parent 526 100.0% NativeForeign-born parent 159 100.0% NativeChildren 6 to 17 years - Living with two parents Both parents native 1,608 97.9% Native34 2.1% Foreign-bornBoth parents foreign-born 151 84.9% Native27 15.1% Foreign-bornOne native, one foreign-born parent 146 100.0% NativeChildren 6 to 17 years - Living with one parent Native parent 618 100.0% NativeForeign-born parent 276 52.5% Native250 47.5% Foreign-born
Grandparents responsible for own grandchildren in Fort Walton Beach
Grandparents (30 to 59 years) White / Caucasian 36 35.7% Responsible for grandchildren65 64.3% Not responsible for grandchildrenBlack or African American 33 76.1% Responsible for grandchildren10 23.9% Not responsible for grandchildrenOther race 13 100.0% Not responsible for grandchildrenWhite alone, not Hispanic / Latino 14 32.4% Responsible for grandchildren29 67.6% Not responsible for grandchildrenHispanic or Latino 24 72.1% Responsible for grandchildren9 27.9% Not responsible for grandchildrenGrandparents (60 years and over) White / Caucasian 76 43.3% Responsible for grandchildren99 56.7% Not responsible for grandchildrenBlack or African American 11 100.0% Not responsible for grandchildrenWhite alone, not Hispanic / Latino 76 43.3% Responsible for grandchildren99 56.7% Not responsible for grandchildrenHispanic or Latino 22 100.0% Not responsible for grandchildren