Races in Fruit Cove, Florida (FL) Detailed Stats
Data:
Races - White alone (%)
Races - White alone (% change since 2000)
Races - Black alone (%)
Races - Black alone (% change since 2000)
Races - American Indian alone (%)
Races - American Indian alone (% change since 2000)
Races - Asian alone (%)
Races - Asian alone (% change since 2000)
Races - Hispanic (%)
Races - Hispanic (% change since 2000)
Races - Native Hawaiian and Other Pacific Islander alone (%)
Races - Native Hawaiian and Other Pacific Islander alone (% change since 2000)
Races - Two or more races(%)
Races - Two or more races(% change since 2000)
Races - Other race alone (%)
Races - Other race alone (% change since 2000)
Racial diversity
Place of birth - Born in state of residence (%)
Place of birth - Born in state of residence (%) - White
Place of birth - Born in state of residence (%) - Black or African American
Place of birth - Born in state of residence (%) - Asian
Place of birth - Born in state of residence (%) - Hispanic or Latino
Place of birth - Born in state of residence (%) - American Indian and Alaska Native
Place of birth - Born in state of residence (%) - Multirace
Place of birth - Born in state of residence (%) - Other Race
Place of birth - Born in other state (%)
Place of birth - Born in other state (%) - White
Place of birth - Born in other state (%) - Black or African American
Place of birth - Born in other state (%) - Asian
Place of birth - Born in other state (%) - Hispanic or Latino
Place of birth - Born in other state (%) - American Indian and Alaska Native
Place of birth - Born in other state (%) - Multirace
Place of birth - Born in other state (%) - Other Race
Place of birth - Native, outside of US (%)
Place of birth - Native, outside of US (%) - White
Place of birth - Native, outside of US (%) - Black or African American
Place of birth - Native, outside of US (%) - Asian
Place of birth - Native, outside of US (%) - Hispanic or Latino
Place of birth - Native, outside of US (%) - American Indian and Alaska Native
Place of birth - Native, outside of US (%) - Multirace
Place of birth - Native, outside of US (%) - Other Race
Place of birth - Foreign born (%)
Place of birth - Foreign born (%) - White
Place of birth - Foreign born (%) - Black or African American
Place of birth - Foreign born (%) - Asian
Place of birth - Foreign born (%) - Hispanic or Latino
Place of birth - Foreign born (%) - American Indian and Alaska Native
Place of birth - Foreign born (%) - Multirace
Place of birth - Foreign born (%) - Other Race
Residents speaking English at home (%)
Residents speaking English at home - Born in the United States (%)
Residents speaking English at home - Native, born elsewhere (%)
Residents speaking English at home - Foreign born (%)
Residents speaking Spanish at home (%)
Residents speaking Spanish at home - Born in the United States (%)
Residents speaking Spanish at home - Native, born elsewhere (%)
Residents speaking Spanish at home - Foreign born (%)
Residents speaking other language at home (%)
Residents speaking other language at home - Born in the United States (%)
Residents speaking other language at home - Native, born elsewhere (%)
Residents speaking other language at home - Foreign born (%)
Marital status - Never married (%)
Marital status - Now married (%)
Marital status - Separated (%)
Marital status - Widowed (%)
Marital status - Divorced (%)
Ancestries Reported - Arab (%)
Ancestries Reported - Czech (%)
Ancestries Reported - Danish (%)
Ancestries Reported - Dutch (%)
Ancestries Reported - English (%)
Ancestries Reported - French (%)
Ancestries Reported - French Canadian (%)
Ancestries Reported - German (%)
Ancestries Reported - Greek (%)
Ancestries Reported - Hungarian (%)
Ancestries Reported - Irish (%)
Ancestries Reported - Italian (%)
Ancestries Reported - Lithuanian (%)
Ancestries Reported - Norwegian (%)
Ancestries Reported - Polish (%)
Ancestries Reported - Portuguese (%)
Ancestries Reported - Russian (%)
Ancestries Reported - Scotch-Irish (%)
Ancestries Reported - Scottish (%)
Ancestries Reported - Slovak (%)
Ancestries Reported - Subsaharan African (%)
Ancestries Reported - Swedish (%)
Ancestries Reported - Swiss (%)
Ancestries Reported - Ukrainian (%)
Ancestries Reported - United States (%)
Ancestries Reported - Welsh (%)
Ancestries Reported - West Indian (%)
Ancestries Reported - Other (%)
Geographical mobility - Same house 1 year ago (%)
Geographical mobility - Same house 1 year ago (%) - White
Geographical mobility - Same house 1 year ago (%) - Black or African American
Geographical mobility - Same house 1 year ago (%) - Asian
Geographical mobility - Same house 1 year ago (%) - Hispanic or Latino
Geographical mobility - Same house 1 year ago (%) - American Indian and Alaska Native
Geographical mobility - Same house 1 year ago (%) - Multirace
Geographical mobility - Same house 1 year ago (%) - Other Race
Geographical mobility - Moved within same county (%)
Geographical mobility - Moved within same county (%) - White
Geographical mobility - Moved within same county (%) - Black or African American
Geographical mobility - Moved within same county (%) - Asian
Geographical mobility - Moved within same county (%) - Hispanic or Latino
Geographical mobility - Moved within same county (%) - American Indian and Alaska Native
Geographical mobility - Moved within same county (%) - Multirace
Geographical mobility - Moved within same county (%) - Other Race
Geographical mobility - Moved from different county within same state (%)
Geographical mobility - Moved from different county within same state (%) - White
Geographical mobility - Moved from different county within same state (%) - Black or African American
Geographical mobility - Moved from different county within same state (%) - Asian
Geographical mobility - Moved from different county within same state (%) - Hispanic or Latino
Geographical mobility - Moved from different county within same state (%) - American Indian and Alaska Native
Geographical mobility - Moved from different county within same state (%) - Multirace
Geographical mobility - Moved from different county within same state (%) - Other Race
Geographical mobility - Moved from different state (%)
Geographical mobility - Moved from different state (%) - White
Geographical mobility - Moved from different state (%) - Black or African American
Geographical mobility - Moved from different state (%) - Asian
Geographical mobility - Moved from different state (%) - Hispanic or Latino
Geographical mobility - Moved from different state (%) - American Indian and Alaska Native
Geographical mobility - Moved from different state (%) - Multirace
Geographical mobility - Moved from different state (%) - Other Race
Geographical mobility - Moved from abroad (%)
Geographical mobility - Moved from abroad (%) - White
Geographical mobility - Moved from abroad (%) - Black or African American
Geographical mobility - Moved from abroad (%) - Asian
Geographical mobility - Moved from abroad (%) - Hispanic or Latino
Geographical mobility - Moved from abroad (%) - American Indian and Alaska Native
Geographical mobility - Moved from abroad (%) - Multirace
Geographical mobility - Moved from abroad (%) - Other Race
Place of birth for the foreign-born population - Ireland (%)
Place of birth for the foreign-born population - Denmark (%)
Place of birth for the foreign-born population - Norway (%)
Place of birth for the foreign-born population - Sweden (%)
Place of birth for the foreign-born population - United Kingdom (%)
Place of birth for the foreign-born population - England (%)
Place of birth for the foreign-born population - Scotland (%)
Place of birth for the foreign-born population - Other Northern Europe (%)
Place of birth for the foreign-born population - Austria (%)
Place of birth for the foreign-born population - Belgium (%)
Place of birth for the foreign-born population - France (%)
Place of birth for the foreign-born population - Germany (%)
Place of birth for the foreign-born population - Netherlands (%)
Place of birth for the foreign-born population - Switzerland (%)
Place of birth for the foreign-born population - Other Western Europe (%)
Place of birth for the foreign-born population - Greece (%)
Place of birth for the foreign-born population - Italy (%)
Place of birth for the foreign-born population - Portugal (%)
Place of birth for the foreign-born population - Spain (%)
Place of birth for the foreign-born population - Other Southern Europe (%)
Place of birth for the foreign-born population - Albania (%)
Place of birth for the foreign-born population - Belarus (%)
Place of birth for the foreign-born population - Bosnia and Herzegovina (%)
Place of birth for the foreign-born population - Bulgaria (%)
Place of birth for the foreign-born population - Croatia (%)
Place of birth for the foreign-born population - Czechoslovakia (%)
Place of birth for the foreign-born population - Hungary (%)
Place of birth for the foreign-born population - Latvia (%)
Place of birth for the foreign-born population - Lithuania (%)
Place of birth for the foreign-born population - North Macedonia (Macedonia) (%)
Place of birth for the foreign-born population - Moldova (%)
Place of birth for the foreign-born population - Poland (%)
Place of birth for the foreign-born population - Romania (%)
Place of birth for the foreign-born population - Russia (%)
Place of birth for the foreign-born population - Serbia (%)
Place of birth for the foreign-born population - Ukraine (%)
Place of birth for the foreign-born population - Other Eastern Europe (%)
Place of birth for the foreign-born population - China (%)
Place of birth for the foreign-born population - Hong Kong (%)
Place of birth for the foreign-born population - Taiwan (%)
Place of birth for the foreign-born population - Japan (%)
Place of birth for the foreign-born population - Korea (%)
Place of birth for the foreign-born population - Other Eastern Asia (%)
Place of birth for the foreign-born population - Afghanistan (%)
Place of birth for the foreign-born population - Bangladesh (%)
Place of birth for the foreign-born population - India (%)
Place of birth for the foreign-born population - Iran (%)
Place of birth for the foreign-born population - Kazakhstan (%)
Place of birth for the foreign-born population - Nepal (%)
Place of birth for the foreign-born population - Pakistan (%)
Place of birth for the foreign-born population - Sri Lanka (%)
Place of birth for the foreign-born population - Uzbekistan (%)
Place of birth for the foreign-born population - Other South Central Asia (%)
Place of birth for the foreign-born population - Burma (%)
Place of birth for the foreign-born population - Cambodia (%)
Place of birth for the foreign-born population - Indonesia (%)
Place of birth for the foreign-born population - Laos (%)
Place of birth for the foreign-born population - Malaysia (%)
Place of birth for the foreign-born population - Philippines (%)
Place of birth for the foreign-born population - Singapore (%)
Place of birth for the foreign-born population - Thailand (%)
Place of birth for the foreign-born population - Vietnam (%)
Place of birth for the foreign-born population - Other South Eastern Asia (%)
Place of birth for the foreign-born population - Armenia (%)
Place of birth for the foreign-born population - Iraq (%)
Place of birth for the foreign-born population - Israel (%)
Place of birth for the foreign-born population - Jordan (%)
Place of birth for the foreign-born population - Kuwait (%)
Place of birth for the foreign-born population - Lebanon (%)
Place of birth for the foreign-born population - Saudi Arabia (%)
Place of birth for the foreign-born population - Syria (%)
Place of birth for the foreign-born population - Turkey (%)
Place of birth for the foreign-born population - Yemen (%)
Place of birth for the foreign-born population - Other Western Asia (%)
Place of birth for the foreign-born population - Eritrea (%)
Place of birth for the foreign-born population - Ethiopia (%)
Place of birth for the foreign-born population - Kenya (%)
Place of birth for the foreign-born population - Somalia (%)
Place of birth for the foreign-born population - Uganda (%)
Place of birth for the foreign-born population - Zimbabwe (%)
Place of birth for the foreign-born population - Other Eastern Africa (%)
Place of birth for the foreign-born population - Cameroon (%)
Place of birth for the foreign-born population - Congo (%)
Place of birth for the foreign-born population - Democratic Republic of Congo (Zaire) (%)
Place of birth for the foreign-born population - Other Middle Africa (%)
Place of birth for the foreign-born population - Egypt (%)
Place of birth for the foreign-born population - Morocco (%)
Place of birth for the foreign-born population - Sudan (%)
Place of birth for the foreign-born population - Other Northern Africa (%)
Place of birth for the foreign-born population - South Africa (%)
Place of birth for the foreign-born population - Other Southern Africa (%)
Place of birth for the foreign-born population - Cabo Verde (%)
Place of birth for the foreign-born population - Ghana (%)
Place of birth for the foreign-born population - Liberia (%)
Place of birth for the foreign-born population - Nigeria (%)
Place of birth for the foreign-born population - Senegal (%)
Place of birth for the foreign-born population - Sierra Leone (%)
Place of birth for the foreign-born population - Other Western Africa (%)
Place of birth for the foreign-born population - Australia (%)
Place of birth for the foreign-born population - New Zealand (%)
Place of birth for the foreign-born population - Fiji (%)
Place of birth for the foreign-born population - Micronesia (%)
Place of birth for the foreign-born population - Bahamas (%)
Place of birth for the foreign-born population - Barbados (%)
Place of birth for the foreign-born population - Cuba (%)
Place of birth for the foreign-born population - Dominica (%)
Place of birth for the foreign-born population - Dominican Republic (%)
Place of birth for the foreign-born population - Grenada (%)
Place of birth for the foreign-born population - Haiti (%)
Place of birth for the foreign-born population - Jamaica (%)
Place of birth for the foreign-born population - St. Vincent and the Grenadines (%)
Place of birth for the foreign-born population - Trinidad and Tobago (%)
Place of birth for the foreign-born population - West Indies (%)
Place of birth for the foreign-born population - Other Caribbean (%)
Place of birth for the foreign-born population - Belize (%)
Place of birth for the foreign-born population - Costa Rica (%)
Place of birth for the foreign-born population - El Salvador (%)
Place of birth for the foreign-born population - Guatemala (%)
Place of birth for the foreign-born population - Honduras (%)
Place of birth for the foreign-born population - Mexico (%)
Place of birth for the foreign-born population - Nicaragua (%)
Place of birth for the foreign-born population - Panama (%)
Place of birth for the foreign-born population - Other Central America (%)
Place of birth for the foreign-born population - Argentina (%)
Place of birth for the foreign-born population - Bolivia (%)
Place of birth for the foreign-born population - Brazil (%)
Place of birth for the foreign-born population - Chile (%)
Place of birth for the foreign-born population - Colombia (%)
Place of birth for the foreign-born population - Ecuador (%)
Place of birth for the foreign-born population - Guyana (%)
Place of birth for the foreign-born population - Peru (%)
Place of birth for the foreign-born population - Uruguay (%)
Place of birth for the foreign-born population - Venezuela (%)
Place of birth for the foreign-born population - Other South America (%)
Place of birth for the foreign-born population - Canada (%)
Place of birth for the foreign-born population - Other Northern America (%)
Place of birth for the foreign-born population - Other (%)
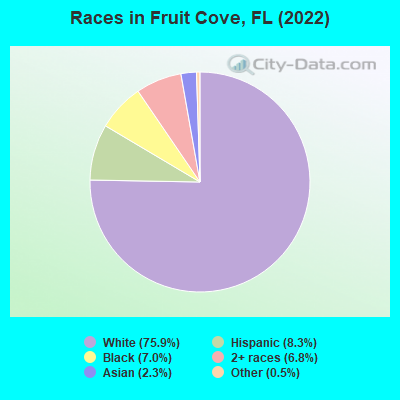
According to 2022 data, the most numerous races in Fruit Cove, FL are White alone (29,530 residents), Hispanic (3,216 residents), and Black alone (2,720 residents). 91.6% of Fruit Cove residents speak English at home. 7.7% of Fruit Cove, FL residents are foreign-born (3.4% born in Latin America, 2.2% born in Asia, 1.8% born in Europe), which is 171.3% less than the foreign-born rate of 21.0% across the entire state of Florida.
Race distribution in Fruit Cove
2000 2022
10,458,509 65.4% White alone 2,682,715 16.8% Hispanic 2,264,268 14.2% Black alone 261,693 1.6% Asian alone 236,954 1.5% Two or more races 42,358 0.3% American Indian alone 28,994 0.2% Other race alone 6,887 0.04% Native Hawaiian and Other
11,309,403 50.8% White alone 6,025,039 27.1% Hispanic 3,241,015 14.6% Black alone 861,630 3.9% Two or more races 623,692 2.8% Asian alone 152,054 0.7% Other race alone 22,504 0.1% American Indian alone 9,486 0.04% Native Hawaiian and Other
Income and house value in Fruit Cove Median household income in 2022 $135,508 White non-Hispanic householders$179,912 Black householders$125,105 Asian householders$141,690 Two or more races householders$112,356 Hispanic or Latino race householdersMedian 2022 house value $489,941 White Non-Hispanic householders$460,539 Black or African American householders $458,935 Asian householders$501,167 Some other race householders$396,122 Two or more races householders$530,569 Hispanic or Latino householders
Median age by race in Fruit Cove
44.5 Median age for White residents42.6 46.0 36.3 Median age for Black or African American residents35.9 21.8 64.3 Median age for American Indian / Alaska Native residents-611,418,047.3 -594,925,633.7 46.2 Median age for Asian residents49.3 49.9 -679,849,340.2 Median age for Native Hawaiian / Pacific Islander residents-666,666,666.0 -443,298,968.6 52.0 Median age for Other race residents25.8 52.6 35.9 Median age for Two or more races residents37.5 34.9 44.3 Median age for White alone residents42.7 45.7 38.1 Median age for Hispanic or Latino residents36.8 41.8
Owner/renter occupied households by race in Fruit Cove
House owners and renters - White residents 9,715 88.5% Owner occupied1,264 11.5% Renter occupiedHouse owners and renters - Black or African American residents 993 97.1% Owner occupied30 2.9% Renter occupiedHouse owners and renters - American Indian / Alaska Native residents 19 100.0% Owner occupiedHouse owners and renters - Asian residents 231 67.5% Owner occupied111 32.5% Renter occupiedHouse owners and renters - Other race residents 141 71.3% Owner occupied57 28.7% Renter occupiedHouse owners and renters - Two or more races residents 587 61.8% Owner occupied363 38.2% Renter occupiedHouse owners and renters - White alone residents 9,673 89.3% Owner occupied1,159 10.7% Renter occupiedHouse owners and renters - Hispanic or Latino residents 494 58.4% Owner occupied352 41.6% Renter occupied
Language usage in Fruit Cove
English speakers - Total 91.6% of residents of Fruit Cove speak English at home.
3.2% of residents speak Spanish at home 1,073 88.1% Speak English very well145 11.9% Speak English less than very well5.2% of residents speak other language at home 1,269 64.4% Speak English very well703 35.6% Speak English less than very well
English speakers - Born in the United States 98.0% of residents of Fruit Cove speak English at home.
1.2% of residents speak Spanish at home 166 74.1% Speak English very well58 25.9% Speak English less than very well0.6% of residents speak other language at home 126 100.0% Speak English very well
English speakers - Native, born elsewhere 51.8% of residents of Fruit Cove speak English at home.
24.4% of residents speak Spanish at home 112 77.8% Speak English very well32 22.2% Speak English less than very well16.0% of residents speak other language at home 94 100.0% Speak English very well
English speakers - Foreign-born 32.2% of residents of Fruit Cove speak English at home.
27.5% of residents speak Spanish at home 778 87.1% Speak English very well115 12.9% Speak English less than very well46.4% of residents speak other language at home 936 62.2% Speak English very well569 37.8% Speak English less than very well
White (Caucasian) - Speak only English Native:
98.1% (26,884)Foreign-born:
35.2% (397)
White (Caucasian) - Speak another language Native:
1.8% (505)Foreign-born:
64.9% (733)
Black or African American - Speak only English Native:
96.8% (2,261)Foreign-born:
73.0% (64)
Black or African American - Speak another language Native:
3.1% (72)Foreign-born:
25.3% (22)
Asian - Speak only English Native:
88.6% (166)Foreign-born:
21.9% (161)
Asian - Speak another language Native:
13.7% (26)Foreign-born:
77.9% (571)
Other race - Speak only English Native:
100.0% (428)Foreign-born:
11.2% (54)
Other race - Speak another language Native:
6.7% (29)Foreign-born:
76.2% (369)
Two or more races - Speak only English Native:
91.3% (3,810)Foreign-born:
68.4% (514)
Two or more races - Speak another language Native:
9.1% (379)Foreign-born:
52.3% (393)
White alone - Speak only English Native:
98.0% (26,881)Foreign-born:
31.9% (350)
White alone - Speak another language Native:
2.0% (552)Foreign-born:
70.6% (773)
Hispanic or Latino - Speak only English Native:
86.5% (1,746)Foreign-born:
33.6% (344)
Hispanic or Latino - Speak another language Native:
17.7% (357)Foreign-born:
71.4% (732)
Foreign-born residents in Fruit Cove 3,011 residents are foreign born (3.4% Latin America , 2.2% Asia , 1.8% Europe ).
This city:
7.7%Florida:
21.1%
Marital status for residents in Fruit Cove Marital status - White (Caucasian) population 15 years and over
Males 26.8% Never married65.9% Now married0.1% Separated1.6% Widowed5.7% DivorcedFemales 18.6% Never married62.1% Now married0.5% Separated7.8% Widowed11.0% DivorcedWomen who gave birth in the past 12 months Now married:
97.0% (240)Unmarried:
3.0% (7)
Women who did not give birth in the past 12 months Now married:
53.6% (2,996)Unmarried:
46.4% (2,591)
Marital status - Black or African American population 15 years and over
Males 21.8% Never married69.5% Now married0.0% Separated1.7% Widowed7.0% DivorcedFemales 33.0% Never married52.5% Now married0.0% Separated7.0% Widowed7.5% DivorcedWomen who did not give birth in the past 12 months Now married:
47.4% (333)Unmarried:
52.6% (369)
Marital status - American Indian / Alaska Native population 15 years and over
Males 0.0% Never married100.0% Now married0.0% Separated0.0% Widowed0.0% DivorcedFemales 88.2% Never married11.8% Now married0.0% Separated0.0% Widowed0.0% DivorcedWomen who did not give birth in the past 12 months Now married:
0.0% (0)Unmarried:
100.0% (25)
Marital status - Asian population 15 years and over
Males 21.4% Never married72.1% Now married0.0% Separated0.0% Widowed6.5% DivorcedFemales 21.4% Never married69.8% Now married0.0% Separated2.3% Widowed6.5% DivorcedWomen who did not give birth in the past 12 months Now married:
60.8% (166)Unmarried:
39.2% (107)
Marital status - Other race population 15 years and over
Males 63.5% Never married21.9% Now married0.0% Separated0.0% Widowed14.6% DivorcedFemales 9.7% Never married81.7% Now married0.0% Separated0.0% Widowed8.6% DivorcedWomen who did not give birth in the past 12 months Now married:
75.4% (123)Unmarried:
24.6% (40)
Marital status - Two or more races population 15 years and over
Males 56.1% Never married41.7% Now married0.0% Separated1.6% Widowed0.6% DivorcedFemales 28.1% Never married64.6% Now married0.9% Separated1.3% Widowed5.1% DivorcedWomen who did not give birth in the past 12 months Now married:
54.4% (528)Unmarried:
45.6% (443)
Marital status - White alone, not Hispanic / Latino population 15 years and over
Males 26.5% Never married66.2% Now married0.0% Separated1.5% Widowed5.8% DivorcedFemales 18.5% Never married62.3% Now married0.3% Separated7.7% Widowed11.2% DivorcedWomen who gave birth in the past 12 months Now married:
97.0% (248)Unmarried:
3.0% (8)
Women who did not give birth in the past 12 months Now married:
53.2% (2,988)Unmarried:
46.8% (2,633)
Marital status - Hispanic or Latino population 15 years and over
Males 51.3% Never married44.7% Now married0.6% Separated2.7% Widowed0.6% DivorcedFemales 22.3% Never married69.8% Now married2.8% Separated1.8% Widowed3.4% DivorcedWomen who did not give birth in the past 12 months Now married:
57.5% (441)Unmarried:
42.5% (326)
Ancestries in Fruit Cove
4,016 23.5% American2,887 16.9% English1,045 6.1% Italian1,008 5.9% German981 5.7% Irish398 2.3% Polish219 1.3% European206 1.2% Ukrainian152 0.9% Scotch-Irish118 0.7% Canadian110 0.6% Danish109 0.6% Russian88 0.5% Scottish87 0.5% Jamaican86 0.5% British80 0.5% Brazilian79 0.5% Eastern European77 0.5% Syrian71 0.4% French70 0.4% French Canadian67 0.4% Hungarian58 0.3% Swedish54 0.3% Northern European47 0.3% Czech34 0.2% African33 0.2% Scandinavian33 0.2% Albanian29 0.2% Armenian29 0.2% Dutch26 0.2% Slovak25 0.1% Swiss24 0.1% Norwegian23 0.1% Croatian22 0.1% Lebanese17 0.10% Haitian12 0.07% Romanian10 0.06% Portuguese10 0.06% Slavic8 0.05% Czechoslovakian8 0.05% Welsh7 0.04% Guyanese6 0.04% Greek
Geographical mobility in Fruit Cove Same house 1 year ago 27,986 95.1% White (Caucasian)2,492 84.2% Black or African American51 100.0% American Indian / Alaska Native761 94.5% Asian539 82.4% Other race4,057 79.8% Two or more races28,110 95.3% White alone, not Hispanic / Latino2,508 78.9% Hispanic or LatinoMoved within same county 433 1.5% White / Caucasian17 2.6% Other race404 8.0% Two or more races429 1.5% White alone, not Hispanic / Latino245 7.7% Hispanic or LatinoMoved within same state 521 1.8% White / Caucasian349 11.8% Black or African American15 1.8% Asian172 3.4% Two or more races459 1.6% White alone, not Hispanic / Latino157 4.9% Hispanic or LatinoMoved from different state 1,066 3.6% White / Caucasian39 1.3% Black or African American38 4.7% Asian87 1.7% Two or more races1,091 3.7% White alone, not Hispanic / Latino55 1.7% Hispanic or LatinoMoved from abroad 18 0.1% White125 19.2% Other race124 2.4% Two or more races243 7.6% Hispanic or Latino
Children Nativity (place of birth) in Fruit Cove
Children under 6 years - Living with two parents Both parents native 1,432 100.0% NativeBoth parents foreign-born 27 32.5% Native57 67.5% Foreign-bornOne native, one foreign-born parent 177 100.0% NativeChildren under 6 years - Living with one parent Native parent 274 100.0% NativeForeign-born parent 11 100.0% NativeChildren 6 to 17 years - Living with two parents Both parents native 5,438 99.8% Native13 0.2% Foreign-bornBoth parents foreign-born 93 32.6% Native193 67.4% Foreign-bornOne native, one foreign-born parent 625 100.0% NativeChildren 6 to 17 years - Living with one parent Native parent 1,220 100.0% Native
Grandparents responsible for own grandchildren in Fruit Cove
Grandparents (30 to 59 years) White / Caucasian 268 55.3% Responsible for grandchildren217 44.7% Not responsible for grandchildrenAmerican Indian / Alaska Native 2 100.0% Responsible for grandchildrenWhite alone, not Hispanic / Latino 314 59.1% Responsible for grandchildren217 40.9% Not responsible for grandchildrenGrandparents (60 years and over) White / Caucasian 112 30.0% Responsible for grandchildren261 70.0% Not responsible for grandchildrenWhite alone, not Hispanic / Latino 112 30.4% Responsible for grandchildren256 69.6% Not responsible for grandchildren