Races in Galena Park, Texas (TX) Detailed Stats
Data:
Races - White alone (%)
Races - White alone (% change since 2000)
Races - Black alone (%)
Races - Black alone (% change since 2000)
Races - American Indian alone (%)
Races - American Indian alone (% change since 2000)
Races - Asian alone (%)
Races - Asian alone (% change since 2000)
Races - Hispanic (%)
Races - Hispanic (% change since 2000)
Races - Native Hawaiian and Other Pacific Islander alone (%)
Races - Native Hawaiian and Other Pacific Islander alone (% change since 2000)
Races - Two or more races(%)
Races - Two or more races(% change since 2000)
Races - Other race alone (%)
Races - Other race alone (% change since 2000)
Racial diversity
Place of birth - Born in state of residence (%)
Place of birth - Born in state of residence (%) - White
Place of birth - Born in state of residence (%) - Black or African American
Place of birth - Born in state of residence (%) - Asian
Place of birth - Born in state of residence (%) - Hispanic or Latino
Place of birth - Born in state of residence (%) - American Indian and Alaska Native
Place of birth - Born in state of residence (%) - Multirace
Place of birth - Born in state of residence (%) - Other Race
Place of birth - Born in other state (%)
Place of birth - Born in other state (%) - White
Place of birth - Born in other state (%) - Black or African American
Place of birth - Born in other state (%) - Asian
Place of birth - Born in other state (%) - Hispanic or Latino
Place of birth - Born in other state (%) - American Indian and Alaska Native
Place of birth - Born in other state (%) - Multirace
Place of birth - Born in other state (%) - Other Race
Place of birth - Native, outside of US (%)
Place of birth - Native, outside of US (%) - White
Place of birth - Native, outside of US (%) - Black or African American
Place of birth - Native, outside of US (%) - Asian
Place of birth - Native, outside of US (%) - Hispanic or Latino
Place of birth - Native, outside of US (%) - American Indian and Alaska Native
Place of birth - Native, outside of US (%) - Multirace
Place of birth - Native, outside of US (%) - Other Race
Place of birth - Foreign born (%)
Place of birth - Foreign born (%) - White
Place of birth - Foreign born (%) - Black or African American
Place of birth - Foreign born (%) - Asian
Place of birth - Foreign born (%) - Hispanic or Latino
Place of birth - Foreign born (%) - American Indian and Alaska Native
Place of birth - Foreign born (%) - Multirace
Place of birth - Foreign born (%) - Other Race
Residents speaking English at home (%)
Residents speaking English at home - Born in the United States (%)
Residents speaking English at home - Native, born elsewhere (%)
Residents speaking English at home - Foreign born (%)
Residents speaking Spanish at home (%)
Residents speaking Spanish at home - Born in the United States (%)
Residents speaking Spanish at home - Native, born elsewhere (%)
Residents speaking Spanish at home - Foreign born (%)
Residents speaking other language at home (%)
Residents speaking other language at home - Born in the United States (%)
Residents speaking other language at home - Native, born elsewhere (%)
Residents speaking other language at home - Foreign born (%)
Marital status - Never married (%)
Marital status - Now married (%)
Marital status - Separated (%)
Marital status - Widowed (%)
Marital status - Divorced (%)
Ancestries Reported - Arab (%)
Ancestries Reported - Czech (%)
Ancestries Reported - Danish (%)
Ancestries Reported - Dutch (%)
Ancestries Reported - English (%)
Ancestries Reported - French (%)
Ancestries Reported - French Canadian (%)
Ancestries Reported - German (%)
Ancestries Reported - Greek (%)
Ancestries Reported - Hungarian (%)
Ancestries Reported - Irish (%)
Ancestries Reported - Italian (%)
Ancestries Reported - Lithuanian (%)
Ancestries Reported - Norwegian (%)
Ancestries Reported - Polish (%)
Ancestries Reported - Portuguese (%)
Ancestries Reported - Russian (%)
Ancestries Reported - Scotch-Irish (%)
Ancestries Reported - Scottish (%)
Ancestries Reported - Slovak (%)
Ancestries Reported - Subsaharan African (%)
Ancestries Reported - Swedish (%)
Ancestries Reported - Swiss (%)
Ancestries Reported - Ukrainian (%)
Ancestries Reported - United States (%)
Ancestries Reported - Welsh (%)
Ancestries Reported - West Indian (%)
Ancestries Reported - Other (%)
Geographical mobility - Same house 1 year ago (%)
Geographical mobility - Same house 1 year ago (%) - White
Geographical mobility - Same house 1 year ago (%) - Black or African American
Geographical mobility - Same house 1 year ago (%) - Asian
Geographical mobility - Same house 1 year ago (%) - Hispanic or Latino
Geographical mobility - Same house 1 year ago (%) - American Indian and Alaska Native
Geographical mobility - Same house 1 year ago (%) - Multirace
Geographical mobility - Same house 1 year ago (%) - Other Race
Geographical mobility - Moved within same county (%)
Geographical mobility - Moved within same county (%) - White
Geographical mobility - Moved within same county (%) - Black or African American
Geographical mobility - Moved within same county (%) - Asian
Geographical mobility - Moved within same county (%) - Hispanic or Latino
Geographical mobility - Moved within same county (%) - American Indian and Alaska Native
Geographical mobility - Moved within same county (%) - Multirace
Geographical mobility - Moved within same county (%) - Other Race
Geographical mobility - Moved from different county within same state (%)
Geographical mobility - Moved from different county within same state (%) - White
Geographical mobility - Moved from different county within same state (%) - Black or African American
Geographical mobility - Moved from different county within same state (%) - Asian
Geographical mobility - Moved from different county within same state (%) - Hispanic or Latino
Geographical mobility - Moved from different county within same state (%) - American Indian and Alaska Native
Geographical mobility - Moved from different county within same state (%) - Multirace
Geographical mobility - Moved from different county within same state (%) - Other Race
Geographical mobility - Moved from different state (%)
Geographical mobility - Moved from different state (%) - White
Geographical mobility - Moved from different state (%) - Black or African American
Geographical mobility - Moved from different state (%) - Asian
Geographical mobility - Moved from different state (%) - Hispanic or Latino
Geographical mobility - Moved from different state (%) - American Indian and Alaska Native
Geographical mobility - Moved from different state (%) - Multirace
Geographical mobility - Moved from different state (%) - Other Race
Geographical mobility - Moved from abroad (%)
Geographical mobility - Moved from abroad (%) - White
Geographical mobility - Moved from abroad (%) - Black or African American
Geographical mobility - Moved from abroad (%) - Asian
Geographical mobility - Moved from abroad (%) - Hispanic or Latino
Geographical mobility - Moved from abroad (%) - American Indian and Alaska Native
Geographical mobility - Moved from abroad (%) - Multirace
Geographical mobility - Moved from abroad (%) - Other Race
Place of birth for the foreign-born population - Ireland (%)
Place of birth for the foreign-born population - Denmark (%)
Place of birth for the foreign-born population - Norway (%)
Place of birth for the foreign-born population - Sweden (%)
Place of birth for the foreign-born population - United Kingdom (%)
Place of birth for the foreign-born population - England (%)
Place of birth for the foreign-born population - Scotland (%)
Place of birth for the foreign-born population - Other Northern Europe (%)
Place of birth for the foreign-born population - Austria (%)
Place of birth for the foreign-born population - Belgium (%)
Place of birth for the foreign-born population - France (%)
Place of birth for the foreign-born population - Germany (%)
Place of birth for the foreign-born population - Netherlands (%)
Place of birth for the foreign-born population - Switzerland (%)
Place of birth for the foreign-born population - Other Western Europe (%)
Place of birth for the foreign-born population - Greece (%)
Place of birth for the foreign-born population - Italy (%)
Place of birth for the foreign-born population - Portugal (%)
Place of birth for the foreign-born population - Spain (%)
Place of birth for the foreign-born population - Other Southern Europe (%)
Place of birth for the foreign-born population - Albania (%)
Place of birth for the foreign-born population - Belarus (%)
Place of birth for the foreign-born population - Bosnia and Herzegovina (%)
Place of birth for the foreign-born population - Bulgaria (%)
Place of birth for the foreign-born population - Croatia (%)
Place of birth for the foreign-born population - Czechoslovakia (%)
Place of birth for the foreign-born population - Hungary (%)
Place of birth for the foreign-born population - Latvia (%)
Place of birth for the foreign-born population - Lithuania (%)
Place of birth for the foreign-born population - North Macedonia (Macedonia) (%)
Place of birth for the foreign-born population - Moldova (%)
Place of birth for the foreign-born population - Poland (%)
Place of birth for the foreign-born population - Romania (%)
Place of birth for the foreign-born population - Russia (%)
Place of birth for the foreign-born population - Serbia (%)
Place of birth for the foreign-born population - Ukraine (%)
Place of birth for the foreign-born population - Other Eastern Europe (%)
Place of birth for the foreign-born population - China (%)
Place of birth for the foreign-born population - Hong Kong (%)
Place of birth for the foreign-born population - Taiwan (%)
Place of birth for the foreign-born population - Japan (%)
Place of birth for the foreign-born population - Korea (%)
Place of birth for the foreign-born population - Other Eastern Asia (%)
Place of birth for the foreign-born population - Afghanistan (%)
Place of birth for the foreign-born population - Bangladesh (%)
Place of birth for the foreign-born population - India (%)
Place of birth for the foreign-born population - Iran (%)
Place of birth for the foreign-born population - Kazakhstan (%)
Place of birth for the foreign-born population - Nepal (%)
Place of birth for the foreign-born population - Pakistan (%)
Place of birth for the foreign-born population - Sri Lanka (%)
Place of birth for the foreign-born population - Uzbekistan (%)
Place of birth for the foreign-born population - Other South Central Asia (%)
Place of birth for the foreign-born population - Burma (%)
Place of birth for the foreign-born population - Cambodia (%)
Place of birth for the foreign-born population - Indonesia (%)
Place of birth for the foreign-born population - Laos (%)
Place of birth for the foreign-born population - Malaysia (%)
Place of birth for the foreign-born population - Philippines (%)
Place of birth for the foreign-born population - Singapore (%)
Place of birth for the foreign-born population - Thailand (%)
Place of birth for the foreign-born population - Vietnam (%)
Place of birth for the foreign-born population - Other South Eastern Asia (%)
Place of birth for the foreign-born population - Armenia (%)
Place of birth for the foreign-born population - Iraq (%)
Place of birth for the foreign-born population - Israel (%)
Place of birth for the foreign-born population - Jordan (%)
Place of birth for the foreign-born population - Kuwait (%)
Place of birth for the foreign-born population - Lebanon (%)
Place of birth for the foreign-born population - Saudi Arabia (%)
Place of birth for the foreign-born population - Syria (%)
Place of birth for the foreign-born population - Turkey (%)
Place of birth for the foreign-born population - Yemen (%)
Place of birth for the foreign-born population - Other Western Asia (%)
Place of birth for the foreign-born population - Eritrea (%)
Place of birth for the foreign-born population - Ethiopia (%)
Place of birth for the foreign-born population - Kenya (%)
Place of birth for the foreign-born population - Somalia (%)
Place of birth for the foreign-born population - Uganda (%)
Place of birth for the foreign-born population - Zimbabwe (%)
Place of birth for the foreign-born population - Other Eastern Africa (%)
Place of birth for the foreign-born population - Cameroon (%)
Place of birth for the foreign-born population - Congo (%)
Place of birth for the foreign-born population - Democratic Republic of Congo (Zaire) (%)
Place of birth for the foreign-born population - Other Middle Africa (%)
Place of birth for the foreign-born population - Egypt (%)
Place of birth for the foreign-born population - Morocco (%)
Place of birth for the foreign-born population - Sudan (%)
Place of birth for the foreign-born population - Other Northern Africa (%)
Place of birth for the foreign-born population - South Africa (%)
Place of birth for the foreign-born population - Other Southern Africa (%)
Place of birth for the foreign-born population - Cabo Verde (%)
Place of birth for the foreign-born population - Ghana (%)
Place of birth for the foreign-born population - Liberia (%)
Place of birth for the foreign-born population - Nigeria (%)
Place of birth for the foreign-born population - Senegal (%)
Place of birth for the foreign-born population - Sierra Leone (%)
Place of birth for the foreign-born population - Other Western Africa (%)
Place of birth for the foreign-born population - Australia (%)
Place of birth for the foreign-born population - New Zealand (%)
Place of birth for the foreign-born population - Fiji (%)
Place of birth for the foreign-born population - Micronesia (%)
Place of birth for the foreign-born population - Bahamas (%)
Place of birth for the foreign-born population - Barbados (%)
Place of birth for the foreign-born population - Cuba (%)
Place of birth for the foreign-born population - Dominica (%)
Place of birth for the foreign-born population - Dominican Republic (%)
Place of birth for the foreign-born population - Grenada (%)
Place of birth for the foreign-born population - Haiti (%)
Place of birth for the foreign-born population - Jamaica (%)
Place of birth for the foreign-born population - St. Vincent and the Grenadines (%)
Place of birth for the foreign-born population - Trinidad and Tobago (%)
Place of birth for the foreign-born population - West Indies (%)
Place of birth for the foreign-born population - Other Caribbean (%)
Place of birth for the foreign-born population - Belize (%)
Place of birth for the foreign-born population - Costa Rica (%)
Place of birth for the foreign-born population - El Salvador (%)
Place of birth for the foreign-born population - Guatemala (%)
Place of birth for the foreign-born population - Honduras (%)
Place of birth for the foreign-born population - Mexico (%)
Place of birth for the foreign-born population - Nicaragua (%)
Place of birth for the foreign-born population - Panama (%)
Place of birth for the foreign-born population - Other Central America (%)
Place of birth for the foreign-born population - Argentina (%)
Place of birth for the foreign-born population - Bolivia (%)
Place of birth for the foreign-born population - Brazil (%)
Place of birth for the foreign-born population - Chile (%)
Place of birth for the foreign-born population - Colombia (%)
Place of birth for the foreign-born population - Ecuador (%)
Place of birth for the foreign-born population - Guyana (%)
Place of birth for the foreign-born population - Peru (%)
Place of birth for the foreign-born population - Uruguay (%)
Place of birth for the foreign-born population - Venezuela (%)
Place of birth for the foreign-born population - Other South America (%)
Place of birth for the foreign-born population - Canada (%)
Place of birth for the foreign-born population - Other Northern America (%)
Place of birth for the foreign-born population - Other (%)
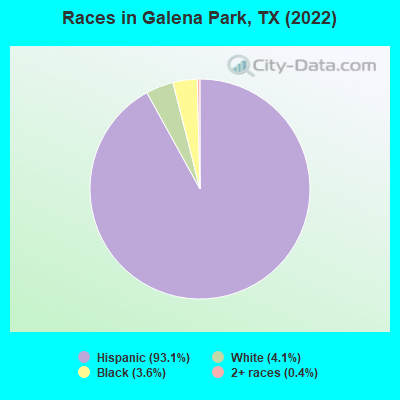
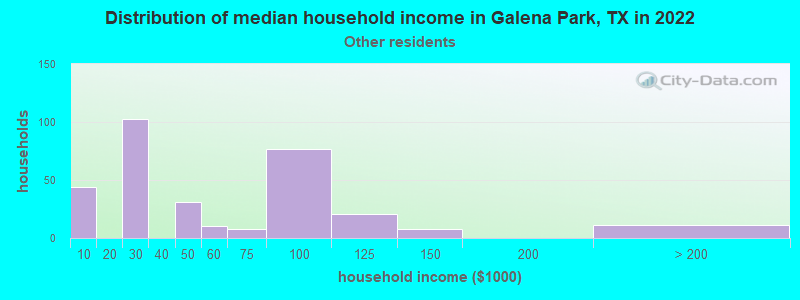
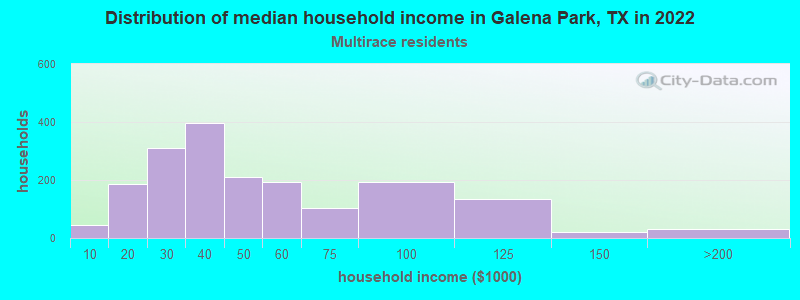
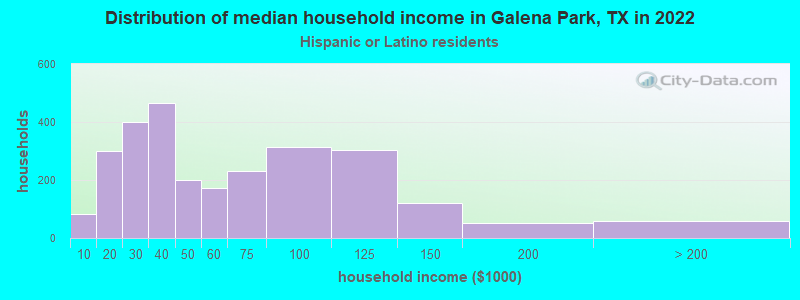
According to 2022 data, the most numerous races in Galena Park, TX are Hispanic (10,018 residents), White alone (439 residents), and Black alone (383 residents). 17.8% of Galena Park residents speak English at home. 31.8% of Galena Park, TX residents are foreign-born (30.8% born in Latin America), which is 46.5% greater than the foreign-born rate of 17.0% across the entire state of Texas.
Race distribution in Galena Park
2000 2022
10,933,313 52.4% White alone 6,669,666 32.0% Hispanic 2,364,255 11.3% Black alone 554,445 2.7% Asian alone 230,567 1.1% Two or more races 68,859 0.3% American Indian alone 19,958 0.10% Other race alone 10,757 0.05% Native Hawaiian and Other
12,070,642 40.2% Hispanic 11,683,430 38.9% White alone 3,508,706 11.7% Black alone 1,608,173 5.4% Asian alone 956,560 3.2% Two or more races 125,763 0.4% Other race alone 47,023 0.2% American Indian alone 29,275 0.10% Native Hawaiian and Other
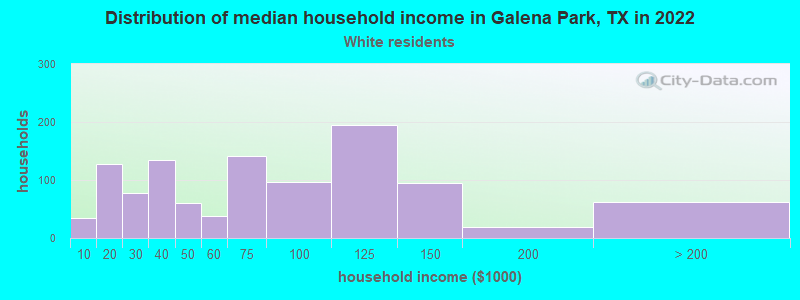
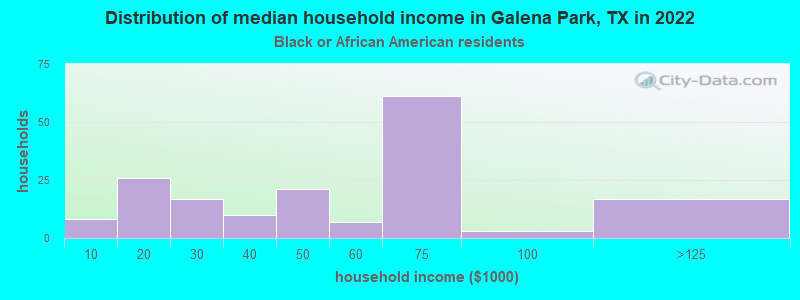
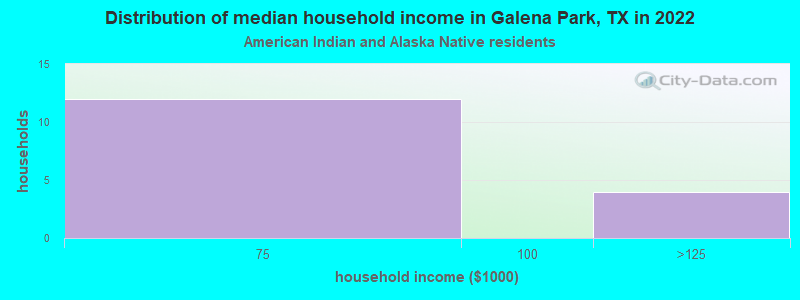
Income and house value in Galena Park Median household income in 2022 $68,066 White non-Hispanic householders$40,889 Some other race householders$37,540 Two or more races householders$42,713 Hispanic or Latino race householdersMedian 2022 house value $113,227 White Non-Hispanic householders$112,737 Black or African American householders$122,540 American Indian or Alaska Native householders $177,684 Asian householders$122,540 Some other race householders$115,678 Two or more races householders$112,492 Hispanic or Latino householders
Median age by race in Galena Park
26.2 Median age for White residents26.0 26.6 45.0 Median age for Black or African American residents44.8 42.3 47.4 Median age for American Indian / Alaska Native residents46.3 48.4 3.6 Median age for Asian residents-682,752,456.9 -680,412,370.5 -782,795,698.1 Median age for Native Hawaiian / Pacific Islander residents-633,771,929.2 -816,367,264.7 28.9 Median age for Other race residents29.4 25.9 34.1 Median age for Two or more races residents25.1 37.5 56.8 Median age for White alone residents49.3 61.6 26.5 Median age for Hispanic or Latino residents24.4 27.9
Owner/renter occupied households by race in Galena Park
House owners and renters - White residents 721 65.5% Owner occupied380 34.5% Renter occupiedHouse owners and renters - Black or African American residents 145 82.4% Owner occupied31 17.6% Renter occupiedHouse owners and renters - American Indian / Alaska Native residents 16 100.0% Owner occupiedHouse owners and renters - Asian residents 7 100.0% Owner occupiedHouse owners and renters - Other race residents 178 57.1% Owner occupied134 42.9% Renter occupiedHouse owners and renters - Two or more races residents 1,291 71.1% Owner occupied525 28.9% Renter occupiedHouse owners and renters - White alone residents 143 91.5% Owner occupied13 8.5% Renter occupiedHouse owners and renters - Hispanic or Latino residents 1,743 64.2% Owner occupied972 35.8% Renter occupied
Language usage in Galena Park
English speakers - Total 17.8% of residents of Galena Park speak English at home.
82.8% of residents speak Spanish at home 4,535 55.7% Speak English very well3,607 44.3% Speak English less than very well0.4% of residents speak other language at home 11 31.4% Speak English very well24 68.6% Speak English less than very well
English speakers - Born in the United States 38.8% of residents of Galena Park speak English at home.
58.2% of residents speak Spanish at home 461 92.9% Speak English very well35 7.1% Speak English less than very well
English speakers - Native, born elsewhere 30.2% of residents of Galena Park speak English at home.
67.0% of residents speak Spanish at home 57 47.5% Speak English very well63 52.5% Speak English less than very well
English speakers - Foreign-born 2.8% of residents of Galena Park speak English at home.
98.8% of residents speak Spanish at home 604 17.9% Speak English very well2,770 82.1% Speak English less than very well0.7% of residents speak other language at home 23 100.0% Speak English less than very well
White (Caucasian) - Speak only English Native:
26.0% (751)Foreign-born:
4.8% (35)
White (Caucasian) - Speak another language Native:
46.8% (1,351)Foreign-born:
85.7% (623)
American Indian / Alaska Native - Speak only English Native:
20.2% (8)Foreign-born:
99.2% (23)
American Indian / Alaska Native - Speak another language Native:
89.9% (37)Foreign-born:
15.2% (4)
Other race - Speak only English Native:
31.8% (121)Foreign-born:
5.4% (21)
Other race - Speak another language Native:
68.6% (262)Foreign-born:
94.5% (372)
Two or more races - Speak only English Native:
14.5% (469)Foreign-born:
1.6% (36)
Two or more races - Speak another language Native:
89.9% (2,902)Foreign-born:
98.4% (2,192)
White alone - Speak only English Native:
93.4% (381)Foreign-born:
78.6% (25)
White alone - Speak another language Native:
6.7% (27)Foreign-born:
23.8% (8)
Hispanic or Latino - Speak only English Native:
15.4% (866)Foreign-born:
2.2% (76)
Hispanic or Latino - Speak another language Native:
85.1% (4,787)Foreign-born:
97.7% (3,397)
Foreign-born residents in Galena Park 3,418 residents are foreign born (30.8% Latin America ).
This city:
31.8%Texas:
17.1%
Marital status for residents in Galena Park Marital status - White (Caucasian) population 15 years and over
Males 48.0% Never married47.2% Now married0.0% Separated0.5% Widowed4.3% DivorcedFemales 38.1% Never married47.6% Now married2.0% Separated2.1% Widowed10.1% DivorcedWomen who gave birth in the past 12 months Now married:
20.4% (15)Unmarried:
79.6% (58)
Women who did not give birth in the past 12 months Now married:
45.9% (435)Unmarried:
54.1% (513)
Marital status - Black or African American population 15 years and over
Males 77.1% Never married19.0% Now married0.0% Separated0.0% Widowed3.9% DivorcedFemales 26.4% Never married34.9% Now married0.0% Separated24.5% Widowed14.2% DivorcedWomen who did not give birth in the past 12 months Now married:
61.7% (37)Unmarried:
38.3% (23)
Marital status - American Indian / Alaska Native population 15 years and over
Males 15.0% Never married85.0% Now married0.0% Separated0.0% Widowed0.0% DivorcedFemales 18.8% Never married81.2% Now married0.0% Separated0.0% Widowed0.0% DivorcedWomen who did not give birth in the past 12 months Now married:
78.6% (20)Unmarried:
21.4% (6)
Marital status - Asian population 15 years and over
Males 0.0% Never married0.0% Now married0.0% Separated100.0% Widowed0.0% DivorcedFemales 100.0% Never married0.0% Now married0.0% Separated0.0% Widowed0.0% DivorcedWomen who did not give birth in the past 12 months Now married:
0.0% (0)Unmarried:
100.0% (61)
Marital status - Other race population 15 years and over
Males 41.5% Never married47.0% Now married0.0% Separated1.0% Widowed10.5% DivorcedFemales 26.9% Never married53.4% Now married0.0% Separated4.1% Widowed15.5% DivorcedWomen who gave birth in the past 12 months Now married:
100.0% (45)Unmarried:
0.0% (0)
Women who did not give birth in the past 12 months Now married:
21.2% (25)Unmarried:
78.8% (91)
Marital status - Two or more races population 15 years and over
Males 48.2% Never married37.8% Now married1.3% Separated2.0% Widowed10.7% DivorcedFemales 32.3% Never married40.0% Now married11.5% Separated6.3% Widowed9.9% DivorcedWomen who gave birth in the past 12 months Now married:
65.6% (31)Unmarried:
34.4% (16)
Women who did not give birth in the past 12 months Now married:
41.2% (468)Unmarried:
58.8% (668)
Marital status - White alone, not Hispanic / Latino population 15 years and over
Males 34.3% Never married47.8% Now married0.0% Separated0.0% Widowed17.9% DivorcedFemales 19.0% Never married50.4% Now married0.0% Separated16.3% Widowed14.3% DivorcedWomen who did not give birth in the past 12 months Now married:
40.7% (34)Unmarried:
59.3% (49)
Marital status - Hispanic or Latino population 15 years and over
Males 48.4% Never married43.2% Now married0.5% Separated1.0% Widowed6.9% DivorcedFemales 37.6% Never married43.9% Now married5.9% Separated2.8% Widowed9.9% DivorcedWomen who gave birth in the past 12 months Now married:
44.0% (75)Unmarried:
56.0% (95)
Women who did not give birth in the past 12 months Now married:
42.3% (941)Unmarried:
57.7% (1,285)
Ancestries in Galena Park
131 1.5% American43 0.5% French25 0.3% English24 0.3% Irish17 0.2% German
Children Nativity (place of birth) in Galena Park
Children under 6 years - Living with two parents Both parents native 93 100.0% NativeBoth parents foreign-born 190 100.0% NativeOne native, one foreign-born parent 133 100.0% NativeChildren under 6 years - Living with one parent Native parent 365 100.0% NativeForeign-born parent 286 100.0% NativeChildren 6 to 17 years - Living with two parents Both parents native 231 99.8% Native0 0.2% Foreign-bornBoth parents foreign-born 499 98.2% Native9 1.8% Foreign-bornOne native, one foreign-born parent 437 100.0% NativeChildren 6 to 17 years - Living with one parent Native parent 643 100.0% NativeForeign-born parent 571 51.1% Native546 48.9% Foreign-born
Grandparents responsible for own grandchildren in Galena Park
Grandparents (30 to 59 years) White / Caucasian 47 48.6% Responsible for grandchildren50 51.4% Not responsible for grandchildrenOther race 7 100.0% Not responsible for grandchildrenTwo or more races 15 16.4% Responsible for grandchildren75 83.6% Not responsible for grandchildrenHispanic or Latino 87 34.7% Responsible for grandchildren163 65.3% Not responsible for grandchildrenGrandparents (60 years and over) White / Caucasian 13 21.3% Responsible for grandchildren46 78.7% Not responsible for grandchildrenTwo or more races 56 100.0% Not responsible for grandchildrenHispanic or Latino 23 17.4% Responsible for grandchildren107 82.6% Not responsible for grandchildren