Races in Garland, Maine (ME) Detailed Stats
Ancestries, Foreign-born residents, place of birth

Recent posts about races in Garland, Maine on our local forum with over 2,400,000 registered users:
 | Small houses (not tiny; 600-800 sq ft) (30 replies) |
| Maine Governor: Drug Dealers Often 'Impregnate a Young White Gir'l (110 replies) |
| Buying land and building over time? (7 replies) |
| Alternative building (39 replies) |
| Blueberries? (56 replies) |
1.5% of Garland, ME residents are foreign-born , which is 98.0% less than the foreign-born rate of 3.0% across the entire state of Maine.
Race distribution in Garland

- 96597.5%White alone
- 90.9%Two or more races
- 50.5%American Indian alone
- 40.4%Hispanic
- 40.4%Native Hawaiian and Other
Pacific Islander alone - 20.2%Black alone
- 10.1%Asian alone

2000
2022
-
- 1,230,29796.5%White alone
- 11,7310.9%Two or more races
- 9,3600.7%Hispanic
- 9,0140.7%Asian alone
- 6,4400.5%Black alone
- 6,9110.5%American Indian alone
- 8360.07%Other race alone
- 3340.03%Native Hawaiian and Other
Pacific Islander alone

-
- 1,249,23390.2%White alone
- 58,3574.2%Two or more races
- 28,7172.1%Hispanic
- 21,5831.6%Black alone
- 16,1511.2%Asian alone
- 5,8730.4%Other race alone
- 5,2050.4%American Indian alone
- 2210.02%Native Hawaiian and Other
Pacific Islander alone

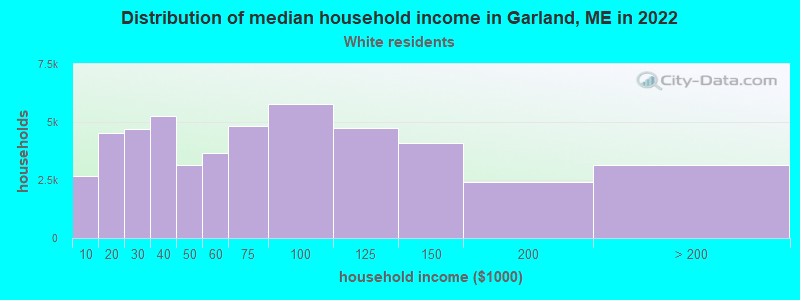
Income and house value in Garland
- Median household income in 2022
- $49,044White non-Hispanic householders
- Median 2022 house value
- $166,272White Non-Hispanic householders
Household income for White non-Hispanic householders
Foreign-born residents in Garland
15 residents are foreign born
| This city: | 1.5% |
| Maine: | 2.9% |
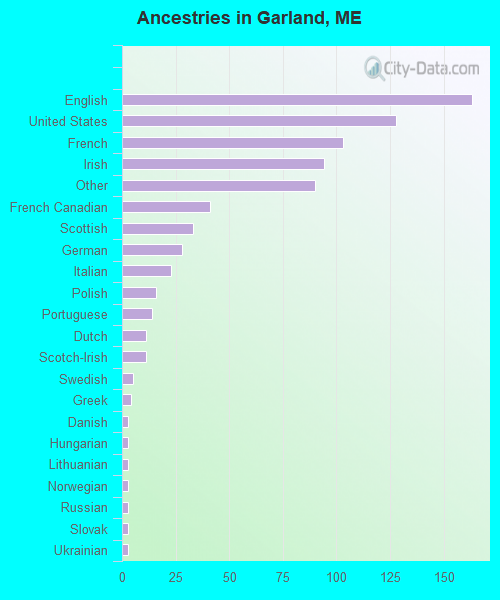
Ancestries in Garland

- 16320.7%English
- 12816.3%United States
- 10313.1%French
- 9412.0%Irish
- 9011.5%Other
- 415.2%French Canadian
- 334.2%Scottish
- 283.6%German
- 232.9%Italian
- 162.0%Polish
- 141.8%Portuguese
- 111.4%Dutch
- 111.4%Scotch-Irish
- 50.6%Swedish
- 40.5%Greek
- 30.4%Danish
- 30.4%Hungarian
- 30.4%Lithuanian
- 30.4%Norwegian
- 30.4%Russian
- 30.4%Slovak
- 30.4%Ukrainian
- 10.1%Welsh
Zip codes: 04939.