Races in Georgetown, Maine (ME) Detailed Stats
Ancestries, Foreign-born residents, place of birth

Recent posts about races in Georgetown, Maine on our local forum with over 2,400,000 registered users:
 | Well, here goes. The start to our trek North to Maine, our new home-state. (395 replies) |
| Maine very small houses (70 replies) |
| Which under-rated greater Portland communities should we consider? (18 replies) |
| I am moving to Main and would like to know a little something about it! (45 replies) |
| Relocating to Maine (50 replies) |
| Portland, ME vs Richmond, VA (26 replies) |
Latest news about races in Georgetown, ME collected exclusively by city-data.com from local newspapers, TV, and radio stations
2.4% of Georgetown, ME residents are foreign-born (1.7% born in Europe, 0.3% born in North America), which is 27.5% less than the foreign-born rate of 3.0% across the entire state of Maine.
Race distribution in Georgetown

- 1,00098.0%White alone
- 101.0%Hispanic
- 50.5%Asian alone
- 40.4%Two or more races
- 10.10%Black alone

2000
2022
-
- 1,230,29796.5%White alone
- 11,7310.9%Two or more races
- 9,3600.7%Hispanic
- 9,0140.7%Asian alone
- 6,4400.5%Black alone
- 6,9110.5%American Indian alone
- 8360.07%Other race alone
- 3340.03%Native Hawaiian and Other
Pacific Islander alone

-
- 1,249,23390.2%White alone
- 58,3574.2%Two or more races
- 28,7172.1%Hispanic
- 21,5831.6%Black alone
- 16,1511.2%Asian alone
- 5,8730.4%Other race alone
- 5,2050.4%American Indian alone
- 2210.02%Native Hawaiian and Other
Pacific Islander alone

Income and house value in Georgetown
- Median household income in 2022
- $89,660White non-Hispanic householders
- Median 2022 house value
- $455,671White Non-Hispanic householders
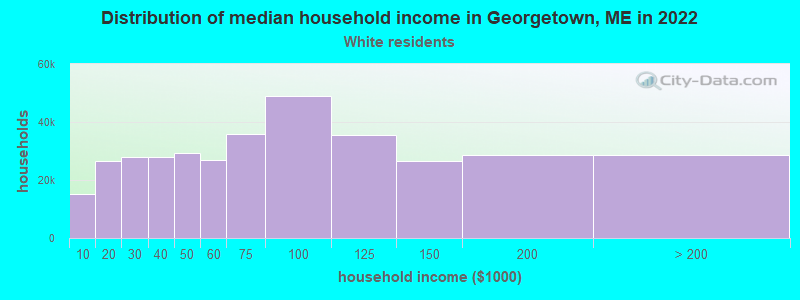
Household income for White non-Hispanic householders
Foreign-born residents in Georgetown
24 residents are foreign born (1.7% Europe, 0.3% North America).
| This city: | 2.4% |
| Maine: | 2.9% |
Ancestries in Georgetown

- 31027.4%English
- 16114.2%Irish
- 1049.2%French
- 1049.2%Scottish
- 1039.1%German
- 726.4%Other
- 625.5%United States
- 504.4%Scotch-Irish
- 373.3%French Canadian
- 302.7%Italian
- 191.7%Danish
- 141.2%Norwegian
- 141.2%Swedish
- 121.1%Russian
- 111.0%Dutch
- 100.9%Polish
- 90.8%Welsh
- 40.4%Swiss
- 20.2%Hungarian
- 20.2%Lithuanian

Zip codes: 04548.