Races in Goodyear, Arizona (AZ) Detailed Stats
Data:
Races - White alone (%)
Races - White alone (% change since 2000)
Races - Black alone (%)
Races - Black alone (% change since 2000)
Races - American Indian alone (%)
Races - American Indian alone (% change since 2000)
Races - Asian alone (%)
Races - Asian alone (% change since 2000)
Races - Hispanic (%)
Races - Hispanic (% change since 2000)
Races - Native Hawaiian and Other Pacific Islander alone (%)
Races - Native Hawaiian and Other Pacific Islander alone (% change since 2000)
Races - Two or more races(%)
Races - Two or more races(% change since 2000)
Races - Other race alone (%)
Races - Other race alone (% change since 2000)
Racial diversity
Place of birth - Born in state of residence (%)
Place of birth - Born in state of residence (%) - White
Place of birth - Born in state of residence (%) - Black or African American
Place of birth - Born in state of residence (%) - Asian
Place of birth - Born in state of residence (%) - Hispanic or Latino
Place of birth - Born in state of residence (%) - American Indian and Alaska Native
Place of birth - Born in state of residence (%) - Multirace
Place of birth - Born in state of residence (%) - Other Race
Place of birth - Born in other state (%)
Place of birth - Born in other state (%) - White
Place of birth - Born in other state (%) - Black or African American
Place of birth - Born in other state (%) - Asian
Place of birth - Born in other state (%) - Hispanic or Latino
Place of birth - Born in other state (%) - American Indian and Alaska Native
Place of birth - Born in other state (%) - Multirace
Place of birth - Born in other state (%) - Other Race
Place of birth - Native, outside of US (%)
Place of birth - Native, outside of US (%) - White
Place of birth - Native, outside of US (%) - Black or African American
Place of birth - Native, outside of US (%) - Asian
Place of birth - Native, outside of US (%) - Hispanic or Latino
Place of birth - Native, outside of US (%) - American Indian and Alaska Native
Place of birth - Native, outside of US (%) - Multirace
Place of birth - Native, outside of US (%) - Other Race
Place of birth - Foreign born (%)
Place of birth - Foreign born (%) - White
Place of birth - Foreign born (%) - Black or African American
Place of birth - Foreign born (%) - Asian
Place of birth - Foreign born (%) - Hispanic or Latino
Place of birth - Foreign born (%) - American Indian and Alaska Native
Place of birth - Foreign born (%) - Multirace
Place of birth - Foreign born (%) - Other Race
Residents speaking English at home (%)
Residents speaking English at home - Born in the United States (%)
Residents speaking English at home - Native, born elsewhere (%)
Residents speaking English at home - Foreign born (%)
Residents speaking Spanish at home (%)
Residents speaking Spanish at home - Born in the United States (%)
Residents speaking Spanish at home - Native, born elsewhere (%)
Residents speaking Spanish at home - Foreign born (%)
Residents speaking other language at home (%)
Residents speaking other language at home - Born in the United States (%)
Residents speaking other language at home - Native, born elsewhere (%)
Residents speaking other language at home - Foreign born (%)
Marital status - Never married (%)
Marital status - Now married (%)
Marital status - Separated (%)
Marital status - Widowed (%)
Marital status - Divorced (%)
Ancestries Reported - Arab (%)
Ancestries Reported - Czech (%)
Ancestries Reported - Danish (%)
Ancestries Reported - Dutch (%)
Ancestries Reported - English (%)
Ancestries Reported - French (%)
Ancestries Reported - French Canadian (%)
Ancestries Reported - German (%)
Ancestries Reported - Greek (%)
Ancestries Reported - Hungarian (%)
Ancestries Reported - Irish (%)
Ancestries Reported - Italian (%)
Ancestries Reported - Lithuanian (%)
Ancestries Reported - Norwegian (%)
Ancestries Reported - Polish (%)
Ancestries Reported - Portuguese (%)
Ancestries Reported - Russian (%)
Ancestries Reported - Scotch-Irish (%)
Ancestries Reported - Scottish (%)
Ancestries Reported - Slovak (%)
Ancestries Reported - Subsaharan African (%)
Ancestries Reported - Swedish (%)
Ancestries Reported - Swiss (%)
Ancestries Reported - Ukrainian (%)
Ancestries Reported - United States (%)
Ancestries Reported - Welsh (%)
Ancestries Reported - West Indian (%)
Ancestries Reported - Other (%)
Geographical mobility - Same house 1 year ago (%)
Geographical mobility - Same house 1 year ago (%) - White
Geographical mobility - Same house 1 year ago (%) - Black or African American
Geographical mobility - Same house 1 year ago (%) - Asian
Geographical mobility - Same house 1 year ago (%) - Hispanic or Latino
Geographical mobility - Same house 1 year ago (%) - American Indian and Alaska Native
Geographical mobility - Same house 1 year ago (%) - Multirace
Geographical mobility - Same house 1 year ago (%) - Other Race
Geographical mobility - Moved within same county (%)
Geographical mobility - Moved within same county (%) - White
Geographical mobility - Moved within same county (%) - Black or African American
Geographical mobility - Moved within same county (%) - Asian
Geographical mobility - Moved within same county (%) - Hispanic or Latino
Geographical mobility - Moved within same county (%) - American Indian and Alaska Native
Geographical mobility - Moved within same county (%) - Multirace
Geographical mobility - Moved within same county (%) - Other Race
Geographical mobility - Moved from different county within same state (%)
Geographical mobility - Moved from different county within same state (%) - White
Geographical mobility - Moved from different county within same state (%) - Black or African American
Geographical mobility - Moved from different county within same state (%) - Asian
Geographical mobility - Moved from different county within same state (%) - Hispanic or Latino
Geographical mobility - Moved from different county within same state (%) - American Indian and Alaska Native
Geographical mobility - Moved from different county within same state (%) - Multirace
Geographical mobility - Moved from different county within same state (%) - Other Race
Geographical mobility - Moved from different state (%)
Geographical mobility - Moved from different state (%) - White
Geographical mobility - Moved from different state (%) - Black or African American
Geographical mobility - Moved from different state (%) - Asian
Geographical mobility - Moved from different state (%) - Hispanic or Latino
Geographical mobility - Moved from different state (%) - American Indian and Alaska Native
Geographical mobility - Moved from different state (%) - Multirace
Geographical mobility - Moved from different state (%) - Other Race
Geographical mobility - Moved from abroad (%)
Geographical mobility - Moved from abroad (%) - White
Geographical mobility - Moved from abroad (%) - Black or African American
Geographical mobility - Moved from abroad (%) - Asian
Geographical mobility - Moved from abroad (%) - Hispanic or Latino
Geographical mobility - Moved from abroad (%) - American Indian and Alaska Native
Geographical mobility - Moved from abroad (%) - Multirace
Geographical mobility - Moved from abroad (%) - Other Race
Place of birth for the foreign-born population - Ireland (%)
Place of birth for the foreign-born population - Denmark (%)
Place of birth for the foreign-born population - Norway (%)
Place of birth for the foreign-born population - Sweden (%)
Place of birth for the foreign-born population - United Kingdom (%)
Place of birth for the foreign-born population - England (%)
Place of birth for the foreign-born population - Scotland (%)
Place of birth for the foreign-born population - Other Northern Europe (%)
Place of birth for the foreign-born population - Austria (%)
Place of birth for the foreign-born population - Belgium (%)
Place of birth for the foreign-born population - France (%)
Place of birth for the foreign-born population - Germany (%)
Place of birth for the foreign-born population - Netherlands (%)
Place of birth for the foreign-born population - Switzerland (%)
Place of birth for the foreign-born population - Other Western Europe (%)
Place of birth for the foreign-born population - Greece (%)
Place of birth for the foreign-born population - Italy (%)
Place of birth for the foreign-born population - Portugal (%)
Place of birth for the foreign-born population - Spain (%)
Place of birth for the foreign-born population - Other Southern Europe (%)
Place of birth for the foreign-born population - Albania (%)
Place of birth for the foreign-born population - Belarus (%)
Place of birth for the foreign-born population - Bosnia and Herzegovina (%)
Place of birth for the foreign-born population - Bulgaria (%)
Place of birth for the foreign-born population - Croatia (%)
Place of birth for the foreign-born population - Czechoslovakia (%)
Place of birth for the foreign-born population - Hungary (%)
Place of birth for the foreign-born population - Latvia (%)
Place of birth for the foreign-born population - Lithuania (%)
Place of birth for the foreign-born population - North Macedonia (Macedonia) (%)
Place of birth for the foreign-born population - Moldova (%)
Place of birth for the foreign-born population - Poland (%)
Place of birth for the foreign-born population - Romania (%)
Place of birth for the foreign-born population - Russia (%)
Place of birth for the foreign-born population - Serbia (%)
Place of birth for the foreign-born population - Ukraine (%)
Place of birth for the foreign-born population - Other Eastern Europe (%)
Place of birth for the foreign-born population - China (%)
Place of birth for the foreign-born population - Hong Kong (%)
Place of birth for the foreign-born population - Taiwan (%)
Place of birth for the foreign-born population - Japan (%)
Place of birth for the foreign-born population - Korea (%)
Place of birth for the foreign-born population - Other Eastern Asia (%)
Place of birth for the foreign-born population - Afghanistan (%)
Place of birth for the foreign-born population - Bangladesh (%)
Place of birth for the foreign-born population - India (%)
Place of birth for the foreign-born population - Iran (%)
Place of birth for the foreign-born population - Kazakhstan (%)
Place of birth for the foreign-born population - Nepal (%)
Place of birth for the foreign-born population - Pakistan (%)
Place of birth for the foreign-born population - Sri Lanka (%)
Place of birth for the foreign-born population - Uzbekistan (%)
Place of birth for the foreign-born population - Other South Central Asia (%)
Place of birth for the foreign-born population - Burma (%)
Place of birth for the foreign-born population - Cambodia (%)
Place of birth for the foreign-born population - Indonesia (%)
Place of birth for the foreign-born population - Laos (%)
Place of birth for the foreign-born population - Malaysia (%)
Place of birth for the foreign-born population - Philippines (%)
Place of birth for the foreign-born population - Singapore (%)
Place of birth for the foreign-born population - Thailand (%)
Place of birth for the foreign-born population - Vietnam (%)
Place of birth for the foreign-born population - Other South Eastern Asia (%)
Place of birth for the foreign-born population - Armenia (%)
Place of birth for the foreign-born population - Iraq (%)
Place of birth for the foreign-born population - Israel (%)
Place of birth for the foreign-born population - Jordan (%)
Place of birth for the foreign-born population - Kuwait (%)
Place of birth for the foreign-born population - Lebanon (%)
Place of birth for the foreign-born population - Saudi Arabia (%)
Place of birth for the foreign-born population - Syria (%)
Place of birth for the foreign-born population - Turkey (%)
Place of birth for the foreign-born population - Yemen (%)
Place of birth for the foreign-born population - Other Western Asia (%)
Place of birth for the foreign-born population - Eritrea (%)
Place of birth for the foreign-born population - Ethiopia (%)
Place of birth for the foreign-born population - Kenya (%)
Place of birth for the foreign-born population - Somalia (%)
Place of birth for the foreign-born population - Uganda (%)
Place of birth for the foreign-born population - Zimbabwe (%)
Place of birth for the foreign-born population - Other Eastern Africa (%)
Place of birth for the foreign-born population - Cameroon (%)
Place of birth for the foreign-born population - Congo (%)
Place of birth for the foreign-born population - Democratic Republic of Congo (Zaire) (%)
Place of birth for the foreign-born population - Other Middle Africa (%)
Place of birth for the foreign-born population - Egypt (%)
Place of birth for the foreign-born population - Morocco (%)
Place of birth for the foreign-born population - Sudan (%)
Place of birth for the foreign-born population - Other Northern Africa (%)
Place of birth for the foreign-born population - South Africa (%)
Place of birth for the foreign-born population - Other Southern Africa (%)
Place of birth for the foreign-born population - Cabo Verde (%)
Place of birth for the foreign-born population - Ghana (%)
Place of birth for the foreign-born population - Liberia (%)
Place of birth for the foreign-born population - Nigeria (%)
Place of birth for the foreign-born population - Senegal (%)
Place of birth for the foreign-born population - Sierra Leone (%)
Place of birth for the foreign-born population - Other Western Africa (%)
Place of birth for the foreign-born population - Australia (%)
Place of birth for the foreign-born population - New Zealand (%)
Place of birth for the foreign-born population - Fiji (%)
Place of birth for the foreign-born population - Micronesia (%)
Place of birth for the foreign-born population - Bahamas (%)
Place of birth for the foreign-born population - Barbados (%)
Place of birth for the foreign-born population - Cuba (%)
Place of birth for the foreign-born population - Dominica (%)
Place of birth for the foreign-born population - Dominican Republic (%)
Place of birth for the foreign-born population - Grenada (%)
Place of birth for the foreign-born population - Haiti (%)
Place of birth for the foreign-born population - Jamaica (%)
Place of birth for the foreign-born population - St. Vincent and the Grenadines (%)
Place of birth for the foreign-born population - Trinidad and Tobago (%)
Place of birth for the foreign-born population - West Indies (%)
Place of birth for the foreign-born population - Other Caribbean (%)
Place of birth for the foreign-born population - Belize (%)
Place of birth for the foreign-born population - Costa Rica (%)
Place of birth for the foreign-born population - El Salvador (%)
Place of birth for the foreign-born population - Guatemala (%)
Place of birth for the foreign-born population - Honduras (%)
Place of birth for the foreign-born population - Mexico (%)
Place of birth for the foreign-born population - Nicaragua (%)
Place of birth for the foreign-born population - Panama (%)
Place of birth for the foreign-born population - Other Central America (%)
Place of birth for the foreign-born population - Argentina (%)
Place of birth for the foreign-born population - Bolivia (%)
Place of birth for the foreign-born population - Brazil (%)
Place of birth for the foreign-born population - Chile (%)
Place of birth for the foreign-born population - Colombia (%)
Place of birth for the foreign-born population - Ecuador (%)
Place of birth for the foreign-born population - Guyana (%)
Place of birth for the foreign-born population - Peru (%)
Place of birth for the foreign-born population - Uruguay (%)
Place of birth for the foreign-born population - Venezuela (%)
Place of birth for the foreign-born population - Other South America (%)
Place of birth for the foreign-born population - Canada (%)
Place of birth for the foreign-born population - Other Northern America (%)
Place of birth for the foreign-born population - Other (%)
Latest news about races in Goodyear, AZ collected exclusively by city-data.com from local newspapers, TV, and radio stations
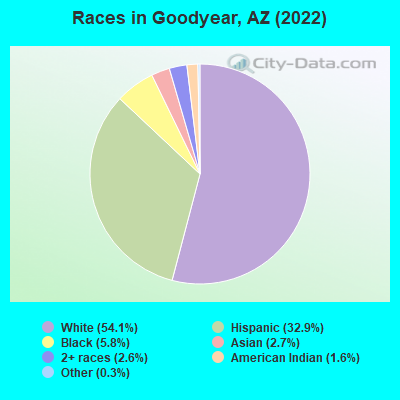
According to 2022 data, the most numerous races in Goodyear, AZ are White alone (44,878 residents), Hispanic (24,576 residents), and Black alone (6,694 residents). 80.4% of Goodyear residents speak English at home. 11.8% of Goodyear, AZ residents are foreign-born (6.0% born in Latin America, 3.2% born in Asia, 1.3% born in Europe), which is 10.1% less than the foreign-born rate of 13.0% across the entire state of Arizona.
Race distribution in Goodyear
2000 2022
3,274,258 63.8% White alone 1,295,617 25.3% Hispanic 233,370 4.5% American Indian alone 149,941 2.9% Black alone 89,315 1.7% Asian alone 76,372 1.5% Two or more races 6,120 0.1% Other race alone 5,639 0.1% Native Hawaiian and Other
3,814,587 51.8% White alone 2,388,520 32.5% Hispanic 322,459 4.4% Black alone 284,994 3.9% Two or more races 257,020 3.5% Asian alone 241,688 3.3% American Indian alone 36,042 0.5% Other race alone 13,887 0.2% Native Hawaiian and Other
Income and house value in Goodyear Median household income in 2022 $110,325 White non-Hispanic householders$78,764 Black householders$61,772 American Indian and Alaska Native householders$141,509 Asian householdersover $200,000 Native Hawaiian and other Pacific Islander householders$138,760 Some other race householders$132,509 Two or more races householders$88,548 Hispanic or Latino race householdersMedian 2022 house value $599,045 White Non-Hispanic householders$579,899 Black or African American householders$699,561 American Indian or Alaska Native householders $69,956 Asian householders$506,261 Native Hawaiian and other Pacific Islander householders$402,431 Some other race householders$490,797 Two or more races householders$434,832 Hispanic or Latino householders
Median age by race in Goodyear
43.2 Median age for White residents42.3 43.4 34.1 Median age for Black or African American residents40.7 18.9 23.3 Median age for American Indian / Alaska Native residents40.6 23.1 41.6 Median age for Asian residents43.0 36.8 39.6 Median age for Native Hawaiian / Pacific Islander residents24.7 59.9 33.6 Median age for Other race residents27.9 35.9 25.4 Median age for Two or more races residents20.4 27.5 48.6 Median age for White alone residents49.8 46.2 26.8 Median age for Hispanic or Latino residents22.9 32.2
Owner/renter occupied households by race in Goodyear
House owners and renters - White residents 15,655 75.6% Owner occupied5,040 24.4% Renter occupiedHouse owners and renters - Black or African American residents 1,400 73.2% Owner occupied512 26.8% Renter occupiedHouse owners and renters - American Indian / Alaska Native residents 152 66.1% Owner occupied78 33.9% Renter occupiedHouse owners and renters - Asian residents 752 70.2% Owner occupied320 29.8% Renter occupiedHouse owners and renters - Native Hawaiian / Pacific Islander residents 35 100.0% Owner occupiedHouse owners and renters - Other race residents 872 79.6% Owner occupied223 20.4% Renter occupiedHouse owners and renters - Two or more races residents 2,138 75.5% Owner occupied695 24.5% Renter occupiedHouse owners and renters - White alone residents 13,791 77.5% Owner occupied4,000 22.5% Renter occupiedHouse owners and renters - Hispanic or Latino residents 4,388 69.8% Owner occupied1,903 30.2% Renter occupied
Language usage in Goodyear
English speakers - Total 80.4% of residents of Goodyear speak English at home.
14.3% of residents speak Spanish at home 8,372 76.1% Speak English very well2,633 23.9% Speak English less than very well5.6% of residents speak other language at home 3,200 74.1% Speak English very well1,118 25.9% Speak English less than very well
English speakers - Born in the United States 91.4% of residents of Goodyear speak English at home.
7.1% of residents speak Spanish at home 2,610 87.5% Speak English very well374 12.5% Speak English less than very well1.6% of residents speak other language at home 591 89.7% Speak English very well68 10.3% Speak English less than very well
English speakers - Native, born elsewhere 59.9% of residents of Goodyear speak English at home.
23.8% of residents speak Spanish at home 296 86.0% Speak English very well48 14.0% Speak English less than very well15.4% of residents speak other language at home 206 92.8% Speak English very well16 7.2% Speak English less than very well
English speakers - Foreign-born 27.2% of residents of Goodyear speak English at home.
41.2% of residents speak Spanish at home 2,050 52.1% Speak English very well1,882 47.9% Speak English less than very well33.0% of residents speak other language at home 2,160 68.5% Speak English very well994 31.5% Speak English less than very well
White (Caucasian) - Speak only English Native:
94.8% (47,690)Foreign-born:
32.2% (1,377)
White (Caucasian) - Speak another language Native:
6.7% (3,364)Foreign-born:
69.9% (2,991)
Black or African American - Speak only English Native:
97.0% (5,198)Foreign-born:
81.6% (952)
Black or African American - Speak another language Native:
3.2% (171)Foreign-born:
32.4% (378)
American Indian / Alaska Native - Speak only English Native:
75.6% (884)Foreign-born:
2.0% (1)
American Indian / Alaska Native - Speak another language Native:
24.9% (291)Foreign-born:
91.6% (44)
Asian - Speak only English Native:
57.4% (983)Foreign-born:
17.1% (410)
Asian - Speak another language Native:
41.8% (716)Foreign-born:
82.9% (1,985)
Native Hawaiian / Pacific Islander - Speak only English Native:
100.0% (117)Foreign-born:
47.1% (8)
Other race - Speak only English Native:
49.1% (2,440)Foreign-born:
15.9% (239)
Other race - Speak another language Native:
52.0% (2,586)Foreign-born:
87.1% (1,309)
Two or more races - Speak only English Native:
70.0% (7,247)Foreign-born:
6.4% (171)
Two or more races - Speak another language Native:
18.8% (1,947)Foreign-born:
96.0% (2,545)
White alone - Speak only English Native:
97.9% (39,562)Foreign-born:
45.6% (1,052)
White alone - Speak another language Native:
2.1% (851)Foreign-born:
54.3% (1,253)
Hispanic or Latino - Speak only English Native:
69.6% (14,813)Foreign-born:
11.2% (602)
Hispanic or Latino - Speak another language Native:
32.1% (6,829)Foreign-born:
89.5% (4,789)
Foreign-born residents in Goodyear 10,002 residents are foreign born (6.0% Latin America , 3.2% Asia , 1.3% Europe ).
This city:
11.8%Arizona:
100.0%
Marital status for residents in Goodyear Marital status - White (Caucasian) population 15 years and over
Males 28.8% Never married61.0% Now married0.5% Separated3.0% Widowed6.7% DivorcedFemales 20.3% Never married54.3% Now married1.9% Separated8.7% Widowed14.7% DivorcedWomen who gave birth in the past 12 months Now married:
55.2% (696)Unmarried:
44.8% (564)
Women who did not give birth in the past 12 months Now married:
52.9% (5,855)Unmarried:
47.1% (5,217)
Marital status - Black or African American population 15 years and over
Males 28.3% Never married57.7% Now married0.0% Separated2.5% Widowed11.5% DivorcedFemales 41.6% Never married44.9% Now married1.4% Separated3.4% Widowed8.7% DivorcedWomen who gave birth in the past 12 months Now married:
50.7% (43)Unmarried:
49.3% (42)
Women who did not give birth in the past 12 months Now married:
39.6% (772)Unmarried:
60.4% (1,179)
Marital status - American Indian / Alaska Native population 15 years and over
Males 70.4% Never married29.2% Now married0.0% Separated0.0% Widowed0.4% DivorcedFemales 46.9% Never married47.8% Now married2.9% Separated1.1% Widowed1.3% DivorcedWomen who did not give birth in the past 12 months Now married:
45.7% (225)Unmarried:
54.3% (268)
Marital status - Asian population 15 years and over
Males 21.5% Never married72.7% Now married0.0% Separated2.1% Widowed3.7% DivorcedFemales 14.9% Never married71.5% Now married2.8% Separated4.2% Widowed6.7% DivorcedWomen who gave birth in the past 12 months Now married:
100.0% (26)Unmarried:
0.0% (0)
Women who did not give birth in the past 12 months Now married:
71.5% (832)Unmarried:
28.5% (331)
Marital status - Native Hawaiian / Pacific Islander population 15 years and over
Males 64.4% Never married35.6% Now married0.0% Separated0.0% Widowed0.0% DivorcedFemales 15.5% Never married84.5% Now married0.0% Separated0.0% Widowed0.0% DivorcedWomen who did not give birth in the past 12 months Now married:
57.1% (12)Unmarried:
42.9% (9)
Marital status - Other race population 15 years and over
Males 38.4% Never married55.8% Now married0.5% Separated1.8% Widowed3.6% DivorcedFemales 41.7% Never married34.8% Now married3.9% Separated5.3% Widowed14.4% DivorcedWomen who gave birth in the past 12 months Now married:
79.5% (31)Unmarried:
20.5% (8)
Women who did not give birth in the past 12 months Now married:
34.5% (547)Unmarried:
65.5% (1,039)
Marital status - Two or more races population 15 years and over
Males 43.4% Never married36.5% Now married2.5% Separated2.7% Widowed15.0% DivorcedFemales 55.5% Never married25.8% Now married0.3% Separated0.9% Widowed17.5% DivorcedWomen who gave birth in the past 12 months Now married:
52.6% (81)Unmarried:
47.4% (73)
Women who did not give birth in the past 12 months Now married:
20.9% (918)Unmarried:
79.1% (3,468)
Marital status - White alone, not Hispanic / Latino population 15 years and over
Males 23.3% Never married64.8% Now married0.2% Separated3.7% Widowed8.1% DivorcedFemales 15.8% Never married55.5% Now married1.8% Separated10.2% Widowed16.7% DivorcedWomen who gave birth in the past 12 months Now married:
100.0% (410)Unmarried:
0.0% (0)
Women who did not give birth in the past 12 months Now married:
53.9% (4,519)Unmarried:
46.1% (3,863)
Marital status - Hispanic or Latino population 15 years and over
Males 44.4% Never married49.9% Now married1.0% Separated0.9% Widowed3.8% DivorcedFemales 34.8% Never married49.6% Now married3.1% Separated3.3% Widowed9.2% DivorcedWomen who gave birth in the past 12 months Now married:
39.9% (462)Unmarried:
60.1% (695)
Women who did not give birth in the past 12 months Now married:
45.0% (3,285)Unmarried:
55.0% (4,018)
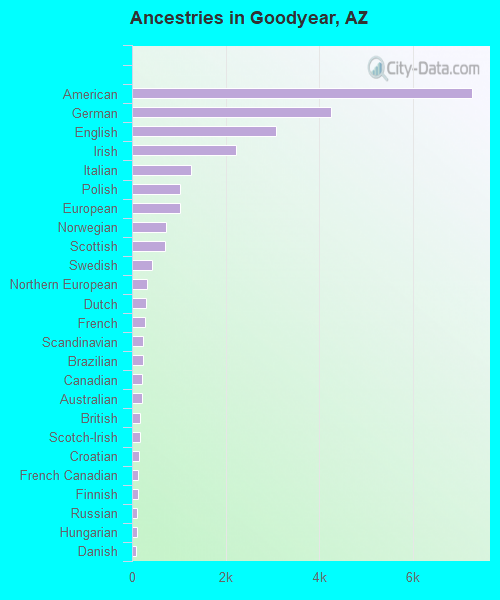
Ancestries in Goodyear
5,215 11.8% American3,260 7.3% German2,487 5.6% English2,319 5.2% European1,202 2.7% Italian1,174 2.6% Irish960 2.2% Polish698 1.6% Norwegian553 1.2% Brazilian390 0.9% British336 0.8% Scottish304 0.7% French247 0.6% Haitian229 0.5% African229 0.5% Ghanaian221 0.5% Northern European216 0.5% Swedish206 0.5% Nigerian171 0.4% Kenyan164 0.4% Scotch-Irish164 0.4% French Canadian147 0.3% Canadian143 0.3% Scandinavian124 0.3% Eastern European111 0.3% Ukrainian108 0.2% Hungarian107 0.2% Dutch86 0.2% Finnish81 0.2% Australian73 0.2% Greek67 0.2% Jamaican52 0.1% West Indian48 0.1% Russian48 0.1% Welsh43 0.10% Austrian41 0.09% Danish38 0.09% Portuguese37 0.08% Czech34 0.08% Czechoslovakian34 0.08% Swiss32 0.07% Albanian29 0.07% Croatian27 0.06% Egyptian24 0.05% Bulgarian22 0.05% Lithuanian18 0.04% Serbian18 0.04% Pennsylvania German17 0.04% Romanian16 0.04% Barbadian15 0.03% Turkish12 0.03% Cajun11 0.02% Slavic10 0.02% New Zealander9 0.02% Slovak9 0.02% Belgian4 0.01% Estonian3 0.01% Lebanese
Geographical mobility in Goodyear Same house 1 year ago 49,920 88.3% White (Caucasian)5,741 83.1% Black or African American973 75.3% American Indian / Alaska Native3,567 87.9% Asian124 82.3% Native Hawaiian / Pacific Islander3,519 89.1% Other race12,049 89.6% Two or more races38,719 88.6% White alone, not Hispanic / Latino20,975 90.9% Hispanic or LatinoMoved within same county 3,630 6.4% White / Caucasian666 9.6% Black or African American114 8.8% American Indian / Alaska Native258 6.4% Asian318 8.1% Other race1,176 8.7% Two or more races2,612 6.0% White alone, not Hispanic / Latino1,633 7.1% Hispanic or LatinoMoved within same state 380 0.7% White / Caucasian12 0.2% Black or African American51 3.9% American Indian / Alaska Native10 0.3% Asian201 5.1% Other race201 1.5% Two or more races342 0.8% White alone, not Hispanic / Latino211 0.9% Hispanic or LatinoMoved from different state 2,604 4.6% White / Caucasian362 5.2% Black or African American90 6.9% American Indian / Alaska Native38 0.9% Asian7 4.8% Native Hawaiian / Pacific Islander30 0.8% Other race197 1.5% Two or more races2,016 4.6% White alone, not Hispanic / Latino291 1.3% Hispanic or LatinoMoved from abroad 314 0.6% White134 1.9% Black or African American52 4.0% American Indian / Alaska Native200 4.9% Asian252 0.6% White alone, not Hispanic / Latino173 0.8% Hispanic or Latino
Children Nativity (place of birth) in Goodyear
Children under 6 years - Living with two parents Both parents native 2,784 97.2% Native79 2.8% Foreign-bornBoth parents foreign-born 334 68.7% Native153 31.3% Foreign-bornOne native, one foreign-born parent 685 98.9% Native8 1.1% Foreign-bornChildren under 6 years - Living with one parent Native parent 1,171 100.0% NativeForeign-born parent 118 96.5% Native4 3.5% Foreign-bornChildren 6 to 17 years - Living with two parents Both parents native 6,779 100.0% NativeBoth parents foreign-born 1,040 78.7% Native281 21.3% Foreign-bornOne native, one foreign-born parent 1,470 96.1% Native60 3.9% Foreign-bornChildren 6 to 17 years - Living with one parent Native parent 2,780 100.0% NativeForeign-born parent 309 52.4% Native280 47.6% Foreign-born
Grandparents responsible for own grandchildren in Goodyear
Grandparents (30 to 59 years) White / Caucasian 311 26.5% Responsible for grandchildren862 73.5% Not responsible for grandchildrenBlack or African American 14 28.6% Responsible for grandchildren36 71.4% Not responsible for grandchildrenAmerican Indian / Alaska Native 39 73.4% Responsible for grandchildren14 26.6% Not responsible for grandchildrenAsian 46 100.0% Not responsible for grandchildrenNative Hawaiian / Pacific Islander 35 100.0% Not responsible for grandchildrenOther race 20 100.0% Responsible for grandchildrenTwo or more races 133 34.4% Responsible for grandchildren254 65.6% Not responsible for grandchildrenWhite alone, not Hispanic / Latino 115 45.6% Responsible for grandchildren137 54.4% Not responsible for grandchildrenHispanic or Latino 164 42.0% Responsible for grandchildren226 58.0% Not responsible for grandchildrenGrandparents (60 years and over) White / Caucasian 338 47.5% Responsible for grandchildren374 52.5% Not responsible for grandchildrenBlack or African American 32 23.1% Responsible for grandchildren106 76.9% Not responsible for grandchildrenAsian 16 10.4% Responsible for grandchildren140 89.6% Not responsible for grandchildrenOther race 17 34.7% Responsible for grandchildren32 65.3% Not responsible for grandchildrenWhite alone, not Hispanic / Latino 154 24.6% Responsible for grandchildren473 75.4% Not responsible for grandchildrenHispanic or Latino 11 7.7% Responsible for grandchildren132 92.3% Not responsible for grandchildren