Races in Green Haven, Maryland (MD) Detailed Stats
Ancestries, Foreign-born residents, place of birth

Recent posts about races in Green Haven, Maryland on our local forum with over 2,400,000 registered users:
 | Life in Cape St. Claire? (29 replies) |
| Green Haven (10 replies) |
| Brooklyn Park: Is it really that bad? (26 replies) |
| Pasadena MD (9 replies) |
| Areas in Anne Arundel County to veer away from (4 replies) |
| Insights for Pasadena (29 replies) |
1.3% of Green Haven, MD residents are foreign-born , which is 1101.0% less than the foreign-born rate of 16.0% across the entire state of Maryland.
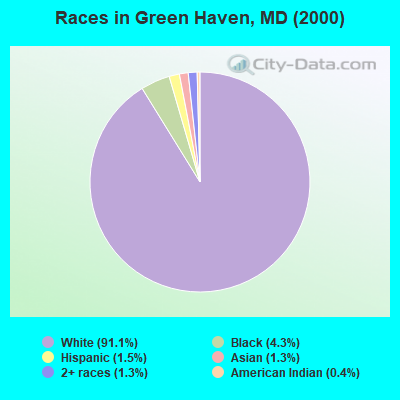
Race distribution in Green Haven

- 15,86391.1%White alone
- 7524.3%Black alone
- 2561.5%Hispanic
- 2251.3%Asian alone
- 2231.3%Two or more races
- 770.4%American Indian alone
- 150.09%Other race alone
- 40.02%Native Hawaiian and Other
Pacific Islander alone
2000
2022
-
- 3,286,54762.1%White alone
- 1,464,73527.7%Black alone
- 227,9164.3%Hispanic
- 209,7384.0%Asian alone
- 82,9461.6%Two or more races
- 13,3120.3%American Indian alone
- 9,3790.2%Other race alone
- 1,9130.04%Native Hawaiian and Other
Pacific Islander alone

-
- 2,906,49247.1%White alone
- 1,800,91429.2%Black alone
- 705,84211.4%Hispanic
- 401,8186.5%Asian alone
- 291,3174.7%Two or more races
- 46,9300.8%Other race alone
- 8,9300.1%American Indian alone
- 2,4170.04%Native Hawaiian and Other
Pacific Islander alone

Income and house value in Green Haven
- Median household income in 2022
- $116,676White non-Hispanic householders
- $90,300Black householders
- $131,401American Indian and Alaska Native householders
- $136,323Asian householders
- $100,415Some other race householders
- $103,704Two or more races householders
- $116,226Hispanic or Latino race householders
- Median 2022 house value
- $371,159White Non-Hispanic householders
- $376,088Black or African American householders
- $391,456American Indian or Alaska Native householders
- $453,800Asian householders
- $652,428Native Hawaiian and other Pacific Islander householders
- $398,706Some other race householders
- $272,569Two or more races householders
- $393,196Hispanic or Latino householders
Household income for White non-Hispanic householders

Household income for Black householders

Household income for American Indian and Alaska Native householders

Household income for Asian householders

Household income for Native Hawaiian and other Pacific Islander householders

Household income for Two or more races householders

Household income for Hispanic or Latino race householders

Foreign-born residents in Green Haven
232 residents are foreign born
| This city: | 1.3% |
| Maryland: | 9.8% |
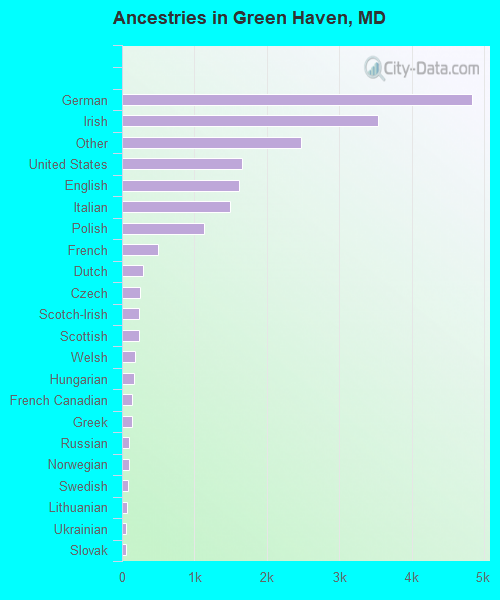
Ancestries in Green Haven

- 4,82824.8%German
- 3,54118.2%Irish
- 2,47612.7%Other
- 1,6628.5%United States
- 1,6168.3%English
- 1,4907.7%Italian
- 1,1295.8%Polish
- 4942.5%French
- 2911.5%Dutch
- 2421.2%Czech
- 2411.2%Scotch-Irish
- 2401.2%Scottish
- 1840.9%Welsh
- 1590.8%Hungarian
- 1410.7%French Canadian
- 1380.7%Greek
- 980.5%Russian
- 950.5%Norwegian
- 800.4%Swedish
- 720.4%Lithuanian
- 590.3%Ukrainian
- 540.3%Slovak
- 430.2%Subsaharan African
- 350.2%Arab
- 330.2%Swiss
- 200.1%West Indian
Zip codes: 21122.