Races in Harper Woods, Michigan (MI) Detailed Stats
Ancestries, Foreign-born residents, place of birth
Settings
X


Recent posts about races in Harper Woods, Michigan on our local forum with over 2,400,000 registered users:

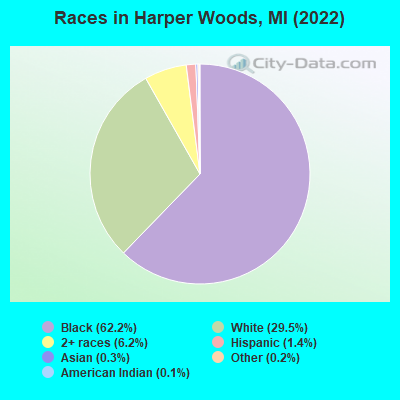
According to 2022 data, the most numerous races in Harper Woods, MI are White alone (4,446 residents), Black alone (9,388 residents), and Hispanic (207 residents). 94.0% of Harper Woods residents speak English at home. 2.4% of Harper Woods, MI residents are foreign-born (1.4% born in Asia, 0.4% born in Europe), which is 150.7% less than the foreign-born rate of 6.0% across the entire state of Michigan.
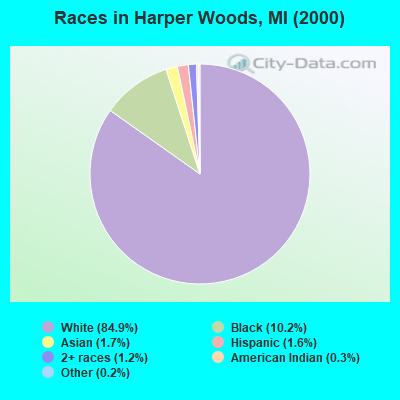
Race distribution in Harper Woods
2000
2022

- 12,09984.9%White alone
- 1,44910.2%Black alone
- 2421.7%Asian alone
- 2241.6%Hispanic
- 1731.2%Two or more races
- 450.3%American Indian alone
- 220.2%Other race alone
-
- 9,38862.2%Black alone
- 4,44629.5%White alone
- 9386.2%Two or more races
- 2071.4%Hispanic
- 380.3%Asian alone
- 260.2%Other race alone
- 200.1%American Indian alone
2000
2022
-
- 7,806,69178.6%White alone
- 1,402,04714.1%Black alone
- 323,8773.3%Hispanic
- 175,3111.8%Asian alone
- 163,4871.6%Two or more races
- 53,4210.5%American Indian alone
- 11,4650.1%Other race alone
- 2,1450.02%Native Hawaiian and Other
Pacific Islander alone

-
- 7,289,05172.6%White alone
- 1,310,46413.1%Black alone
- 572,4055.7%Hispanic
- 450,0314.5%Two or more races
- 335,7323.3%Asian alone
- 45,2170.5%Other race alone
- 29,0110.3%American Indian alone
- 2,2070.02%Native Hawaiian and Other
Pacific Islander alone

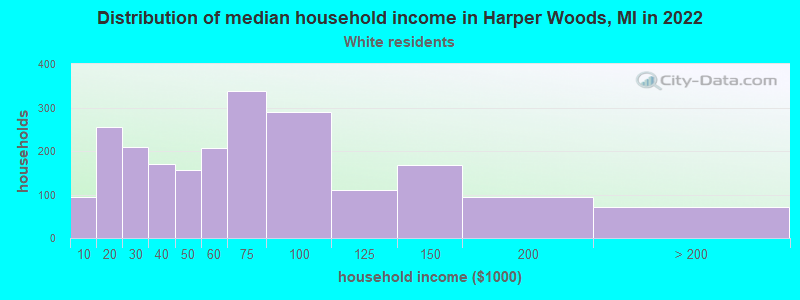
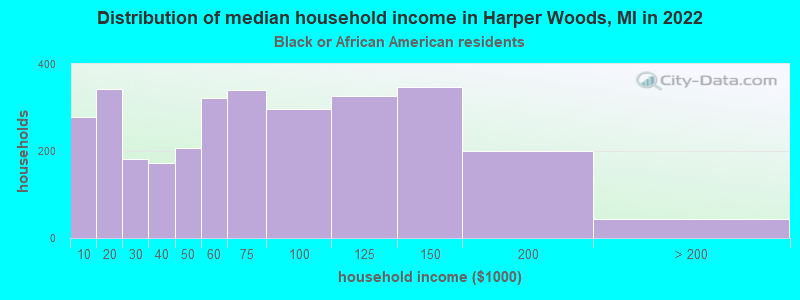
Income and house value in Harper Woods
- Median household income in 2022
- $58,591White non-Hispanic householders
- $61,682Black householders
- $50,958Two or more races householders
- Median 2022 house value
- $150,337White Non-Hispanic householders
- $168,438Black or African American householders
- $130,163American Indian or Alaska Native householders
- $211,135Asian householders
- $117,450Some other race householders
- $98,520Two or more races householders
- $113,305Hispanic or Latino householders
Household income for White non-Hispanic householders
Household income for Black householders
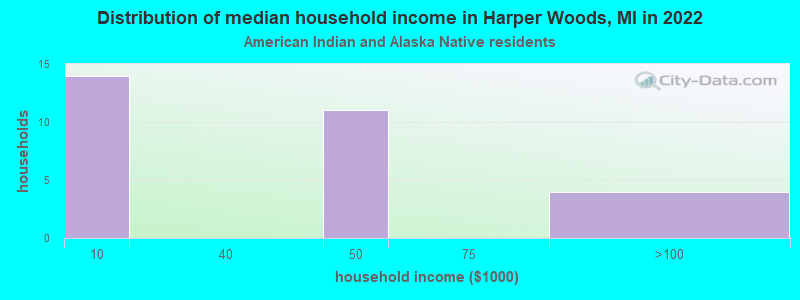
Household income for American Indian and Alaska Native householders
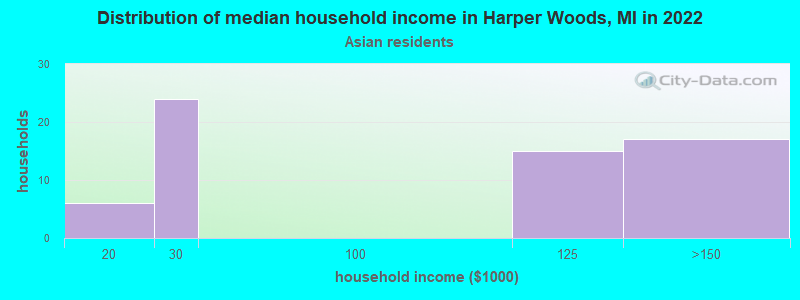
Household income for Asian householders
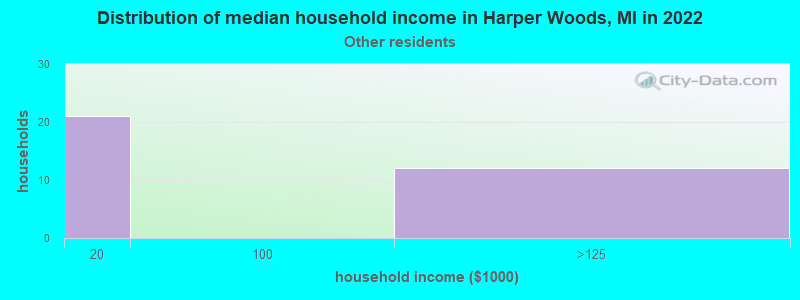
Household income for Some other race householders
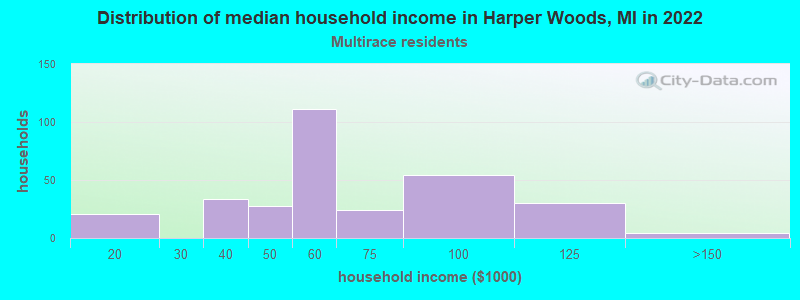
Household income for Two or more races householders
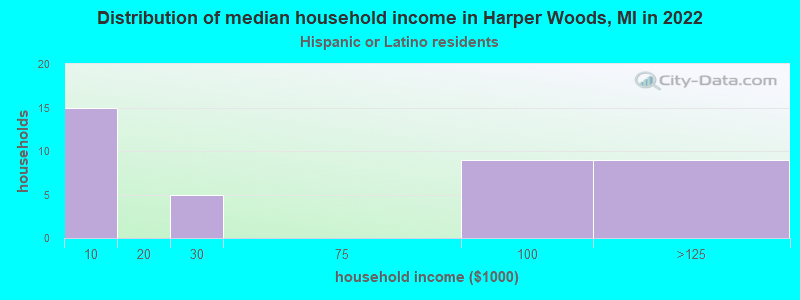
Household income for Hispanic or Latino race householders
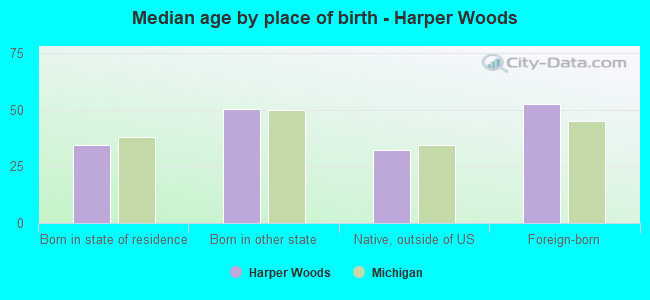
Median age by race in Harper Woods
- 50.3Median age for White residents
- 47.0Males
- 55.9Females
- 31.1Median age for Black or African American residents
- 25.0Males
- 37.9Females
- 44.9Median age for American Indian / Alaska Native residents
- -795,074,757.3Males
- 46.8Females
- 40.2Median age for Asian residents
- 29.8Males
- 41.9Females
- -934,108,526.2Median age for Native Hawaiian / Pacific Islander residents
- -674,772,035.8Males
- -699,588,476.7Females
- 63.8Median age for Other race residents
- -747,549,018.9Males
- -709,523,808.8Females
- 25.2Median age for Two or more races residents
- 9.7Males
- 30.8Females
- 50.0Median age for White alone residents
- 46.6Males
- 56.3Females
- 21.1Median age for Hispanic or Latino residents
- 20.9Males
- 22.2Females
Owner/renter occupied households by race in Harper Woods
- House owners and renters - White residents
- 1,82485.3%Owner occupied
- 31414.7%Renter occupied
- House owners and renters - Black or African American residents
- 1,40046.4%Owner occupied
- 1,61553.6%Renter occupied
- House owners and renters - American Indian / Alaska Native residents
- 1542.4%Owner occupied
- 2057.6%Renter occupied
- House owners and renters - Asian residents
- 7100.0%Owner occupied
- House owners and renters - Other race residents
- 1026.4%Owner occupied
- 2973.6%Renter occupied
- House owners and renters - Two or more races residents
- 9333.8%Owner occupied
- 18266.2%Renter occupied
- House owners and renters - White alone residents
- 1,84085.8%Owner occupied
- 30414.2%Renter occupied
- House owners and renters - Hispanic or Latino residents
- 1025.6%Owner occupied
- 2974.4%Renter occupied
Language usage in Harper Woods
- English speakers - Total
- 94.0% of residents of Harper Woods speak English at home.
- 1.4% of residents speak Spanish at home
- 206100.0%Speak English very well
- 4.0% of residents speak other language at home
- 46280.1%Speak English very well
- 11519.9%Speak English less than very well
- English speakers - Born in the United States
- 95.9% of residents of Harper Woods speak English at home.
- 0.6% of residents speak Spanish at home
- 9100.0%Speak English very well
- 2.6% of residents speak other language at home
- 3286.5%Speak English very well
- 513.5%Speak English less than very well
- English speakers - Native, born elsewhere
- 79.1% of residents of Harper Woods speak English at home.
- 25.6% of residents speak other language at home
- 22100.0%Speak English very well
- English speakers - Foreign-born
- 12.2% of residents of Harper Woods speak English at home.
- 6.8% of residents speak Spanish at home
- 25100.0%Speak English very well
- 77.5% of residents speak other language at home
- 17661.5%Speak English very well
- 11038.5%Speak English less than very well
White (Caucasian) - Speak only English
| Native: | 97.7% (3,908) |
| Foreign-born: | 9.5% (30) |
White (Caucasian) - Speak another language
| Native: | 3.0% (121) |
| Foreign-born: | 90.3% (285) |
Black or African American - Speak only English
| Native: | 96.8% (8,567) |
| Foreign-born: | 100.0% (2) |
American Indian / Alaska Native - Speak only English
| Native: | 82.8% (35) |
| Foreign-born: | 24.8% (4) |
Asian - Speak only English
| Native: | 29.0% (4) |
| Foreign-born: | 23.2% (6) |
Asian - Speak another language
| Native: | 72.8% (10) |
| Foreign-born: | 78.3% (19) |
Other race - Speak another language
| Native: | 53.2% (31) |
| Foreign-born: | 100.0% (18) |
White alone - Speak only English
| Native: | 97.7% (3,929) |
| Foreign-born: | 9.4% (31) |
White alone - Speak another language
| Native: | 2.7% (107) |
| Foreign-born: | 90.8% (296) |
Hispanic or Latino - Speak another language
| Native: | 36.3% (58) |
| Foreign-born: | 100.0% (24) |
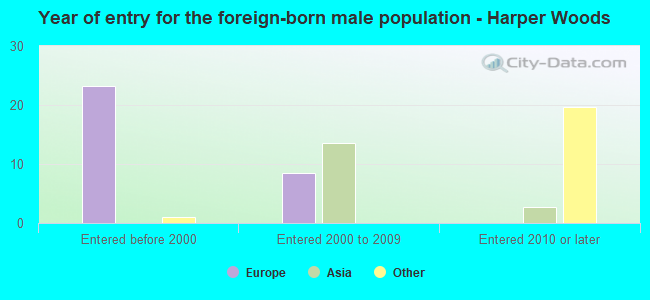
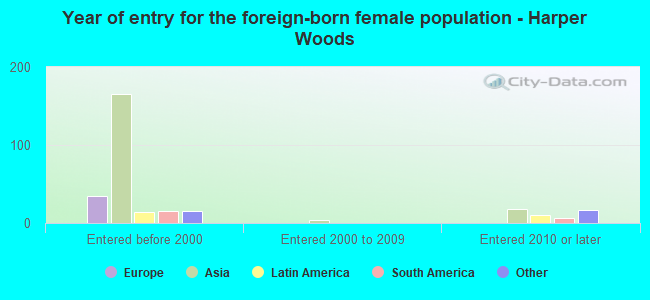
Foreign-born residents in Harper Woods
361 residents are foreign born (1.4% Asia, 0.4% Europe).
| This city: | 2.4% |
| Michigan: | 6.9% |
Marital status for residents in Harper Woods
Marital status - White (Caucasian) population 15 years and over
- Males
- 47.8%Never married
- 28.6%Now married
- 0.6%Separated
- 6.1%Widowed
- 16.9%Divorced
- Females
- 35.7%Never married
- 27.1%Now married
- 1.0%Separated
- 16.1%Widowed
- 20.1%Divorced
Women who gave birth in the past 12 months
| Now married: | 34.6% (8) |
| Unmarried: | 65.4% (16) |
Women who did not give birth in the past 12 months
| Now married: | 26.2% (206) |
| Unmarried: | 73.8% (580) |
Marital status - Black or African American population 15 years and over
- Males
- 63.0%Never married
- 27.7%Now married
- 1.4%Separated
- 2.1%Widowed
- 5.8%Divorced
- Females
- 51.9%Never married
- 24.6%Now married
- 1.4%Separated
- 7.6%Widowed
- 14.5%Divorced
Women who gave birth in the past 12 months
| Now married: | 8.9% (7) |
| Unmarried: | 91.1% (68) |
Women who did not give birth in the past 12 months
| Now married: | 22.2% (572) |
| Unmarried: | 77.8% (2,008) |
Marital status - American Indian / Alaska Native population 15 years and over
- Males
- 100.0%Never married
- 0.0%Now married
- 0.0%Separated
- 0.0%Widowed
- 0.0%Divorced
- Females
- 67.9%Never married
- 0.0%Now married
- 0.0%Separated
- 32.1%Widowed
- 0.0%Divorced
Women who did not give birth in the past 12 months
| Now married: | 0.0% (0) |
| Unmarried: | 100.0% (20) |
Marital status - Asian population 15 years and over
- Males
- 81.8%Never married
- 18.2%Now married
- 0.0%Separated
- 0.0%Widowed
- 0.0%Divorced
- Females
- 33.3%Never married
- 51.9%Now married
- 0.0%Separated
- 0.0%Widowed
- 14.8%Divorced
Women who did not give birth in the past 12 months
| Now married: | 60.9% (14) |
| Unmarried: | 39.1% (9) |
Marital status - Other race population 15 years and over
- Males
- 0.0%Never married
- 24.3%Now married
- 0.0%Separated
- 0.0%Widowed
- 75.7%Divorced
- Females
- 52.9%Never married
- 47.1%Now married
- 0.0%Separated
- 0.0%Widowed
- 0.0%Divorced
Women who did not give birth in the past 12 months
| Now married: | 0.0% (0) |
| Unmarried: | 100.0% (19) |
Marital status - Two or more races population 15 years and over
- Males
- 75.3%Never married
- 16.5%Now married
- 0.0%Separated
- 0.0%Widowed
- 8.2%Divorced
- Females
- 58.4%Never married
- 12.8%Now married
- 0.3%Separated
- 3.5%Widowed
- 25.0%Divorced
Women who gave birth in the past 12 months
| Now married: | 0.0% (0) |
| Unmarried: | 100.0% (21) |
Women who did not give birth in the past 12 months
| Now married: | 15.1% (53) |
| Unmarried: | 84.9% (298) |
Marital status - White alone, not Hispanic / Latino population 15 years and over
- Males
- 47.8%Never married
- 28.6%Now married
- 0.6%Separated
- 6.1%Widowed
- 16.9%Divorced
- Females
- 36.1%Never married
- 26.6%Now married
- 1.0%Separated
- 16.3%Widowed
- 20.0%Divorced
Women who gave birth in the past 12 months
| Now married: | 34.6% (9) |
| Unmarried: | 65.4% (16) |
Women who did not give birth in the past 12 months
| Now married: | 24.7% (193) |
| Unmarried: | 75.3% (586) |
Marital status - Hispanic or Latino population 15 years and over
- Males
- 74.3%Never married
- 25.7%Now married
- 0.0%Separated
- 0.0%Widowed
- 0.0%Divorced
- Females
- 41.1%Never married
- 49.3%Now married
- 0.0%Separated
- 0.0%Widowed
- 9.6%Divorced
Women who did not give birth in the past 12 months
| Now married: | 33.9% (20) |
| Unmarried: | 66.1% (38) |
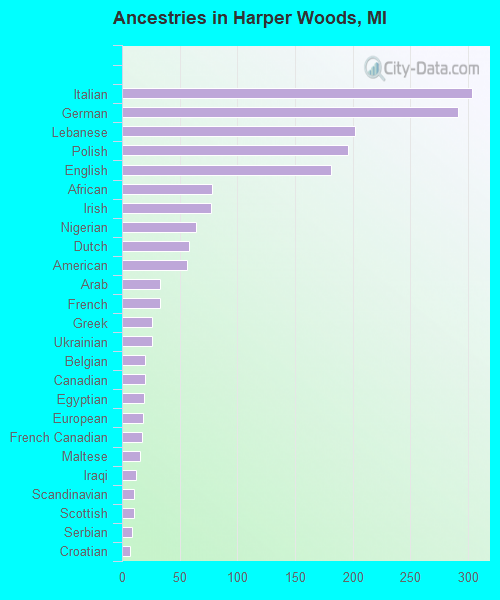
Ancestries in Harper Woods

- 3033.4%Italian
- 2913.3%German
- 2022.3%Lebanese
- 1962.2%Polish
- 1812.1%English
- 780.9%African
- 770.9%Irish
- 640.7%Nigerian
- 580.7%Dutch
- 560.6%American
- 330.4%Arab
- 330.4%French
- 260.3%Greek
- 260.3%Ukrainian
- 200.2%Belgian
- 200.2%Canadian
- 190.2%Egyptian
- 180.2%European
- 170.2%French Canadian
- 160.2%Maltese
- 120.1%Iraqi
- 100.1%Scandinavian
- 100.1%Scottish
- 90.1%Serbian
- 70.08%Croatian
- 60.07%British
- 60.07%Scotch-Irish
- 50.06%Czechoslovakian
- 40.05%Finnish
- 40.05%Lithuanian
- 20.02%Armenian
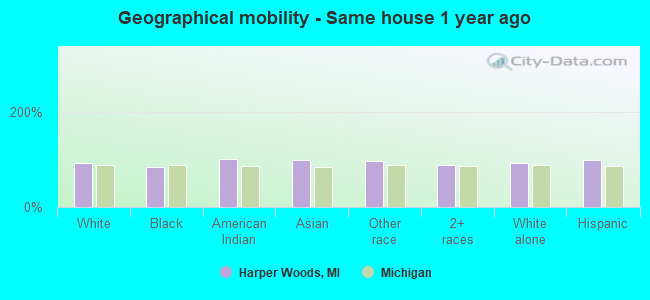
Geographical mobility in Harper Woods

- Same house 1 year ago
- 4,05292.6%White (Caucasian)
- 8,00284.3%Black or African American
- 61100.0%American Indian / Alaska Native
- 3898.1%Asian
- 7296.6%Other race
- 84087.7%Two or more races
- 4,07392.4%White alone, not Hispanic / Latino
- 20598.6%Hispanic or Latino
-
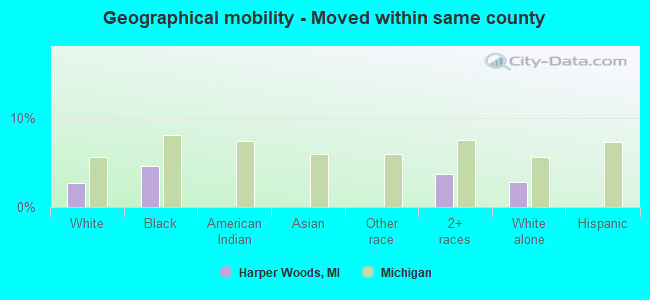
- Moved within same county
- 1172.7%White / Caucasian
- 4384.6%Black or African American
- 353.7%Two or more races
- 1242.8%White alone, not Hispanic / Latino
-
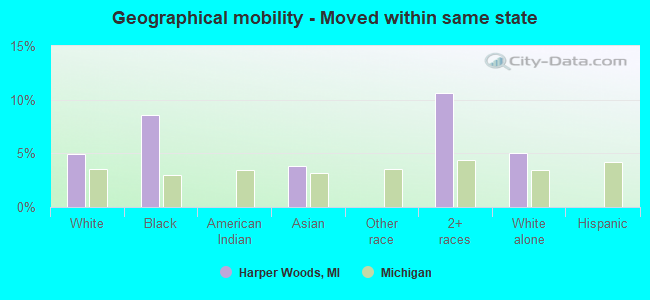
- Moved within same state
- 2185.0%White / Caucasian
- 8168.6%Black or African American
- 13.9%Asian
- 10110.6%Two or more races
- 2225.0%White alone, not Hispanic / Latino
-
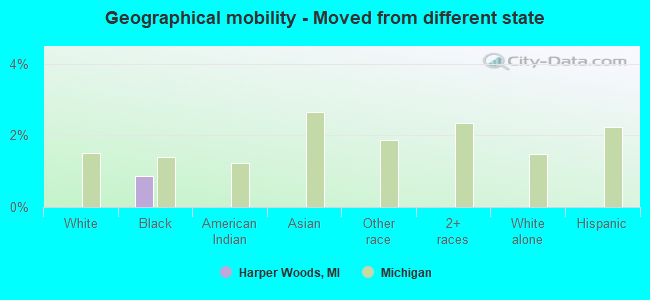
- Moved from different state
- 820.9%Black or African American
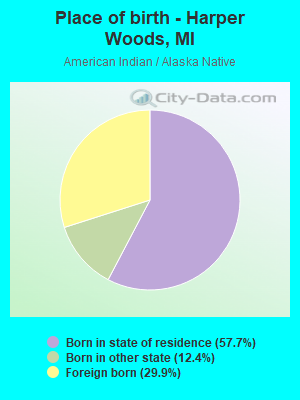
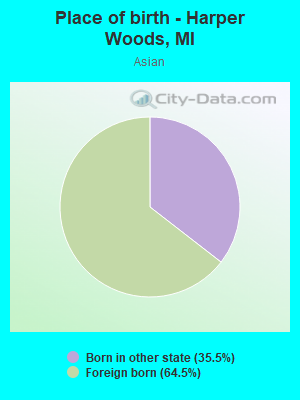
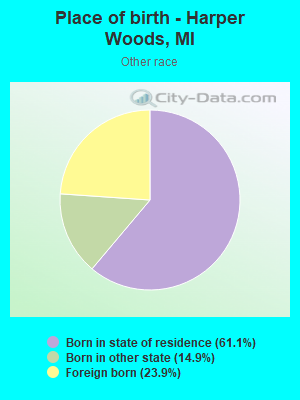
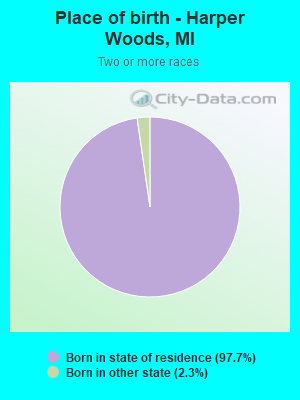
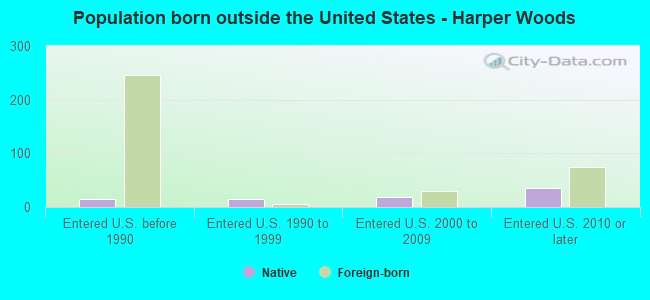
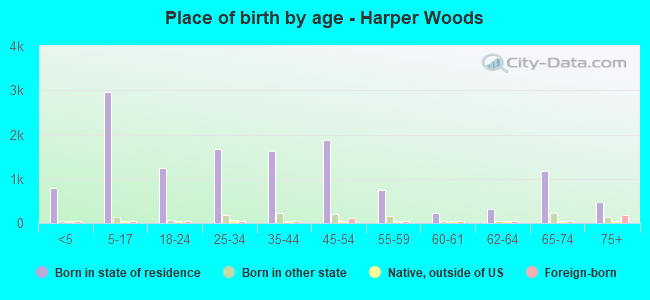
Children Nativity (place of birth) in Harper Woods
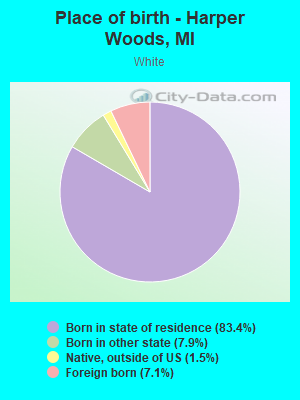
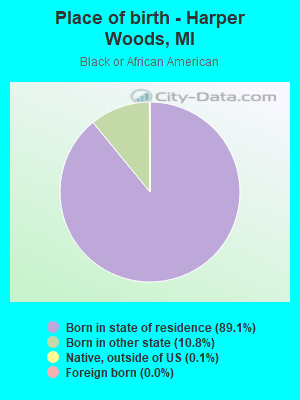
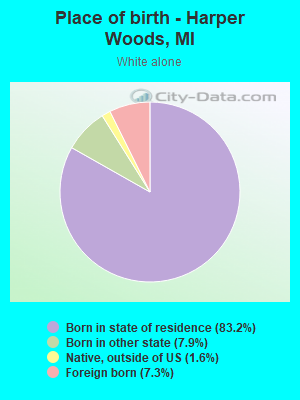
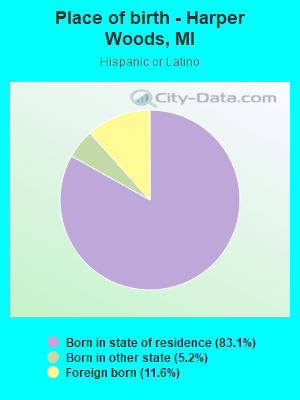
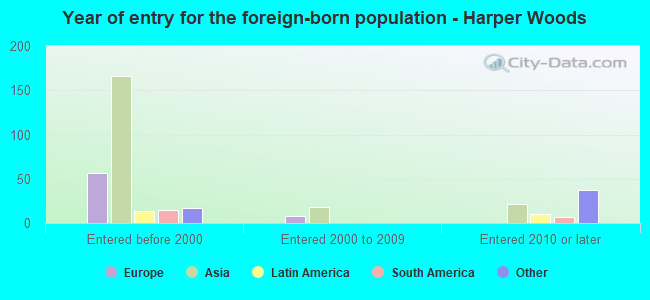
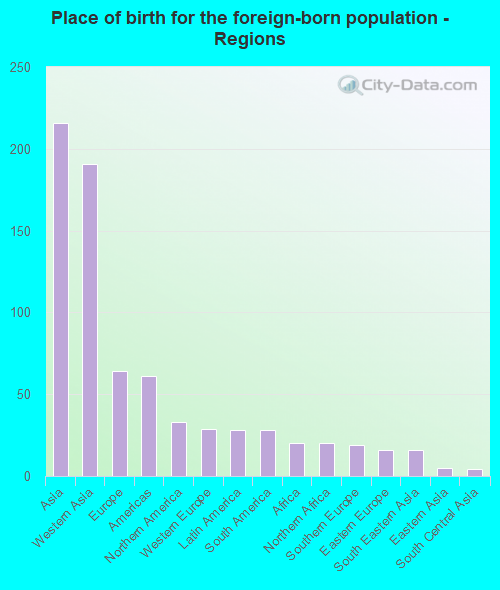
Place of birth for residents in Harper Woods
![Place of birth for the foreign-born population - Regions]()
- 216Asia
- 191Western Asia
- 64Europe
- 61Americas
- 33Northern America
- 29Western Europe
- 28Latin America
- 28South America
- 20Africa
- 20Northern Africa
- 19Southern Europe
- 16Eastern Europe
- 16South Eastern Asia
- 5Eastern Asia
- 4South Central Asia
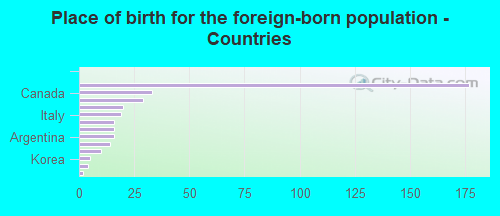
![Place of birth for the foreign-born population - Countries]()
- 177Lebanon
- 33Canada
- 29Germany
- 20Egypt
- 19Italy
- 16Poland
- 16Philippines
- 16Argentina
- 14Iraq
- 10Chile
- 5Korea
- 4India
- 2Guyana
Grandparents responsible for own grandchildren in Harper Woods
Zip codes: 48225.