Races in Hermitage, Pennsylvania (PA) Detailed Stats
Ancestries, Foreign-born residents, place of birth
Settings
X


Recent posts about races in Hermitage, Pennsylvania on our local forum with over 2,400,000 registered users:
 | Larimer: The next frontier for Pittsburgh gentrification... (22 replies) |
| If you could bring back a neighborhood/borough??? (52 replies) |
| Tell me about Hermitage PA please (10 replies) |
| Neighborhood of the week: Homewood (North/South/West) (24 replies) |
| Looking at moving to Hermitage area...advice needed (1 reply) |
| Western Pennsylvania (Sharon and Ambridge) (6 replies) |
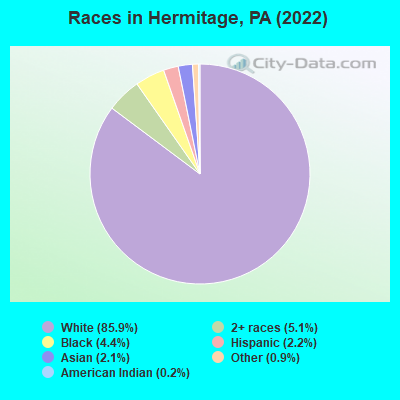
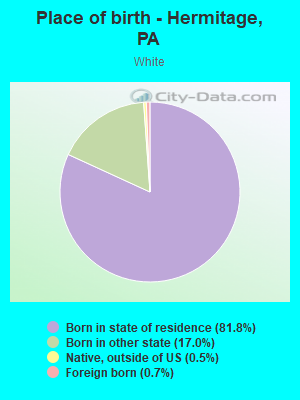
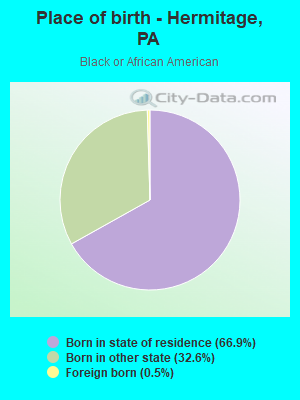
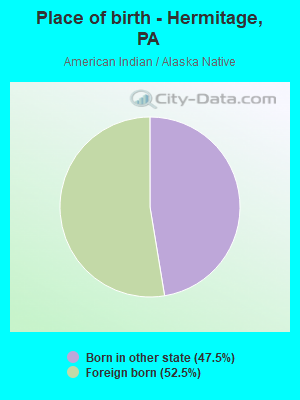
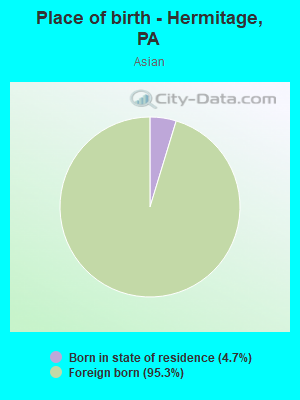
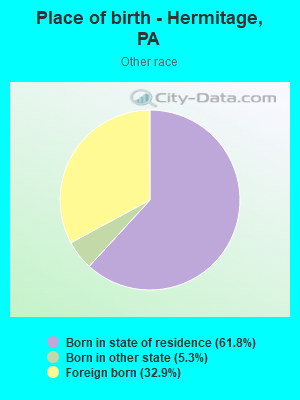
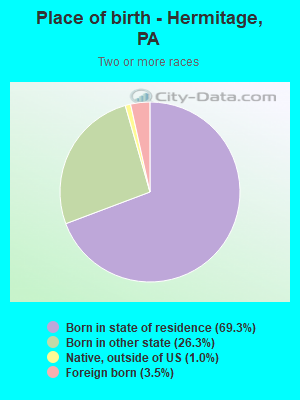
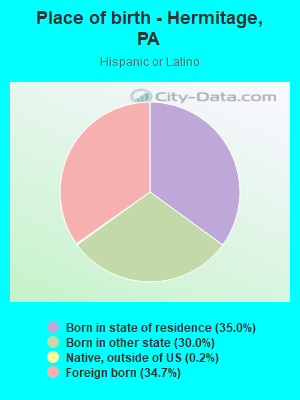
According to 2022 data, the most numerous races in Hermitage, PA are White alone (13,752 residents), Black alone (706 residents), and Hispanic (349 residents). 96.6% of Hermitage residents speak English at home. 2.8% of Hermitage, PA residents are foreign-born (1.4% born in Asia, 0.6% born in Europe, 0.6% born in Latin America), which is 145.8% less than the foreign-born rate of 7.0% across the entire state of Pennsylvania.
Race distribution in Hermitage
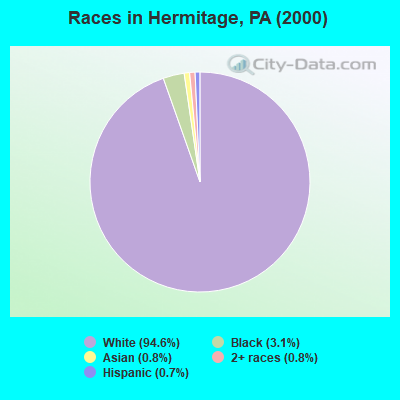
2000
2022

- 15,28494.6%White alone
- 4953.1%Black alone
- 1250.8%Two or more races
- 1300.8%Asian alone
- 1070.7%Hispanic
- 90.06%Other race alone
- 60.04%American Indian alone
- 10.01%Native Hawaiian and Other
Pacific Islander alone
-
- 13,75285.9%White alone
- 8175.1%Two or more races
- 7064.4%Black alone
- 3492.2%Hispanic
- 3382.1%Asian alone
- 1490.9%Other race alone
- 330.2%American Indian alone
2000
2022
-
- 10,322,45584.1%White alone
- 1,202,4379.8%Black alone
- 394,0883.2%Hispanic
- 218,2961.8%Asian alone
- 113,0970.9%Two or more races
- 13,0860.1%Other race alone
- 14,9040.1%American Indian alone
- 2,6910.02%Native Hawaiian and Other
Pacific Islander alone

-
- 9,487,22873.1%White alone
- 1,311,58110.1%Black alone
- 1,115,9978.6%Hispanic
- 493,9423.8%Two or more races
- 487,1243.8%Asian alone
- 63,5820.5%Other race alone
- 10,1300.08%American Indian alone
- 2,4240.02%Native Hawaiian and Other
Pacific Islander alone

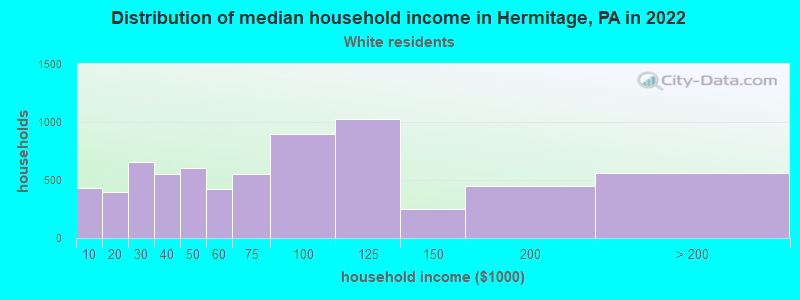
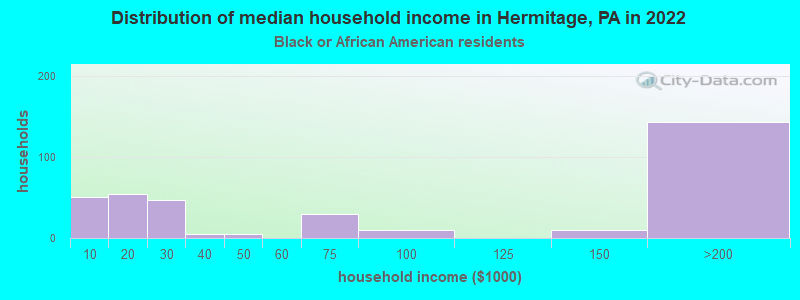
Income and house value in Hermitage
- Median household income in 2022
- $65,748White non-Hispanic householders
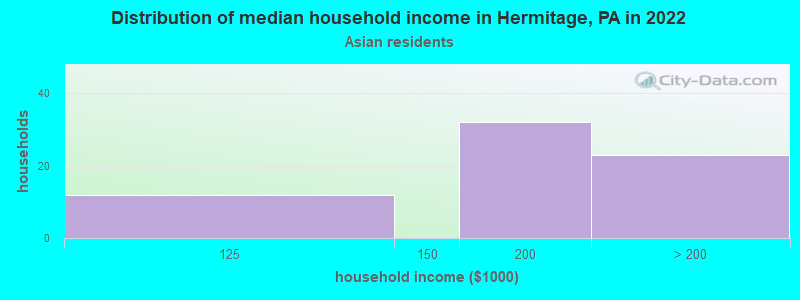
- $175,164Asian householders
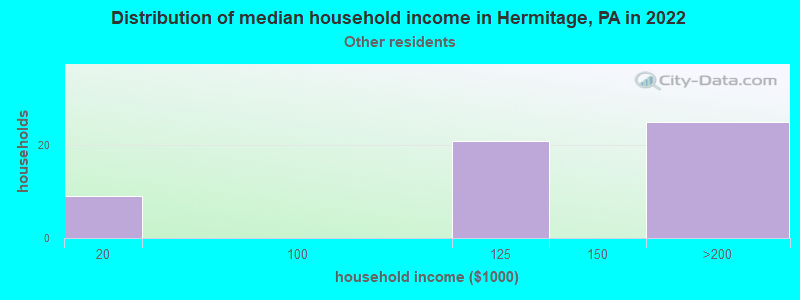
- $120,295Some other race householders
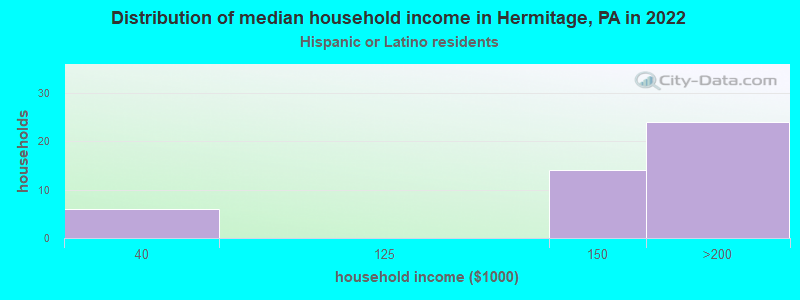
- $154,102Hispanic or Latino race householders
- Median 2022 house value
- $187,373White Non-Hispanic householders
- $169,271Black or African American householders
- $321,981Asian householders
- $163,686Two or more races householders
Household income for White non-Hispanic householders
Household income for Black householders
Household income for Asian householders
Household income for Some other race householders
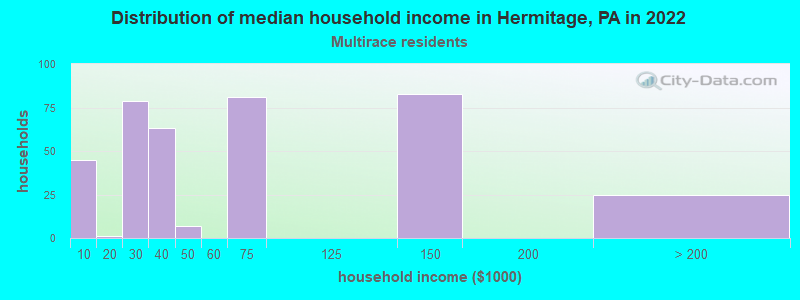
Household income for Two or more races householders
Household income for Hispanic or Latino race householders
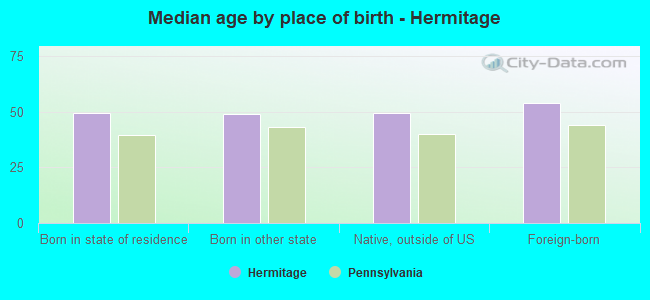
Median age by race in Hermitage
- 52.0Median age for White residents
- 51.6Males
- 52.0Females
- 31.9Median age for Black or African American residents
- 45.3Males
- 42.9Females
- 97.3Median age for American Indian / Alaska Native residents
- -714,583,332.6Males
- -669,972,451.1Females
- 53.5Median age for Asian residents
- 57.4Males
- 53.6Females
- -680,432,644.4Median age for Native Hawaiian / Pacific Islander residents
- -666,666,666.0Males
- -747,474,746.7Females
- 32.0Median age for Other race residents
- 32.8Males
- 30.7Females
- 19.3Median age for Two or more races residents
- 23.4Males
- 29.1Females
- 52.2Median age for White alone residents
- 51.7Males
- 52.1Females
- 18.3Median age for Hispanic or Latino residents
- 23.4Males
- 17.1Females
Owner/renter occupied households by race in Hermitage
- House owners and renters - White residents
- 5,25677.4%Owner occupied
- 1,53222.6%Renter occupied
- House owners and renters - Black or African American residents
- 14551.1%Owner occupied
- 13948.9%Renter occupied
- House owners and renters - Asian residents
- 5480.5%Owner occupied
- 1319.5%Renter occupied
- House owners and renters - Other race residents
- 4481.3%Owner occupied
- 1018.7%Renter occupied
- House owners and renters - Two or more races residents
- 22556.4%Owner occupied
- 17443.6%Renter occupied
- House owners and renters - White alone residents
- 5,25377.5%Owner occupied
- 1,52922.5%Renter occupied
- House owners and renters - Hispanic or Latino residents
- 6385.2%Owner occupied
- 1114.8%Renter occupied
Language usage in Hermitage
- English speakers - Total
- 96.6% of residents of Hermitage speak English at home.
- 0.8% of residents speak Spanish at home
- 7461.7%Speak English very well
- 4638.3%Speak English less than very well
- 2.4% of residents speak other language at home
- 22559.8%Speak English very well
- 15140.2%Speak English less than very well
All residents speak only English at home
- English speakers - Native, born elsewhere
- 37.8% of residents of Hermitage speak English at home.
- 55.6% of residents speak other language at home
- 50100.0%Speak English very well
- English speakers - Foreign-born
- 36.3% of residents of Hermitage speak English at home.
- 13.8% of residents speak Spanish at home
- 1626.7%Speak English very well
- 4473.3%Speak English less than very well
- 50.3% of residents speak other language at home
- 10949.8%Speak English very well
- 11050.2%Speak English less than very well
White (Caucasian) - Speak only English
| Native: | 98.8% (13,146) |
| Foreign-born: | 42.6% (39) |
White (Caucasian) - Speak another language
| Native: | 1.0% (130) |
| Foreign-born: | 61.5% (56) |
American Indian / Alaska Native - Speak only English
| Native: | 84.4% (36) |
| Foreign-born: | 71.9% (29) |
Asian - Speak only English
| Native: | 96.6% (11) |
| Foreign-born: | 26.0% (58) |
Other race - Speak another language
| Native: | 22.3% (33) |
| Foreign-born: | 100.0% (77) |
Two or more races - Speak only English
| Native: | 95.8% (695) |
| Foreign-born: | 82.8% (29) |
White alone - Speak only English
| Native: | 98.6% (13,102) |
| Foreign-born: | 41.4% (39) |
White alone - Speak another language
| Native: | 1.0% (136) |
| Foreign-born: | 64.2% (60) |
Hispanic or Latino - Speak only English
| Native: | 87.9% (206) |
| Foreign-born: | 40.3% (48) |
Hispanic or Latino - Speak another language
| Native: | 13.0% (30) |
| Foreign-born: | 56.8% (68) |
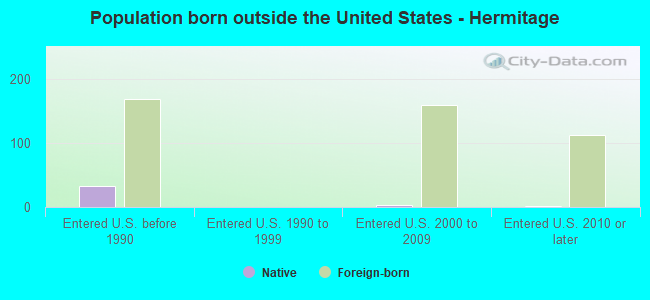
Foreign-born residents in Hermitage
456 residents are foreign born (1.4% Asia, 0.6% Europe, 0.6% Latin America).
| This city: | 2.8% |
| Pennsylvania: | 7.3% |

Marital status for residents in Hermitage
Marital status - White (Caucasian) population 15 years and over
- Males
- 27.3%Never married
- 57.1%Now married
- 0.3%Separated
- 8.4%Widowed
- 7.0%Divorced
- Females
- 19.8%Never married
- 53.7%Now married
- 1.0%Separated
- 15.7%Widowed
- 9.8%Divorced
Women who gave birth in the past 12 months
| Now married: | 100.0% (240) |
| Unmarried: | 0.0% (0) |
Women who did not give birth in the past 12 months
| Now married: | 49.1% (1,212) |
| Unmarried: | 50.9% (1,256) |
Marital status - Black or African American population 15 years and over
- Males
- 30.4%Never married
- 52.1%Now married
- 3.5%Separated
- 1.3%Widowed
- 12.6%Divorced
- Females
- 33.1%Never married
- 56.6%Now married
- 0.0%Separated
- 2.9%Widowed
- 7.4%Divorced
Women who did not give birth in the past 12 months
| Now married: | 61.2% (39) |
| Unmarried: | 38.8% (25) |
Marital status - Asian population 15 years and over
- Males
- 22.7%Never married
- 77.3%Now married
- 0.0%Separated
- 0.0%Widowed
- 0.0%Divorced
- Females
- 26.8%Never married
- 63.8%Now married
- 0.0%Separated
- 0.0%Widowed
- 9.4%Divorced
Women who did not give birth in the past 12 months
| Now married: | 0.0% (0) |
| Unmarried: | 100.0% (35) |
Marital status - Other race population 15 years and over
- Males
- 24.2%Never married
- 47.0%Now married
- 0.0%Separated
- 0.0%Widowed
- 28.8%Divorced
- Females
- 47.5%Never married
- 25.4%Now married
- 0.0%Separated
- 0.0%Widowed
- 27.1%Divorced
Women who did not give birth in the past 12 months
| Now married: | 34.9% (19) |
| Unmarried: | 65.1% (35) |
Marital status - Two or more races population 15 years and over
- Males
- 55.2%Never married
- 40.6%Now married
- 0.0%Separated
- 0.0%Widowed
- 4.2%Divorced
- Females
- 54.7%Never married
- 29.7%Now married
- 0.5%Separated
- 0.0%Widowed
- 15.1%Divorced
Women who gave birth in the past 12 months
| Now married: | 0.0% (0) |
| Unmarried: | 100.0% (91) |
Women who did not give birth in the past 12 months
| Now married: | 7.8% (10) |
| Unmarried: | 92.2% (116) |
Marital status - White alone, not Hispanic / Latino population 15 years and over
- Males
- 26.5%Never married
- 57.7%Now married
- 0.3%Separated
- 8.5%Widowed
- 7.0%Divorced
- Females
- 19.8%Never married
- 53.6%Now married
- 1.0%Separated
- 15.7%Widowed
- 9.8%Divorced
Women who gave birth in the past 12 months
| Now married: | 100.0% (238) |
| Unmarried: | 0.0% (0) |
Women who did not give birth in the past 12 months
| Now married: | 48.9% (1,194) |
| Unmarried: | 51.1% (1,248) |
Marital status - Hispanic or Latino population 15 years and over
- Males
- 60.2%Never married
- 24.1%Now married
- 0.0%Separated
- 0.0%Widowed
- 15.7%Divorced
- Females
- 60.0%Never married
- 15.4%Now married
- 0.0%Separated
- 0.0%Widowed
- 24.6%Divorced
Women who did not give birth in the past 12 months
| Now married: | 20.4% (11) |
| Unmarried: | 79.6% (41) |
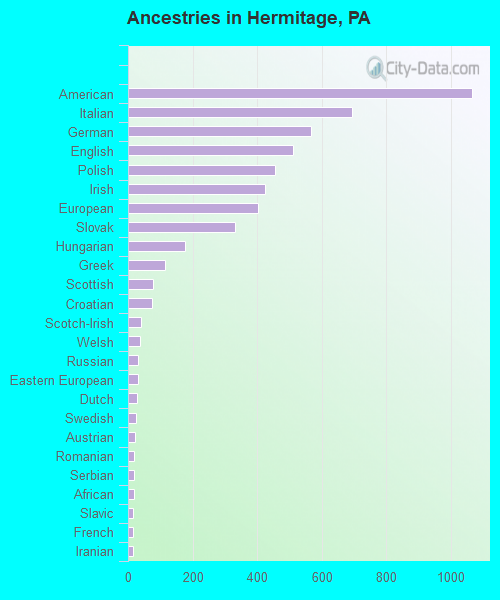
Ancestries in Hermitage

- 1,06516.8%American
- 69511.0%Italian
- 5668.9%German
- 5108.0%English
- 4547.2%Polish
- 4236.7%Irish
- 4036.4%European
- 3325.2%Slovak
- 1772.8%Hungarian
- 1141.8%Greek
- 771.2%Scottish
- 741.2%Croatian
- 390.6%Scotch-Irish
- 370.6%Welsh
- 320.5%Russian
- 310.5%Eastern European
- 270.4%Dutch
- 240.4%Swedish
- 230.4%Austrian
- 200.3%Romanian
- 190.3%Serbian
- 190.3%African
- 170.3%Slavic
- 160.3%French
- 160.3%Iranian
- 120.2%Danish
- 120.2%Scandinavian
- 120.2%Ukrainian
- 120.2%Yugoslavian
- 100.2%Slovene
- 80.1%Czechoslovakian
- 20.03%Moroccan
- 20.03%British
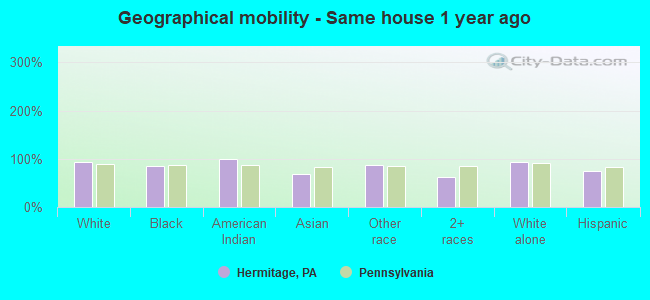
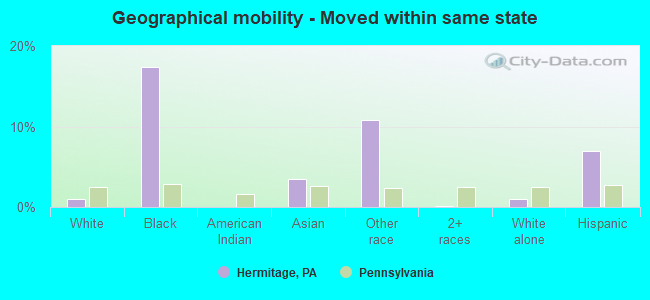
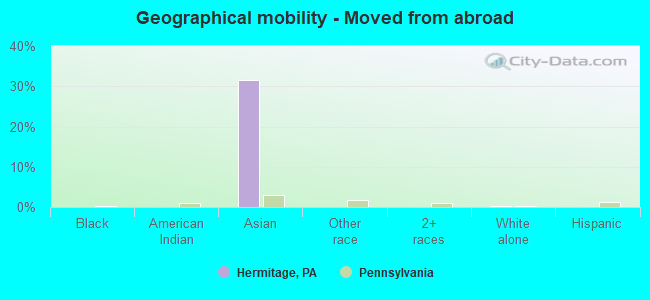
Geographical mobility in Hermitage

- Same house 1 year ago
- 12,88093.8%White (Caucasian)
- 53784.7%Black or African American
- 8399.6%American Indian / Alaska Native
- 16267.6%Asian
- 20087.7%Other race
- 52961.8%Two or more races
- 12,84893.7%White alone, not Hispanic / Latino
- 26474.4%Hispanic or Latino
-
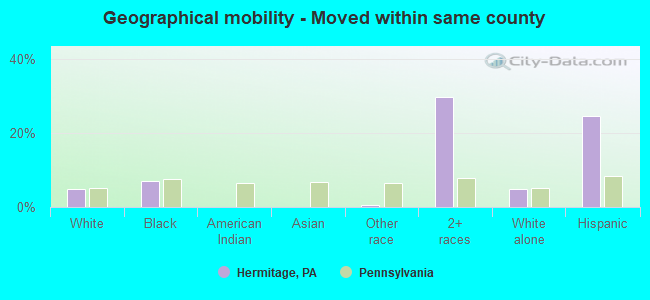
- Moved within same county
- 6724.9%White / Caucasian
- 457.1%Black or African American
- 10.4%Other race
- 25329.6%Two or more races
- 6634.8%White alone, not Hispanic / Latino
- 8724.5%Hispanic or Latino
-
- Moved within same state
- 1341.0%White / Caucasian
- 11017.4%Black or African American
- 83.5%Asian
- 2510.9%Other race
- 10.1%Two or more races
- 1391.0%White alone, not Hispanic / Latino
- 257.0%Hispanic or Latino
-
- Moved from different state
- 850.6%White / Caucasian
- 667.7%Two or more races
- 870.6%White alone, not Hispanic / Latino
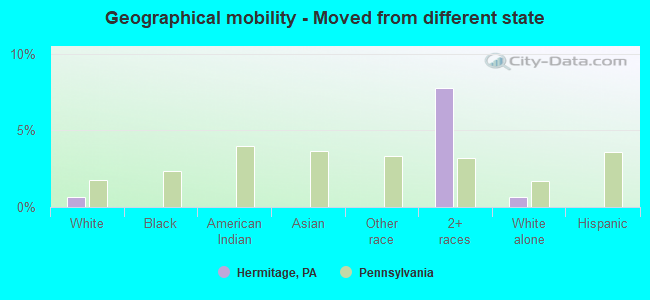
-
- Moved from abroad
- 180.1%White
- 7631.6%Asian
- 210.2%White alone, not Hispanic / Latino
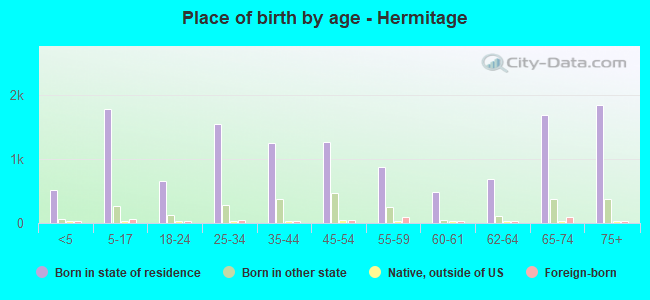
Children Nativity (place of birth) in Hermitage
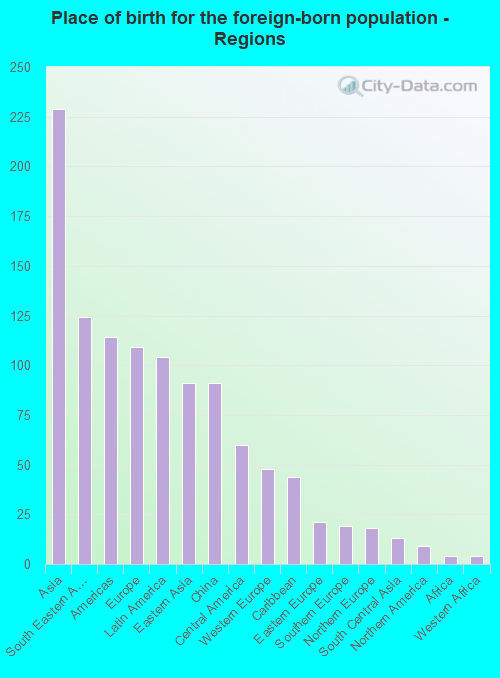
Place of birth for residents in Hermitage
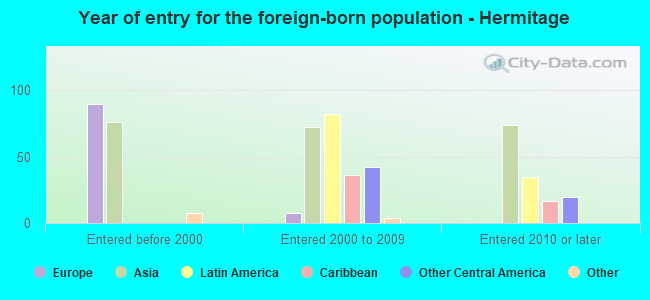
![Place of birth for the foreign-born population - Regions]()
- 229Asia
- 124South Eastern Asia
- 114Americas
- 109Europe
- 104Latin America
- 91Eastern Asia
- 91China
- 60Central America
- 48Western Europe
- 44Caribbean
- 21Eastern Europe
- 19Southern Europe
- 18Northern Europe
- 13South Central Asia
- 9Northern America
- 4Africa
- 4Western Africa
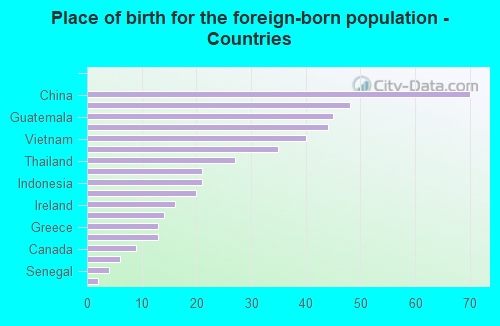
![Place of birth for the foreign-born population - Countries]()
- 70China
- 48Austria
- 45Guatemala
- 44Dominican Republic
- 40Vietnam
- 35Philippines
- 27Thailand
- 21Poland
- 21Indonesia
- 20Taiwan
- 16Ireland
- 14Costa Rica
- 13Greece
- 13Pakistan
- 9Canada
- 6Italy
- 4Senegal
- 2Scotland
Grandparents responsible for own grandchildren in Hermitage
Zip codes: 16159.