Races in Highland Park, Illinois (IL) Detailed Stats
Data:
Races - White alone (%)
Races - White alone (% change since 2000)
Races - Black alone (%)
Races - Black alone (% change since 2000)
Races - American Indian alone (%)
Races - American Indian alone (% change since 2000)
Races - Asian alone (%)
Races - Asian alone (% change since 2000)
Races - Hispanic (%)
Races - Hispanic (% change since 2000)
Races - Native Hawaiian and Other Pacific Islander alone (%)
Races - Native Hawaiian and Other Pacific Islander alone (% change since 2000)
Races - Two or more races(%)
Races - Two or more races(% change since 2000)
Races - Other race alone (%)
Races - Other race alone (% change since 2000)
Racial diversity
Place of birth - Born in state of residence (%)
Place of birth - Born in state of residence (%) - White
Place of birth - Born in state of residence (%) - Black or African American
Place of birth - Born in state of residence (%) - Asian
Place of birth - Born in state of residence (%) - Hispanic or Latino
Place of birth - Born in state of residence (%) - American Indian and Alaska Native
Place of birth - Born in state of residence (%) - Multirace
Place of birth - Born in state of residence (%) - Other Race
Place of birth - Born in other state (%)
Place of birth - Born in other state (%) - White
Place of birth - Born in other state (%) - Black or African American
Place of birth - Born in other state (%) - Asian
Place of birth - Born in other state (%) - Hispanic or Latino
Place of birth - Born in other state (%) - American Indian and Alaska Native
Place of birth - Born in other state (%) - Multirace
Place of birth - Born in other state (%) - Other Race
Place of birth - Native, outside of US (%)
Place of birth - Native, outside of US (%) - White
Place of birth - Native, outside of US (%) - Black or African American
Place of birth - Native, outside of US (%) - Asian
Place of birth - Native, outside of US (%) - Hispanic or Latino
Place of birth - Native, outside of US (%) - American Indian and Alaska Native
Place of birth - Native, outside of US (%) - Multirace
Place of birth - Native, outside of US (%) - Other Race
Place of birth - Foreign born (%)
Place of birth - Foreign born (%) - White
Place of birth - Foreign born (%) - Black or African American
Place of birth - Foreign born (%) - Asian
Place of birth - Foreign born (%) - Hispanic or Latino
Place of birth - Foreign born (%) - American Indian and Alaska Native
Place of birth - Foreign born (%) - Multirace
Place of birth - Foreign born (%) - Other Race
Residents speaking English at home (%)
Residents speaking English at home - Born in the United States (%)
Residents speaking English at home - Native, born elsewhere (%)
Residents speaking English at home - Foreign born (%)
Residents speaking Spanish at home (%)
Residents speaking Spanish at home - Born in the United States (%)
Residents speaking Spanish at home - Native, born elsewhere (%)
Residents speaking Spanish at home - Foreign born (%)
Residents speaking other language at home (%)
Residents speaking other language at home - Born in the United States (%)
Residents speaking other language at home - Native, born elsewhere (%)
Residents speaking other language at home - Foreign born (%)
Marital status - Never married (%)
Marital status - Now married (%)
Marital status - Separated (%)
Marital status - Widowed (%)
Marital status - Divorced (%)
Ancestries Reported - Arab (%)
Ancestries Reported - Czech (%)
Ancestries Reported - Danish (%)
Ancestries Reported - Dutch (%)
Ancestries Reported - English (%)
Ancestries Reported - French (%)
Ancestries Reported - French Canadian (%)
Ancestries Reported - German (%)
Ancestries Reported - Greek (%)
Ancestries Reported - Hungarian (%)
Ancestries Reported - Irish (%)
Ancestries Reported - Italian (%)
Ancestries Reported - Lithuanian (%)
Ancestries Reported - Norwegian (%)
Ancestries Reported - Polish (%)
Ancestries Reported - Portuguese (%)
Ancestries Reported - Russian (%)
Ancestries Reported - Scotch-Irish (%)
Ancestries Reported - Scottish (%)
Ancestries Reported - Slovak (%)
Ancestries Reported - Subsaharan African (%)
Ancestries Reported - Swedish (%)
Ancestries Reported - Swiss (%)
Ancestries Reported - Ukrainian (%)
Ancestries Reported - United States (%)
Ancestries Reported - Welsh (%)
Ancestries Reported - West Indian (%)
Ancestries Reported - Other (%)
Geographical mobility - Same house 1 year ago (%)
Geographical mobility - Same house 1 year ago (%) - White
Geographical mobility - Same house 1 year ago (%) - Black or African American
Geographical mobility - Same house 1 year ago (%) - Asian
Geographical mobility - Same house 1 year ago (%) - Hispanic or Latino
Geographical mobility - Same house 1 year ago (%) - American Indian and Alaska Native
Geographical mobility - Same house 1 year ago (%) - Multirace
Geographical mobility - Same house 1 year ago (%) - Other Race
Geographical mobility - Moved within same county (%)
Geographical mobility - Moved within same county (%) - White
Geographical mobility - Moved within same county (%) - Black or African American
Geographical mobility - Moved within same county (%) - Asian
Geographical mobility - Moved within same county (%) - Hispanic or Latino
Geographical mobility - Moved within same county (%) - American Indian and Alaska Native
Geographical mobility - Moved within same county (%) - Multirace
Geographical mobility - Moved within same county (%) - Other Race
Geographical mobility - Moved from different county within same state (%)
Geographical mobility - Moved from different county within same state (%) - White
Geographical mobility - Moved from different county within same state (%) - Black or African American
Geographical mobility - Moved from different county within same state (%) - Asian
Geographical mobility - Moved from different county within same state (%) - Hispanic or Latino
Geographical mobility - Moved from different county within same state (%) - American Indian and Alaska Native
Geographical mobility - Moved from different county within same state (%) - Multirace
Geographical mobility - Moved from different county within same state (%) - Other Race
Geographical mobility - Moved from different state (%)
Geographical mobility - Moved from different state (%) - White
Geographical mobility - Moved from different state (%) - Black or African American
Geographical mobility - Moved from different state (%) - Asian
Geographical mobility - Moved from different state (%) - Hispanic or Latino
Geographical mobility - Moved from different state (%) - American Indian and Alaska Native
Geographical mobility - Moved from different state (%) - Multirace
Geographical mobility - Moved from different state (%) - Other Race
Geographical mobility - Moved from abroad (%)
Geographical mobility - Moved from abroad (%) - White
Geographical mobility - Moved from abroad (%) - Black or African American
Geographical mobility - Moved from abroad (%) - Asian
Geographical mobility - Moved from abroad (%) - Hispanic or Latino
Geographical mobility - Moved from abroad (%) - American Indian and Alaska Native
Geographical mobility - Moved from abroad (%) - Multirace
Geographical mobility - Moved from abroad (%) - Other Race
Place of birth for the foreign-born population - Ireland (%)
Place of birth for the foreign-born population - Denmark (%)
Place of birth for the foreign-born population - Norway (%)
Place of birth for the foreign-born population - Sweden (%)
Place of birth for the foreign-born population - United Kingdom (%)
Place of birth for the foreign-born population - England (%)
Place of birth for the foreign-born population - Scotland (%)
Place of birth for the foreign-born population - Other Northern Europe (%)
Place of birth for the foreign-born population - Austria (%)
Place of birth for the foreign-born population - Belgium (%)
Place of birth for the foreign-born population - France (%)
Place of birth for the foreign-born population - Germany (%)
Place of birth for the foreign-born population - Netherlands (%)
Place of birth for the foreign-born population - Switzerland (%)
Place of birth for the foreign-born population - Other Western Europe (%)
Place of birth for the foreign-born population - Greece (%)
Place of birth for the foreign-born population - Italy (%)
Place of birth for the foreign-born population - Portugal (%)
Place of birth for the foreign-born population - Spain (%)
Place of birth for the foreign-born population - Other Southern Europe (%)
Place of birth for the foreign-born population - Albania (%)
Place of birth for the foreign-born population - Belarus (%)
Place of birth for the foreign-born population - Bosnia and Herzegovina (%)
Place of birth for the foreign-born population - Bulgaria (%)
Place of birth for the foreign-born population - Croatia (%)
Place of birth for the foreign-born population - Czechoslovakia (%)
Place of birth for the foreign-born population - Hungary (%)
Place of birth for the foreign-born population - Latvia (%)
Place of birth for the foreign-born population - Lithuania (%)
Place of birth for the foreign-born population - North Macedonia (Macedonia) (%)
Place of birth for the foreign-born population - Moldova (%)
Place of birth for the foreign-born population - Poland (%)
Place of birth for the foreign-born population - Romania (%)
Place of birth for the foreign-born population - Russia (%)
Place of birth for the foreign-born population - Serbia (%)
Place of birth for the foreign-born population - Ukraine (%)
Place of birth for the foreign-born population - Other Eastern Europe (%)
Place of birth for the foreign-born population - China (%)
Place of birth for the foreign-born population - Hong Kong (%)
Place of birth for the foreign-born population - Taiwan (%)
Place of birth for the foreign-born population - Japan (%)
Place of birth for the foreign-born population - Korea (%)
Place of birth for the foreign-born population - Other Eastern Asia (%)
Place of birth for the foreign-born population - Afghanistan (%)
Place of birth for the foreign-born population - Bangladesh (%)
Place of birth for the foreign-born population - India (%)
Place of birth for the foreign-born population - Iran (%)
Place of birth for the foreign-born population - Kazakhstan (%)
Place of birth for the foreign-born population - Nepal (%)
Place of birth for the foreign-born population - Pakistan (%)
Place of birth for the foreign-born population - Sri Lanka (%)
Place of birth for the foreign-born population - Uzbekistan (%)
Place of birth for the foreign-born population - Other South Central Asia (%)
Place of birth for the foreign-born population - Burma (%)
Place of birth for the foreign-born population - Cambodia (%)
Place of birth for the foreign-born population - Indonesia (%)
Place of birth for the foreign-born population - Laos (%)
Place of birth for the foreign-born population - Malaysia (%)
Place of birth for the foreign-born population - Philippines (%)
Place of birth for the foreign-born population - Singapore (%)
Place of birth for the foreign-born population - Thailand (%)
Place of birth for the foreign-born population - Vietnam (%)
Place of birth for the foreign-born population - Other South Eastern Asia (%)
Place of birth for the foreign-born population - Armenia (%)
Place of birth for the foreign-born population - Iraq (%)
Place of birth for the foreign-born population - Israel (%)
Place of birth for the foreign-born population - Jordan (%)
Place of birth for the foreign-born population - Kuwait (%)
Place of birth for the foreign-born population - Lebanon (%)
Place of birth for the foreign-born population - Saudi Arabia (%)
Place of birth for the foreign-born population - Syria (%)
Place of birth for the foreign-born population - Turkey (%)
Place of birth for the foreign-born population - Yemen (%)
Place of birth for the foreign-born population - Other Western Asia (%)
Place of birth for the foreign-born population - Eritrea (%)
Place of birth for the foreign-born population - Ethiopia (%)
Place of birth for the foreign-born population - Kenya (%)
Place of birth for the foreign-born population - Somalia (%)
Place of birth for the foreign-born population - Uganda (%)
Place of birth for the foreign-born population - Zimbabwe (%)
Place of birth for the foreign-born population - Other Eastern Africa (%)
Place of birth for the foreign-born population - Cameroon (%)
Place of birth for the foreign-born population - Congo (%)
Place of birth for the foreign-born population - Democratic Republic of Congo (Zaire) (%)
Place of birth for the foreign-born population - Other Middle Africa (%)
Place of birth for the foreign-born population - Egypt (%)
Place of birth for the foreign-born population - Morocco (%)
Place of birth for the foreign-born population - Sudan (%)
Place of birth for the foreign-born population - Other Northern Africa (%)
Place of birth for the foreign-born population - South Africa (%)
Place of birth for the foreign-born population - Other Southern Africa (%)
Place of birth for the foreign-born population - Cabo Verde (%)
Place of birth for the foreign-born population - Ghana (%)
Place of birth for the foreign-born population - Liberia (%)
Place of birth for the foreign-born population - Nigeria (%)
Place of birth for the foreign-born population - Senegal (%)
Place of birth for the foreign-born population - Sierra Leone (%)
Place of birth for the foreign-born population - Other Western Africa (%)
Place of birth for the foreign-born population - Australia (%)
Place of birth for the foreign-born population - New Zealand (%)
Place of birth for the foreign-born population - Fiji (%)
Place of birth for the foreign-born population - Micronesia (%)
Place of birth for the foreign-born population - Bahamas (%)
Place of birth for the foreign-born population - Barbados (%)
Place of birth for the foreign-born population - Cuba (%)
Place of birth for the foreign-born population - Dominica (%)
Place of birth for the foreign-born population - Dominican Republic (%)
Place of birth for the foreign-born population - Grenada (%)
Place of birth for the foreign-born population - Haiti (%)
Place of birth for the foreign-born population - Jamaica (%)
Place of birth for the foreign-born population - St. Vincent and the Grenadines (%)
Place of birth for the foreign-born population - Trinidad and Tobago (%)
Place of birth for the foreign-born population - West Indies (%)
Place of birth for the foreign-born population - Other Caribbean (%)
Place of birth for the foreign-born population - Belize (%)
Place of birth for the foreign-born population - Costa Rica (%)
Place of birth for the foreign-born population - El Salvador (%)
Place of birth for the foreign-born population - Guatemala (%)
Place of birth for the foreign-born population - Honduras (%)
Place of birth for the foreign-born population - Mexico (%)
Place of birth for the foreign-born population - Nicaragua (%)
Place of birth for the foreign-born population - Panama (%)
Place of birth for the foreign-born population - Other Central America (%)
Place of birth for the foreign-born population - Argentina (%)
Place of birth for the foreign-born population - Bolivia (%)
Place of birth for the foreign-born population - Brazil (%)
Place of birth for the foreign-born population - Chile (%)
Place of birth for the foreign-born population - Colombia (%)
Place of birth for the foreign-born population - Ecuador (%)
Place of birth for the foreign-born population - Guyana (%)
Place of birth for the foreign-born population - Peru (%)
Place of birth for the foreign-born population - Uruguay (%)
Place of birth for the foreign-born population - Venezuela (%)
Place of birth for the foreign-born population - Other South America (%)
Place of birth for the foreign-born population - Canada (%)
Place of birth for the foreign-born population - Other Northern America (%)
Place of birth for the foreign-born population - Other (%)
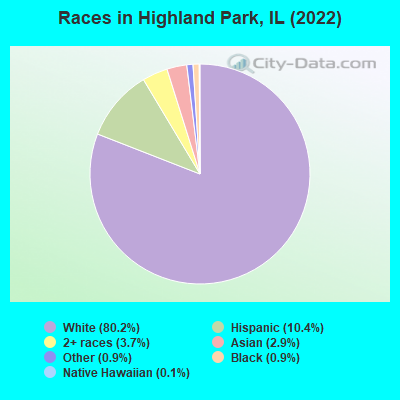
According to 2022 data, the most numerous races in Highland Park, IL are White alone (24,087 residents), Hispanic (3,130 residents), and Black alone (268 residents). 82.9% of Highland Park residents speak English at home. 11.3% of Highland Park, IL residents are foreign-born (4.1% born in Europe, 3.3% born in Latin America, 2.9% born in Asia), which is 23.5% less than the foreign-born rate of 14.0% across the entire state of Illinois.
Race distribution in Highland Park
2000 2022
8,424,140 67.8% White alone 1,856,152 14.9% Black alone 1,530,262 12.3% Hispanic 419,916 3.4% Asian alone 153,996 1.2% Two or more races 13,479 0.1% Other race alone 18,232 0.1% American Indian alone 3,116 0.03% Native Hawaiian and Other
7,356,301 58.5% White alone 2,299,726 18.3% Hispanic 1,660,423 13.2% Black alone 747,296 5.9% Asian alone 458,599 3.6% Two or more races 45,386 0.4% Other race alone 10,405 0.08% American Indian alone 3,896 0.03% Native Hawaiian and Other
Income and house value in Highland Park Median household income in 2022 $164,208 White non-Hispanic householders$149,634 Asian householders$68,479 Some other race householdersover $200,000 Two or more races householders$68,677 Hispanic or Latino race householdersMedian 2022 house value $642,876 White Non-Hispanic householders$278,501 Black or African American householders $665,096 Asian householders$146,184 Some other race householders$244,252 Two or more races householders$328,120 Hispanic or Latino householders
Median age by race in Highland Park
51.9 Median age for White residents50.1 53.3 60.2 Median age for Black or African American residents39.4 67.6 10.2 Median age for American Indian / Alaska Native residents10.9 9.1 50.8 Median age for Asian residents45.7 53.3 -593,236,714.4 Median age for Native Hawaiian / Pacific Islander residents-658,536,584.7 -576,015,108.0 39.7 Median age for Other race residents39.6 39.9 26.5 Median age for Two or more races residents30.9 20.4 50.9 Median age for White alone residents49.8 52.5 32.4 Median age for Hispanic or Latino residents25.4 43.7
Owner/renter occupied households by race in Highland Park
House owners and renters - White residents 8,939 85.7% Owner occupied1,489 14.3% Renter occupiedHouse owners and renters - Black or African American residents 83 94.9% Owner occupied4 5.1% Renter occupiedHouse owners and renters - American Indian / Alaska Native residents 14 100.0% Owner occupiedHouse owners and renters - Asian residents 312 83.4% Owner occupied62 16.6% Renter occupiedHouse owners and renters - Other race residents 100 37.1% Owner occupied170 62.9% Renter occupiedHouse owners and renters - Two or more races residents 631 78.2% Owner occupied176 21.8% Renter occupiedHouse owners and renters - White alone residents 8,881 85.6% Owner occupied1,489 14.4% Renter occupiedHouse owners and renters - Hispanic or Latino residents 685 67.7% Owner occupied327 32.3% Renter occupied
Language usage in Highland Park
English speakers - Total 82.9% of residents of Highland Park speak English at home.
8.2% of residents speak Spanish at home 1,038 44.8% Speak English very well1,280 55.2% Speak English less than very well8.5% of residents speak other language at home 1,752 72.8% Speak English very well654 27.2% Speak English less than very well
English speakers - Born in the United States 88.7% of residents of Highland Park speak English at home.
9.1% of residents speak Spanish at home 251 35.5% Speak English very well456 64.5% Speak English less than very well2.3% of residents speak other language at home 161 90.4% Speak English very well17 9.6% Speak English less than very well
English speakers - Native, born elsewhere 66.5% of residents of Highland Park speak English at home.
16.6% of residents speak Spanish at home 43 78.2% Speak English very well12 21.8% Speak English less than very well15.7% of residents speak other language at home 37 71.2% Speak English very well15 28.8% Speak English less than very well
English speakers - Foreign-born 29.7% of residents of Highland Park speak English at home.
24.8% of residents speak Spanish at home 326 37.2% Speak English very well551 62.8% Speak English less than very well46.4% of residents speak other language at home 1,030 62.8% Speak English very well609 37.2% Speak English less than very well
White (Caucasian) - Speak only English Native:
96.8% (20,225)Foreign-born:
49.6% (759)
White (Caucasian) - Speak another language Native:
4.2% (887)Foreign-born:
58.1% (890)
Black or African American - Speak only English Native:
99.6% (219)Foreign-born:
99.6% (44)
American Indian / Alaska Native - Speak another language Native:
73.9% (94)Foreign-born:
100.0% (31)
Asian - Speak only English Native:
42.6% (79)Foreign-born:
14.0% (92)
Asian - Speak another language Native:
58.3% (109)Foreign-born:
85.3% (558)
Other race - Speak only English Native:
70.5% (310)Foreign-born:
4.4% (19)
Other race - Speak another language Native:
36.6% (161)Foreign-born:
92.4% (396)
Two or more races - Speak only English Native:
67.8% (1,345)Foreign-born:
18.5% (92)
Two or more races - Speak another language Native:
30.1% (598)Foreign-born:
79.4% (393)
White alone - Speak only English Native:
96.4% (20,182)Foreign-born:
42.3% (750)
White alone - Speak another language Native:
3.6% (760)Foreign-born:
58.5% (1,037)
Hispanic or Latino - Speak only English Native:
39.7% (753)Foreign-born:
10.1% (97)
Hispanic or Latino - Speak another language Native:
60.6% (1,149)Foreign-born:
90.7% (868)
Foreign-born residents in Highland Park 3,406 residents are foreign born (4.1% Europe , 3.3% Latin America , 2.9% Asia ).
This city:
11.3%Illinois:
14.1%
Marital status for residents in Highland Park Marital status - White (Caucasian) population 15 years and over
Males 16.2% Never married73.2% Now married0.3% Separated3.6% Widowed6.7% DivorcedFemales 16.1% Never married63.0% Now married0.4% Separated12.5% Widowed8.0% DivorcedWomen who gave birth in the past 12 months Now married:
99.7% (342)Unmarried:
0.3% (1)
Women who did not give birth in the past 12 months Now married:
60.1% (2,063)Unmarried:
39.9% (1,367)
Marital status - Black or African American population 15 years and over
Males 52.6% Never married23.1% Now married0.0% Separated24.4% Widowed0.0% DivorcedFemales 36.3% Never married25.5% Now married0.0% Separated24.8% Widowed13.4% DivorcedWomen who did not give birth in the past 12 months Now married:
53.8% (13)Unmarried:
46.2% (11)
Marital status - American Indian / Alaska Native population 15 years and over
Males 52.6% Never married47.4% Now married0.0% Separated0.0% Widowed0.0% DivorcedFemales 52.6% Never married47.4% Now married0.0% Separated0.0% Widowed0.0% DivorcedWomen who did not give birth in the past 12 months Now married:
47.4% (15)Unmarried:
52.6% (17)
Marital status - Asian population 15 years and over
Males 15.4% Never married80.6% Now married2.5% Separated0.0% Widowed1.6% DivorcedFemales 3.3% Never married91.3% Now married1.7% Separated3.7% Widowed0.0% DivorcedWomen who gave birth in the past 12 months Now married:
100.0% (10)Unmarried:
0.0% (0)
Women who did not give birth in the past 12 months Now married:
100.0% (174)Unmarried:
0.0% (0)
Marital status - Other race population 15 years and over
Males 17.0% Never married62.8% Now married0.0% Separated6.1% Widowed14.1% DivorcedFemales 28.5% Never married48.0% Now married0.0% Separated4.3% Widowed19.2% DivorcedWomen who did not give birth in the past 12 months Now married:
47.9% (70)Unmarried:
52.1% (76)
Marital status - Two or more races population 15 years and over
Males 32.4% Never married48.9% Now married2.2% Separated0.3% Widowed16.4% DivorcedFemales 47.0% Never married49.1% Now married0.0% Separated0.8% Widowed3.2% DivorcedWomen who did not give birth in the past 12 months Now married:
36.0% (195)Unmarried:
64.0% (346)
Marital status - White alone, not Hispanic / Latino population 15 years and over
Males 15.1% Never married73.9% Now married0.3% Separated3.7% Widowed6.9% DivorcedFemales 16.3% Never married65.0% Now married0.4% Separated10.2% Widowed8.2% DivorcedWomen who gave birth in the past 12 months Now married:
99.7% (358)Unmarried:
0.3% (1)
Women who did not give birth in the past 12 months Now married:
61.1% (2,111)Unmarried:
38.9% (1,344)
Marital status - Hispanic or Latino population 15 years and over
Males 30.1% Never married53.4% Now married1.7% Separated0.2% Widowed14.5% DivorcedFemales 18.2% Never married42.7% Now married0.0% Separated29.7% Widowed9.5% DivorcedWomen who gave birth in the past 12 months Now married:
100.0% (7)Unmarried:
0.0% (0)
Women who did not give birth in the past 12 months Now married:
55.4% (293)Unmarried:
44.6% (235)
Ancestries in Highland Park
1,266 9.2% German1,185 8.6% American1,094 7.9% Eastern European979 7.1% Russian746 5.4% Polish739 5.4% European584 4.2% Italian379 2.7% Irish354 2.6% Ukrainian326 2.4% English290 2.1% Lithuanian255 1.8% Hungarian103 0.7% Iranian99 0.7% Swedish81 0.6% French80 0.6% Latvian76 0.6% Bulgarian72 0.5% Yugoslavian71 0.5% Greek69 0.5% Norwegian50 0.4% Northern European49 0.4% Turkish48 0.3% Romanian41 0.3% Czech40 0.3% Austrian39 0.3% Scandinavian31 0.2% Brazilian28 0.2% Belgian27 0.2% Danish23 0.2% Dutch22 0.2% Jamaican20 0.1% Scottish20 0.1% Scotch-Irish19 0.1% British14 0.1% Welsh14 0.1% Barbadian13 0.09% Egyptian13 0.09% Israeli11 0.08% Luxembourger11 0.08% Portuguese10 0.07% Czechoslovakian10 0.07% Serbian9 0.07% Slovene8 0.06% Canadian7 0.05% Lebanese7 0.05% Assyrian6 0.04% Armenian
Geographical mobility in Highland Park Same house 1 year ago 20,648 88.4% White (Caucasian)233 85.1% Black or African American16 8.1% American Indian / Alaska Native717 81.1% Asian29 100.0% Native Hawaiian / Pacific Islander718 77.3% Other race2,315 80.1% Two or more races20,967 88.1% White alone, not Hispanic / Latino2,431 77.8% Hispanic or LatinoMoved within same county 958 4.1% White / Caucasian28 10.2% Black or African American179 93.7% American Indian / Alaska Native46 5.2% Asian126 13.5% Other race81 2.8% Two or more races1,029 4.3% White alone, not Hispanic / Latino272 8.7% Hispanic or LatinoMoved within same state 975 4.2% White / Caucasian12 4.5% Black or African American153 17.4% Asian303 10.5% Two or more races940 4.0% White alone, not Hispanic / Latino340 10.9% Hispanic or LatinoMoved from different state 598 2.6% White / Caucasian10 1.2% Asian43 4.6% Other race59 2.0% Two or more races628 2.6% White alone, not Hispanic / Latino82 2.6% Hispanic or LatinoMoved from abroad 236 1.0% White303 1.3% White alone, not Hispanic / Latino
Children Nativity (place of birth) in Highland Park
Children under 6 years - Living with two parents Both parents native 1,989 100.0% NativeBoth parents foreign-born 76 100.0% NativeOne native, one foreign-born parent 200 100.0% NativeChildren under 6 years - Living with one parent Native parent 26 100.0% NativeForeign-born parent 6 17.8% Native28 82.2% Foreign-bornChildren 6 to 17 years - Living with two parents Both parents native 2,938 99.7% Native10 0.3% Foreign-bornBoth parents foreign-born 254 70.1% Native109 29.9% Foreign-bornOne native, one foreign-born parent 629 100.0% NativeChildren 6 to 17 years - Living with one parent Native parent 465 100.0% NativeForeign-born parent 65 51.8% Native61 48.2% Foreign-born
Grandparents responsible for own grandchildren in Highland Park
Grandparents (30 to 59 years) White / Caucasian 1 12.9% Responsible for grandchildren10 87.1% Not responsible for grandchildrenBlack or African American 10 100.0% Not responsible for grandchildrenOther race 35 100.0% Not responsible for grandchildrenWhite alone, not Hispanic / Latino 2 100.0% Responsible for grandchildrenHispanic or Latino 48 100.0% Not responsible for grandchildrenGrandparents (60 years and over) White / Caucasian 18 15.5% Responsible for grandchildren99 84.5% Not responsible for grandchildrenBlack or African American 20 100.0% Not responsible for grandchildrenOther race 34 100.0% Not responsible for grandchildrenWhite alone, not Hispanic / Latino 22 14.1% Responsible for grandchildren134 85.9% Not responsible for grandchildrenHispanic or Latino 44 100.0% Not responsible for grandchildren