Races in Holmen, Wisconsin (WI) Detailed Stats
Data:
Races - White alone (%)
Races - White alone (% change since 2000)
Races - Black alone (%)
Races - Black alone (% change since 2000)
Races - American Indian alone (%)
Races - American Indian alone (% change since 2000)
Races - Asian alone (%)
Races - Asian alone (% change since 2000)
Races - Hispanic (%)
Races - Hispanic (% change since 2000)
Races - Native Hawaiian and Other Pacific Islander alone (%)
Races - Native Hawaiian and Other Pacific Islander alone (% change since 2000)
Races - Two or more races(%)
Races - Two or more races(% change since 2000)
Races - Other race alone (%)
Races - Other race alone (% change since 2000)
Racial diversity
Place of birth - Born in state of residence (%)
Place of birth - Born in state of residence (%) - White
Place of birth - Born in state of residence (%) - Black or African American
Place of birth - Born in state of residence (%) - Asian
Place of birth - Born in state of residence (%) - Hispanic or Latino
Place of birth - Born in state of residence (%) - American Indian and Alaska Native
Place of birth - Born in state of residence (%) - Multirace
Place of birth - Born in state of residence (%) - Other Race
Place of birth - Born in other state (%)
Place of birth - Born in other state (%) - White
Place of birth - Born in other state (%) - Black or African American
Place of birth - Born in other state (%) - Asian
Place of birth - Born in other state (%) - Hispanic or Latino
Place of birth - Born in other state (%) - American Indian and Alaska Native
Place of birth - Born in other state (%) - Multirace
Place of birth - Born in other state (%) - Other Race
Place of birth - Native, outside of US (%)
Place of birth - Native, outside of US (%) - White
Place of birth - Native, outside of US (%) - Black or African American
Place of birth - Native, outside of US (%) - Asian
Place of birth - Native, outside of US (%) - Hispanic or Latino
Place of birth - Native, outside of US (%) - American Indian and Alaska Native
Place of birth - Native, outside of US (%) - Multirace
Place of birth - Native, outside of US (%) - Other Race
Place of birth - Foreign born (%)
Place of birth - Foreign born (%) - White
Place of birth - Foreign born (%) - Black or African American
Place of birth - Foreign born (%) - Asian
Place of birth - Foreign born (%) - Hispanic or Latino
Place of birth - Foreign born (%) - American Indian and Alaska Native
Place of birth - Foreign born (%) - Multirace
Place of birth - Foreign born (%) - Other Race
Residents speaking English at home (%)
Residents speaking English at home - Born in the United States (%)
Residents speaking English at home - Native, born elsewhere (%)
Residents speaking English at home - Foreign born (%)
Residents speaking Spanish at home (%)
Residents speaking Spanish at home - Born in the United States (%)
Residents speaking Spanish at home - Native, born elsewhere (%)
Residents speaking Spanish at home - Foreign born (%)
Residents speaking other language at home (%)
Residents speaking other language at home - Born in the United States (%)
Residents speaking other language at home - Native, born elsewhere (%)
Residents speaking other language at home - Foreign born (%)
Marital status - Never married (%)
Marital status - Now married (%)
Marital status - Separated (%)
Marital status - Widowed (%)
Marital status - Divorced (%)
Ancestries Reported - Arab (%)
Ancestries Reported - Czech (%)
Ancestries Reported - Danish (%)
Ancestries Reported - Dutch (%)
Ancestries Reported - English (%)
Ancestries Reported - French (%)
Ancestries Reported - French Canadian (%)
Ancestries Reported - German (%)
Ancestries Reported - Greek (%)
Ancestries Reported - Hungarian (%)
Ancestries Reported - Irish (%)
Ancestries Reported - Italian (%)
Ancestries Reported - Lithuanian (%)
Ancestries Reported - Norwegian (%)
Ancestries Reported - Polish (%)
Ancestries Reported - Portuguese (%)
Ancestries Reported - Russian (%)
Ancestries Reported - Scotch-Irish (%)
Ancestries Reported - Scottish (%)
Ancestries Reported - Slovak (%)
Ancestries Reported - Subsaharan African (%)
Ancestries Reported - Swedish (%)
Ancestries Reported - Swiss (%)
Ancestries Reported - Ukrainian (%)
Ancestries Reported - United States (%)
Ancestries Reported - Welsh (%)
Ancestries Reported - West Indian (%)
Ancestries Reported - Other (%)
Geographical mobility - Same house 1 year ago (%)
Geographical mobility - Same house 1 year ago (%) - White
Geographical mobility - Same house 1 year ago (%) - Black or African American
Geographical mobility - Same house 1 year ago (%) - Asian
Geographical mobility - Same house 1 year ago (%) - Hispanic or Latino
Geographical mobility - Same house 1 year ago (%) - American Indian and Alaska Native
Geographical mobility - Same house 1 year ago (%) - Multirace
Geographical mobility - Same house 1 year ago (%) - Other Race
Geographical mobility - Moved within same county (%)
Geographical mobility - Moved within same county (%) - White
Geographical mobility - Moved within same county (%) - Black or African American
Geographical mobility - Moved within same county (%) - Asian
Geographical mobility - Moved within same county (%) - Hispanic or Latino
Geographical mobility - Moved within same county (%) - American Indian and Alaska Native
Geographical mobility - Moved within same county (%) - Multirace
Geographical mobility - Moved within same county (%) - Other Race
Geographical mobility - Moved from different county within same state (%)
Geographical mobility - Moved from different county within same state (%) - White
Geographical mobility - Moved from different county within same state (%) - Black or African American
Geographical mobility - Moved from different county within same state (%) - Asian
Geographical mobility - Moved from different county within same state (%) - Hispanic or Latino
Geographical mobility - Moved from different county within same state (%) - American Indian and Alaska Native
Geographical mobility - Moved from different county within same state (%) - Multirace
Geographical mobility - Moved from different county within same state (%) - Other Race
Geographical mobility - Moved from different state (%)
Geographical mobility - Moved from different state (%) - White
Geographical mobility - Moved from different state (%) - Black or African American
Geographical mobility - Moved from different state (%) - Asian
Geographical mobility - Moved from different state (%) - Hispanic or Latino
Geographical mobility - Moved from different state (%) - American Indian and Alaska Native
Geographical mobility - Moved from different state (%) - Multirace
Geographical mobility - Moved from different state (%) - Other Race
Geographical mobility - Moved from abroad (%)
Geographical mobility - Moved from abroad (%) - White
Geographical mobility - Moved from abroad (%) - Black or African American
Geographical mobility - Moved from abroad (%) - Asian
Geographical mobility - Moved from abroad (%) - Hispanic or Latino
Geographical mobility - Moved from abroad (%) - American Indian and Alaska Native
Geographical mobility - Moved from abroad (%) - Multirace
Geographical mobility - Moved from abroad (%) - Other Race
Place of birth for the foreign-born population - Ireland (%)
Place of birth for the foreign-born population - Denmark (%)
Place of birth for the foreign-born population - Norway (%)
Place of birth for the foreign-born population - Sweden (%)
Place of birth for the foreign-born population - United Kingdom (%)
Place of birth for the foreign-born population - England (%)
Place of birth for the foreign-born population - Scotland (%)
Place of birth for the foreign-born population - Other Northern Europe (%)
Place of birth for the foreign-born population - Austria (%)
Place of birth for the foreign-born population - Belgium (%)
Place of birth for the foreign-born population - France (%)
Place of birth for the foreign-born population - Germany (%)
Place of birth for the foreign-born population - Netherlands (%)
Place of birth for the foreign-born population - Switzerland (%)
Place of birth for the foreign-born population - Other Western Europe (%)
Place of birth for the foreign-born population - Greece (%)
Place of birth for the foreign-born population - Italy (%)
Place of birth for the foreign-born population - Portugal (%)
Place of birth for the foreign-born population - Spain (%)
Place of birth for the foreign-born population - Other Southern Europe (%)
Place of birth for the foreign-born population - Albania (%)
Place of birth for the foreign-born population - Belarus (%)
Place of birth for the foreign-born population - Bosnia and Herzegovina (%)
Place of birth for the foreign-born population - Bulgaria (%)
Place of birth for the foreign-born population - Croatia (%)
Place of birth for the foreign-born population - Czechoslovakia (%)
Place of birth for the foreign-born population - Hungary (%)
Place of birth for the foreign-born population - Latvia (%)
Place of birth for the foreign-born population - Lithuania (%)
Place of birth for the foreign-born population - North Macedonia (Macedonia) (%)
Place of birth for the foreign-born population - Moldova (%)
Place of birth for the foreign-born population - Poland (%)
Place of birth for the foreign-born population - Romania (%)
Place of birth for the foreign-born population - Russia (%)
Place of birth for the foreign-born population - Serbia (%)
Place of birth for the foreign-born population - Ukraine (%)
Place of birth for the foreign-born population - Other Eastern Europe (%)
Place of birth for the foreign-born population - China (%)
Place of birth for the foreign-born population - Hong Kong (%)
Place of birth for the foreign-born population - Taiwan (%)
Place of birth for the foreign-born population - Japan (%)
Place of birth for the foreign-born population - Korea (%)
Place of birth for the foreign-born population - Other Eastern Asia (%)
Place of birth for the foreign-born population - Afghanistan (%)
Place of birth for the foreign-born population - Bangladesh (%)
Place of birth for the foreign-born population - India (%)
Place of birth for the foreign-born population - Iran (%)
Place of birth for the foreign-born population - Kazakhstan (%)
Place of birth for the foreign-born population - Nepal (%)
Place of birth for the foreign-born population - Pakistan (%)
Place of birth for the foreign-born population - Sri Lanka (%)
Place of birth for the foreign-born population - Uzbekistan (%)
Place of birth for the foreign-born population - Other South Central Asia (%)
Place of birth for the foreign-born population - Burma (%)
Place of birth for the foreign-born population - Cambodia (%)
Place of birth for the foreign-born population - Indonesia (%)
Place of birth for the foreign-born population - Laos (%)
Place of birth for the foreign-born population - Malaysia (%)
Place of birth for the foreign-born population - Philippines (%)
Place of birth for the foreign-born population - Singapore (%)
Place of birth for the foreign-born population - Thailand (%)
Place of birth for the foreign-born population - Vietnam (%)
Place of birth for the foreign-born population - Other South Eastern Asia (%)
Place of birth for the foreign-born population - Armenia (%)
Place of birth for the foreign-born population - Iraq (%)
Place of birth for the foreign-born population - Israel (%)
Place of birth for the foreign-born population - Jordan (%)
Place of birth for the foreign-born population - Kuwait (%)
Place of birth for the foreign-born population - Lebanon (%)
Place of birth for the foreign-born population - Saudi Arabia (%)
Place of birth for the foreign-born population - Syria (%)
Place of birth for the foreign-born population - Turkey (%)
Place of birth for the foreign-born population - Yemen (%)
Place of birth for the foreign-born population - Other Western Asia (%)
Place of birth for the foreign-born population - Eritrea (%)
Place of birth for the foreign-born population - Ethiopia (%)
Place of birth for the foreign-born population - Kenya (%)
Place of birth for the foreign-born population - Somalia (%)
Place of birth for the foreign-born population - Uganda (%)
Place of birth for the foreign-born population - Zimbabwe (%)
Place of birth for the foreign-born population - Other Eastern Africa (%)
Place of birth for the foreign-born population - Cameroon (%)
Place of birth for the foreign-born population - Congo (%)
Place of birth for the foreign-born population - Democratic Republic of Congo (Zaire) (%)
Place of birth for the foreign-born population - Other Middle Africa (%)
Place of birth for the foreign-born population - Egypt (%)
Place of birth for the foreign-born population - Morocco (%)
Place of birth for the foreign-born population - Sudan (%)
Place of birth for the foreign-born population - Other Northern Africa (%)
Place of birth for the foreign-born population - South Africa (%)
Place of birth for the foreign-born population - Other Southern Africa (%)
Place of birth for the foreign-born population - Cabo Verde (%)
Place of birth for the foreign-born population - Ghana (%)
Place of birth for the foreign-born population - Liberia (%)
Place of birth for the foreign-born population - Nigeria (%)
Place of birth for the foreign-born population - Senegal (%)
Place of birth for the foreign-born population - Sierra Leone (%)
Place of birth for the foreign-born population - Other Western Africa (%)
Place of birth for the foreign-born population - Australia (%)
Place of birth for the foreign-born population - New Zealand (%)
Place of birth for the foreign-born population - Fiji (%)
Place of birth for the foreign-born population - Micronesia (%)
Place of birth for the foreign-born population - Bahamas (%)
Place of birth for the foreign-born population - Barbados (%)
Place of birth for the foreign-born population - Cuba (%)
Place of birth for the foreign-born population - Dominica (%)
Place of birth for the foreign-born population - Dominican Republic (%)
Place of birth for the foreign-born population - Grenada (%)
Place of birth for the foreign-born population - Haiti (%)
Place of birth for the foreign-born population - Jamaica (%)
Place of birth for the foreign-born population - St. Vincent and the Grenadines (%)
Place of birth for the foreign-born population - Trinidad and Tobago (%)
Place of birth for the foreign-born population - West Indies (%)
Place of birth for the foreign-born population - Other Caribbean (%)
Place of birth for the foreign-born population - Belize (%)
Place of birth for the foreign-born population - Costa Rica (%)
Place of birth for the foreign-born population - El Salvador (%)
Place of birth for the foreign-born population - Guatemala (%)
Place of birth for the foreign-born population - Honduras (%)
Place of birth for the foreign-born population - Mexico (%)
Place of birth for the foreign-born population - Nicaragua (%)
Place of birth for the foreign-born population - Panama (%)
Place of birth for the foreign-born population - Other Central America (%)
Place of birth for the foreign-born population - Argentina (%)
Place of birth for the foreign-born population - Bolivia (%)
Place of birth for the foreign-born population - Brazil (%)
Place of birth for the foreign-born population - Chile (%)
Place of birth for the foreign-born population - Colombia (%)
Place of birth for the foreign-born population - Ecuador (%)
Place of birth for the foreign-born population - Guyana (%)
Place of birth for the foreign-born population - Peru (%)
Place of birth for the foreign-born population - Uruguay (%)
Place of birth for the foreign-born population - Venezuela (%)
Place of birth for the foreign-born population - Other South America (%)
Place of birth for the foreign-born population - Canada (%)
Place of birth for the foreign-born population - Other Northern America (%)
Place of birth for the foreign-born population - Other (%)
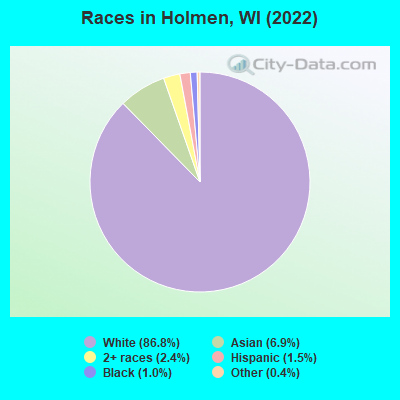
According to 2022 data, the most numerous races in Holmen, WI are White alone (9,381 residents), Hispanic (167 residents), and Black alone (108 residents). 92.9% of Holmen residents speak English at home. 3.1% of Holmen, WI residents are foreign-born (2.5% born in Asia), which is 63.8% less than the foreign-born rate of 5.0% across the entire state of Wisconsin.
Race distribution in Holmen
2000 2022
4,681,630 87.3% White alone 300,245 5.6% Black alone 192,921 3.6% Hispanic 87,995 1.6% Asian alone 51,921 1.0% Two or more races 43,980 0.8% American Indian alone 3,637 0.07% Other race alone 1,346 0.03% Native Hawaiian and Other
4,654,031 79.0% White alone 447,022 7.6% Hispanic 345,678 5.9% Black alone 217,532 3.7% Two or more races 172,242 2.9% Asian alone 33,762 0.6% American Indian alone 19,680 0.3% Other race alone 2,592 0.04% Native Hawaiian and Other
Income and house value in Holmen Median household income in 2022 $78,669 White non-Hispanic householders$87,719 Two or more races householdersMedian 2022 house value $300,771 White Non-Hispanic householders$239,154 American Indian or Alaska Native householders $274,324 Asian householders$154,747 Some other race householders$386,867 Two or more races householders$162,625 Hispanic or Latino householders
Median age by race in Holmen
41.1 Median age for White residents36.4 43.7 16.3 Median age for Black or African American residents-546,525,323.4 16.6 -576,305,220.3 Median age for American Indian / Alaska Native residents-666,666,666.0 -696,412,947.7 22.3 Median age for Asian residents20.6 25.3 -825,688,072.6 Median age for Native Hawaiian / Pacific Islander residents-666,666,666.0 -732,444,443.7 55.2 Median age for Other race residents51.3 34.7 37.1 Median age for Two or more races residents38.3 36.2 41.3 Median age for White alone residents36.8 43.8 10.5 Median age for Hispanic or Latino residents35.2 3.6
Owner/renter occupied households by race in Holmen
House owners and renters - White residents 2,551 63.2% Owner occupied1,483 36.8% Renter occupiedHouse owners and renters - Black or African American residents 25 100.0% Owner occupiedHouse owners and renters - Asian residents 98 67.5% Owner occupied47 32.5% Renter occupiedHouse owners and renters - Other race residents 50 100.0% Owner occupiedHouse owners and renters - Two or more races residents 127 81.5% Owner occupied29 18.5% Renter occupiedHouse owners and renters - White alone residents 2,548 63.3% Owner occupied1,477 36.7% Renter occupiedHouse owners and renters - Hispanic or Latino residents 61 100.0% Owner occupied
Language usage in Holmen
English speakers - Total 92.9% of residents of Holmen speak English at home.
0.2% of residents speak Spanish at home 2 11.1% Speak English very well16 88.9% Speak English less than very well7.7% of residents speak other language at home 489 61.4% Speak English very well307 38.6% Speak English less than very well
English speakers - Born in the United States 94.7% of residents of Holmen speak English at home.
0.6% of residents speak Spanish at home 14 100.0% Speak English less than very well5.4% of residents speak other language at home 83 61.9% Speak English very well51 38.1% Speak English less than very well
English speakers - Native, born elsewhere 59.6% of residents of Holmen speak English at home.
13.1% of residents speak other language at home 13 100.0% Speak English very well
English speakers - Foreign-born 9.7% of residents of Holmen speak English at home.
93.5% of residents speak other language at home 209 58.4% Speak English very well149 41.6% Speak English less than very well
White (Caucasian) - Speak only English Native:
97.4% (8,806)Foreign-born:
27.5% (15)
White (Caucasian) - Speak another language Native:
2.6% (239)Foreign-born:
84.6% (46)
Asian - Speak another language Native:
36.6% (111)Foreign-born:
100.0% (287)
Other race - Speak only English Native:
100.0% (64)Foreign-born:
100.0% (25)
White alone - Speak only English Native:
97.4% (8,768)Foreign-born:
26.8% (15)
White alone - Speak another language Native:
2.6% (234)Foreign-born:
87.7% (49)
Hispanic or Latino - Speak only English Native:
73.7% (84)Foreign-born:
92.5% (39)
Foreign-born residents in Holmen 330 residents are foreign born (2.5% Asia ).
This city:
3.1%Wisconsin:
5.0%
Marital status for residents in Holmen Marital status - White (Caucasian) population 15 years and over
Males 36.2% Never married53.0% Now married0.9% Separated3.5% Widowed6.3% DivorcedFemales 27.5% Never married51.3% Now married0.0% Separated7.0% Widowed14.2% DivorcedWomen who gave birth in the past 12 months Now married:
61.3% (57)Unmarried:
38.7% (36)
Women who did not give birth in the past 12 months Now married:
45.2% (949)Unmarried:
54.8% (1,151)
Marital status - Black or African American population 15 years and over
Males 38.5% Never married0.0% Now married0.0% Separated0.0% Widowed61.5% DivorcedFemales 100.0% Never married0.0% Now married0.0% Separated0.0% Widowed0.0% DivorcedWomen who did not give birth in the past 12 months Now married:
0.0% (0)Unmarried:
100.0% (14)
Marital status - Asian population 15 years and over
Males 22.0% Never married78.0% Now married0.0% Separated0.0% Widowed0.0% DivorcedFemales 34.0% Never married51.0% Now married0.0% Separated14.9% Widowed0.0% DivorcedWomen who gave birth in the past 12 months Now married:
100.0% (36)Unmarried:
0.0% (0)
Women who did not give birth in the past 12 months Now married:
37.4% (48)Unmarried:
62.6% (81)
Marital status - Other race population 15 years and over
Males 0.0% Never married47.4% Now married0.0% Separated0.0% Widowed52.6% DivorcedFemales 59.1% Never married36.4% Now married0.0% Separated4.5% Widowed0.0% DivorcedWomen who did not give birth in the past 12 months Now married:
0.0% (0)Unmarried:
100.0% (12)
Marital status - Two or more races population 15 years and over
Males 84.8% Never married0.0% Now married0.0% Separated0.0% Widowed15.2% DivorcedFemales 34.3% Never married50.5% Now married0.0% Separated0.0% Widowed15.2% DivorcedWomen who did not give birth in the past 12 months Now married:
25.7% (27)Unmarried:
74.3% (77)
Marital status - White alone, not Hispanic / Latino population 15 years and over
Males 36.2% Never married53.0% Now married0.9% Separated3.5% Widowed6.3% DivorcedFemales 27.5% Never married51.4% Now married0.0% Separated7.0% Widowed14.2% DivorcedWomen who gave birth in the past 12 months Now married:
61.3% (57)Unmarried:
38.7% (36)
Women who did not give birth in the past 12 months Now married:
45.2% (941)Unmarried:
54.8% (1,141)
Marital status - Hispanic or Latino population 15 years and over
Males 0.0% Never married41.2% Now married0.0% Separated0.0% Widowed58.8% DivorcedFemales 0.0% Never married83.3% Now married0.0% Separated16.7% Widowed0.0% DivorcedWomen who did not give birth in the past 12 months Now married:
100.0% (6)Unmarried:
0.0% (0)
Ancestries in Holmen
1,802 40.1% German412 9.2% Norwegian333 7.4% Irish255 5.7% American127 2.8% European118 2.6% English95 2.1% Scandinavian76 1.7% French Canadian41 0.9% Polish38 0.8% Swedish30 0.7% Italian26 0.6% Scottish23 0.5% Canadian15 0.3% British14 0.3% Eastern European12 0.3% Lithuanian11 0.2% Czech11 0.2% Dutch10 0.2% Hungarian10 0.2% Yugoslavian8 0.2% Danish
Children Nativity (place of birth) in Holmen
Children under 6 years - Living with two parents Both parents native 474 100.0% NativeBoth parents foreign-born 32 100.0% NativeOne native, one foreign-born parent 74 100.0% NativeChildren under 6 years - Living with one parent Native parent 69 100.0% Native
Children 6 to 17 years - Living with two parents Both parents native 1,497 100.0% NativeBoth parents foreign-born 48 100.0% NativeOne native, one foreign-born parent 27 100.0% NativeChildren 6 to 17 years - Living with one parent Native parent 460 100.0% Native
Grandparents responsible for own grandchildren in Holmen
Grandparents (30 to 59 years) White / Caucasian 10 100.0% Not responsible for grandchildrenWhite alone, not Hispanic / Latino 10 100.0% Not responsible for grandchildrenGrandparents (60 years and over) White / Caucasian 2 7.2% Responsible for grandchildren23 92.8% Not responsible for grandchildrenWhite alone, not Hispanic / Latino 2 7.1% Responsible for grandchildren24 92.9% Not responsible for grandchildren