Races in Howard, Wisconsin (WI) Detailed Stats Ancestries, Foreign-born residents, place of birth
Data:
Races - White alone (%)
Races - White alone (% change since 2000)
Races - Black alone (%)
Races - Black alone (% change since 2000)
Races - American Indian alone (%)
Races - American Indian alone (% change since 2000)
Races - Asian alone (%)
Races - Asian alone (% change since 2000)
Races - Hispanic (%)
Races - Hispanic (% change since 2000)
Races - Native Hawaiian and Other Pacific Islander alone (%)
Races - Native Hawaiian and Other Pacific Islander alone (% change since 2000)
Races - Two or more races(%)
Races - Two or more races(% change since 2000)
Races - Other race alone (%)
Races - Other race alone (% change since 2000)
Racial diversity
Place of birth - Born in state of residence (%)
Place of birth - Born in state of residence (%) - White
Place of birth - Born in state of residence (%) - Black or African American
Place of birth - Born in state of residence (%) - Asian
Place of birth - Born in state of residence (%) - Hispanic or Latino
Place of birth - Born in state of residence (%) - American Indian and Alaska Native
Place of birth - Born in state of residence (%) - Multirace
Place of birth - Born in state of residence (%) - Other Race
Place of birth - Born in other state (%)
Place of birth - Born in other state (%) - White
Place of birth - Born in other state (%) - Black or African American
Place of birth - Born in other state (%) - Asian
Place of birth - Born in other state (%) - Hispanic or Latino
Place of birth - Born in other state (%) - American Indian and Alaska Native
Place of birth - Born in other state (%) - Multirace
Place of birth - Born in other state (%) - Other Race
Place of birth - Native, outside of US (%)
Place of birth - Native, outside of US (%) - White
Place of birth - Native, outside of US (%) - Black or African American
Place of birth - Native, outside of US (%) - Asian
Place of birth - Native, outside of US (%) - Hispanic or Latino
Place of birth - Native, outside of US (%) - American Indian and Alaska Native
Place of birth - Native, outside of US (%) - Multirace
Place of birth - Native, outside of US (%) - Other Race
Place of birth - Foreign born (%)
Place of birth - Foreign born (%) - White
Place of birth - Foreign born (%) - Black or African American
Place of birth - Foreign born (%) - Asian
Place of birth - Foreign born (%) - Hispanic or Latino
Place of birth - Foreign born (%) - American Indian and Alaska Native
Place of birth - Foreign born (%) - Multirace
Place of birth - Foreign born (%) - Other Race
Residents speaking English at home (%)
Residents speaking English at home - Born in the United States (%)
Residents speaking English at home - Native, born elsewhere (%)
Residents speaking English at home - Foreign born (%)
Residents speaking Spanish at home (%)
Residents speaking Spanish at home - Born in the United States (%)
Residents speaking Spanish at home - Native, born elsewhere (%)
Residents speaking Spanish at home - Foreign born (%)
Residents speaking other language at home (%)
Residents speaking other language at home - Born in the United States (%)
Residents speaking other language at home - Native, born elsewhere (%)
Residents speaking other language at home - Foreign born (%)
Marital status - Never married (%)
Marital status - Now married (%)
Marital status - Separated (%)
Marital status - Widowed (%)
Marital status - Divorced (%)
Ancestries Reported - Arab (%)
Ancestries Reported - Czech (%)
Ancestries Reported - Danish (%)
Ancestries Reported - Dutch (%)
Ancestries Reported - English (%)
Ancestries Reported - French (%)
Ancestries Reported - French Canadian (%)
Ancestries Reported - German (%)
Ancestries Reported - Greek (%)
Ancestries Reported - Hungarian (%)
Ancestries Reported - Irish (%)
Ancestries Reported - Italian (%)
Ancestries Reported - Lithuanian (%)
Ancestries Reported - Norwegian (%)
Ancestries Reported - Polish (%)
Ancestries Reported - Portuguese (%)
Ancestries Reported - Russian (%)
Ancestries Reported - Scotch-Irish (%)
Ancestries Reported - Scottish (%)
Ancestries Reported - Slovak (%)
Ancestries Reported - Subsaharan African (%)
Ancestries Reported - Swedish (%)
Ancestries Reported - Swiss (%)
Ancestries Reported - Ukrainian (%)
Ancestries Reported - United States (%)
Ancestries Reported - Welsh (%)
Ancestries Reported - West Indian (%)
Ancestries Reported - Other (%)
Geographical mobility - Same house 1 year ago (%)
Geographical mobility - Same house 1 year ago (%) - White
Geographical mobility - Same house 1 year ago (%) - Black or African American
Geographical mobility - Same house 1 year ago (%) - Asian
Geographical mobility - Same house 1 year ago (%) - Hispanic or Latino
Geographical mobility - Same house 1 year ago (%) - American Indian and Alaska Native
Geographical mobility - Same house 1 year ago (%) - Multirace
Geographical mobility - Same house 1 year ago (%) - Other Race
Geographical mobility - Moved within same county (%)
Geographical mobility - Moved within same county (%) - White
Geographical mobility - Moved within same county (%) - Black or African American
Geographical mobility - Moved within same county (%) - Asian
Geographical mobility - Moved within same county (%) - Hispanic or Latino
Geographical mobility - Moved within same county (%) - American Indian and Alaska Native
Geographical mobility - Moved within same county (%) - Multirace
Geographical mobility - Moved within same county (%) - Other Race
Geographical mobility - Moved from different county within same state (%)
Geographical mobility - Moved from different county within same state (%) - White
Geographical mobility - Moved from different county within same state (%) - Black or African American
Geographical mobility - Moved from different county within same state (%) - Asian
Geographical mobility - Moved from different county within same state (%) - Hispanic or Latino
Geographical mobility - Moved from different county within same state (%) - American Indian and Alaska Native
Geographical mobility - Moved from different county within same state (%) - Multirace
Geographical mobility - Moved from different county within same state (%) - Other Race
Geographical mobility - Moved from different state (%)
Geographical mobility - Moved from different state (%) - White
Geographical mobility - Moved from different state (%) - Black or African American
Geographical mobility - Moved from different state (%) - Asian
Geographical mobility - Moved from different state (%) - Hispanic or Latino
Geographical mobility - Moved from different state (%) - American Indian and Alaska Native
Geographical mobility - Moved from different state (%) - Multirace
Geographical mobility - Moved from different state (%) - Other Race
Geographical mobility - Moved from abroad (%)
Geographical mobility - Moved from abroad (%) - White
Geographical mobility - Moved from abroad (%) - Black or African American
Geographical mobility - Moved from abroad (%) - Asian
Geographical mobility - Moved from abroad (%) - Hispanic or Latino
Geographical mobility - Moved from abroad (%) - American Indian and Alaska Native
Geographical mobility - Moved from abroad (%) - Multirace
Geographical mobility - Moved from abroad (%) - Other Race
Place of birth for the foreign-born population - Ireland (%)
Place of birth for the foreign-born population - Denmark (%)
Place of birth for the foreign-born population - Norway (%)
Place of birth for the foreign-born population - Sweden (%)
Place of birth for the foreign-born population - United Kingdom (%)
Place of birth for the foreign-born population - England (%)
Place of birth for the foreign-born population - Scotland (%)
Place of birth for the foreign-born population - Other Northern Europe (%)
Place of birth for the foreign-born population - Austria (%)
Place of birth for the foreign-born population - Belgium (%)
Place of birth for the foreign-born population - France (%)
Place of birth for the foreign-born population - Germany (%)
Place of birth for the foreign-born population - Netherlands (%)
Place of birth for the foreign-born population - Switzerland (%)
Place of birth for the foreign-born population - Other Western Europe (%)
Place of birth for the foreign-born population - Greece (%)
Place of birth for the foreign-born population - Italy (%)
Place of birth for the foreign-born population - Portugal (%)
Place of birth for the foreign-born population - Spain (%)
Place of birth for the foreign-born population - Other Southern Europe (%)
Place of birth for the foreign-born population - Albania (%)
Place of birth for the foreign-born population - Belarus (%)
Place of birth for the foreign-born population - Bosnia and Herzegovina (%)
Place of birth for the foreign-born population - Bulgaria (%)
Place of birth for the foreign-born population - Croatia (%)
Place of birth for the foreign-born population - Czechoslovakia (%)
Place of birth for the foreign-born population - Hungary (%)
Place of birth for the foreign-born population - Latvia (%)
Place of birth for the foreign-born population - Lithuania (%)
Place of birth for the foreign-born population - North Macedonia (Macedonia) (%)
Place of birth for the foreign-born population - Moldova (%)
Place of birth for the foreign-born population - Poland (%)
Place of birth for the foreign-born population - Romania (%)
Place of birth for the foreign-born population - Russia (%)
Place of birth for the foreign-born population - Serbia (%)
Place of birth for the foreign-born population - Ukraine (%)
Place of birth for the foreign-born population - Other Eastern Europe (%)
Place of birth for the foreign-born population - China (%)
Place of birth for the foreign-born population - Hong Kong (%)
Place of birth for the foreign-born population - Taiwan (%)
Place of birth for the foreign-born population - Japan (%)
Place of birth for the foreign-born population - Korea (%)
Place of birth for the foreign-born population - Other Eastern Asia (%)
Place of birth for the foreign-born population - Afghanistan (%)
Place of birth for the foreign-born population - Bangladesh (%)
Place of birth for the foreign-born population - India (%)
Place of birth for the foreign-born population - Iran (%)
Place of birth for the foreign-born population - Kazakhstan (%)
Place of birth for the foreign-born population - Nepal (%)
Place of birth for the foreign-born population - Pakistan (%)
Place of birth for the foreign-born population - Sri Lanka (%)
Place of birth for the foreign-born population - Uzbekistan (%)
Place of birth for the foreign-born population - Other South Central Asia (%)
Place of birth for the foreign-born population - Burma (%)
Place of birth for the foreign-born population - Cambodia (%)
Place of birth for the foreign-born population - Indonesia (%)
Place of birth for the foreign-born population - Laos (%)
Place of birth for the foreign-born population - Malaysia (%)
Place of birth for the foreign-born population - Philippines (%)
Place of birth for the foreign-born population - Singapore (%)
Place of birth for the foreign-born population - Thailand (%)
Place of birth for the foreign-born population - Vietnam (%)
Place of birth for the foreign-born population - Other South Eastern Asia (%)
Place of birth for the foreign-born population - Armenia (%)
Place of birth for the foreign-born population - Iraq (%)
Place of birth for the foreign-born population - Israel (%)
Place of birth for the foreign-born population - Jordan (%)
Place of birth for the foreign-born population - Kuwait (%)
Place of birth for the foreign-born population - Lebanon (%)
Place of birth for the foreign-born population - Saudi Arabia (%)
Place of birth for the foreign-born population - Syria (%)
Place of birth for the foreign-born population - Turkey (%)
Place of birth for the foreign-born population - Yemen (%)
Place of birth for the foreign-born population - Other Western Asia (%)
Place of birth for the foreign-born population - Eritrea (%)
Place of birth for the foreign-born population - Ethiopia (%)
Place of birth for the foreign-born population - Kenya (%)
Place of birth for the foreign-born population - Somalia (%)
Place of birth for the foreign-born population - Uganda (%)
Place of birth for the foreign-born population - Zimbabwe (%)
Place of birth for the foreign-born population - Other Eastern Africa (%)
Place of birth for the foreign-born population - Cameroon (%)
Place of birth for the foreign-born population - Congo (%)
Place of birth for the foreign-born population - Democratic Republic of Congo (Zaire) (%)
Place of birth for the foreign-born population - Other Middle Africa (%)
Place of birth for the foreign-born population - Egypt (%)
Place of birth for the foreign-born population - Morocco (%)
Place of birth for the foreign-born population - Sudan (%)
Place of birth for the foreign-born population - Other Northern Africa (%)
Place of birth for the foreign-born population - South Africa (%)
Place of birth for the foreign-born population - Other Southern Africa (%)
Place of birth for the foreign-born population - Cabo Verde (%)
Place of birth for the foreign-born population - Ghana (%)
Place of birth for the foreign-born population - Liberia (%)
Place of birth for the foreign-born population - Nigeria (%)
Place of birth for the foreign-born population - Senegal (%)
Place of birth for the foreign-born population - Sierra Leone (%)
Place of birth for the foreign-born population - Other Western Africa (%)
Place of birth for the foreign-born population - Australia (%)
Place of birth for the foreign-born population - New Zealand (%)
Place of birth for the foreign-born population - Fiji (%)
Place of birth for the foreign-born population - Micronesia (%)
Place of birth for the foreign-born population - Bahamas (%)
Place of birth for the foreign-born population - Barbados (%)
Place of birth for the foreign-born population - Cuba (%)
Place of birth for the foreign-born population - Dominica (%)
Place of birth for the foreign-born population - Dominican Republic (%)
Place of birth for the foreign-born population - Grenada (%)
Place of birth for the foreign-born population - Haiti (%)
Place of birth for the foreign-born population - Jamaica (%)
Place of birth for the foreign-born population - St. Vincent and the Grenadines (%)
Place of birth for the foreign-born population - Trinidad and Tobago (%)
Place of birth for the foreign-born population - West Indies (%)
Place of birth for the foreign-born population - Other Caribbean (%)
Place of birth for the foreign-born population - Belize (%)
Place of birth for the foreign-born population - Costa Rica (%)
Place of birth for the foreign-born population - El Salvador (%)
Place of birth for the foreign-born population - Guatemala (%)
Place of birth for the foreign-born population - Honduras (%)
Place of birth for the foreign-born population - Mexico (%)
Place of birth for the foreign-born population - Nicaragua (%)
Place of birth for the foreign-born population - Panama (%)
Place of birth for the foreign-born population - Other Central America (%)
Place of birth for the foreign-born population - Argentina (%)
Place of birth for the foreign-born population - Bolivia (%)
Place of birth for the foreign-born population - Brazil (%)
Place of birth for the foreign-born population - Chile (%)
Place of birth for the foreign-born population - Colombia (%)
Place of birth for the foreign-born population - Ecuador (%)
Place of birth for the foreign-born population - Guyana (%)
Place of birth for the foreign-born population - Peru (%)
Place of birth for the foreign-born population - Uruguay (%)
Place of birth for the foreign-born population - Venezuela (%)
Place of birth for the foreign-born population - Other South America (%)
Place of birth for the foreign-born population - Canada (%)
Place of birth for the foreign-born population - Other Northern America (%)
Place of birth for the foreign-born population - Other (%)
Latest news about races in Howard, WI collected exclusively by city-data.com from local newspapers, TV, and radio stations
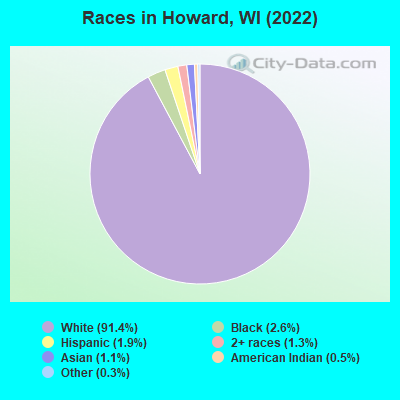
According to 2022 data, the most numerous races in Howard, WI are White alone (18,407 residents), Hispanic (389 residents), and Black alone (523 residents). 97.6% of Howard residents speak English at home. 2.2% of Howard, WI residents are foreign-born (0.6% born in Europe, 0.6% born in Asia, 0.5% born in North America, 0.4% born in Latin America), which is 131.6% less than the foreign-born rate of 5.0% across the entire state of Wisconsin.
Race distribution in Howard
2000
2022
4,681,630 87.3% White alone
300,245 5.6% Black alone
192,921 3.6% Hispanic
87,995 1.6% Asian alone
51,921 1.0% Two or more races
43,980 0.8% American Indian alone
3,637 0.07% Other race alone
1,346 0.03% Native Hawaiian and Other Pacific Islander alone
4,654,031 79.0% White alone
447,022 7.6% Hispanic
345,678 5.9% Black alone
217,532 3.7% Two or more races
172,242 2.9% Asian alone
33,762 0.6% American Indian alone
19,680 0.3% Other race alone
2,592 0.04% Native Hawaiian and Other Pacific Islander alone
Income and house value in Howard Median household income in 2022 $74,387 White non-Hispanic householders
$115,623 Asian householders
$82,216 Hispanic or Latino race householders
Median 2022 house value $303,917 White Non-Hispanic householders
$202,136 Black or African American householders
$312,954 American Indian or Alaska Native householders
$441,607 Asian householders
$267,532 Two or more races householders
$207,367 Hispanic or Latino householders
Median age by race in Howard
42.7 Median age for White residents43.4 Males41.9 Females50.0 Median age for Black or African American residents48.9 Males54.2 Females45.7 Median age for American Indian / Alaska Native residents41.0 Males21.0 Females29.7 Median age for Asian residents25.8 Males33.6 Females-825,688,072.6 Median age for Native Hawaiian / Pacific Islander residents-862,745,097.2 Males-732,444,443.7 Females50.5 Median age for Other race residents54.5 Males-721,088,434.7 Females35.0 Median age for Two or more races residents32.9 Males47.1 Females42.8 Median age for White alone residents43.5 Males42.6 Females24.8 Median age for Hispanic or Latino residents44.0 Males24.3 Females
Owner/renter occupied households by race in Howard
House owners and renters - White residents 5,053 63.5% Owner occupied2,905 36.5% Renter occupiedHouse owners and renters - Black or African American residents 53 48.6% Owner occupied56 51.4% Renter occupiedHouse owners and renters - American Indian / Alaska Native residents 63 100.0% Owner occupiedHouse owners and renters - Asian residents 3 4.1% Owner occupied72 95.9% Renter occupiedHouse owners and renters - Other race residents 31 100.0% Owner occupiedHouse owners and renters - Two or more races residents 85 38.1% Owner occupied138 61.9% Renter occupiedHouse owners and renters - White alone residents 5,077 63.9% Owner occupied2,865 36.1% Renter occupiedHouse owners and renters - Hispanic or Latino residents 34 25.6% Owner occupied97 74.4% Renter occupied
Language usage in Howard
English speakers - Total 97.6% of residents of Howard speak English at home.
1.5% of residents speak Spanish at home 266 91.1% Speak English very well26 8.9% Speak English less than very well1.5% of residents speak other language at home 180 63.4% Speak English very well104 36.6% Speak English less than very well
English speakers - Born in the United States 99.1% of residents of Howard speak English at home.
0.9% of residents speak Spanish at home 35 100.0% Speak English very well0.2% of residents speak other language at home 9 100.0% Speak English very well
English speakers - Native, born elsewhere 55.0% of residents of Howard speak English at home.
23.9% of residents speak Spanish at home 15 28.3% Speak English very well38 71.7% Speak English less than very well
English speakers - Foreign-born 74.3% of residents of Howard speak English at home.
10.0% of residents speak Spanish at home 39 100.0% Speak English very well38.8% of residents speak other language at home 23 15.2% Speak English very well128 84.8% Speak English less than very well
White (Caucasian) - Speak only English Native:
98.7% (17,335)Foreign-born:
100.0% (135)
White (Caucasian) - Speak another language Native:
1.3% (227)Foreign-born:
19.5% (26)
Asian - Speak only English Native:
62.6% (102)Foreign-born:
14.0% (13)
Asian - Speak another language Native:
38.7% (63)Foreign-born:
82.4% (74)
Two or more races - Speak only English Native:
83.2% (341)Foreign-born:
100.0% (86)
Two or more races - Speak another language Native:
16.9% (69)Foreign-born:
38.8% (34)
White alone - Speak only English Native:
98.9% (17,318)Foreign-born:
80.7% (136)
White alone - Speak another language Native:
1.1% (186)Foreign-born:
22.2% (37)
Hispanic or Latino - Speak only English Native:
46.0% (138)Foreign-born:
80.8% (57)
Hispanic or Latino - Speak another language Native:
53.0% (159)Foreign-born:
49.8% (35)
Foreign-born residents in Howard 435 residents are foreign born (0.6% Europe , 0.6% Asia , 0.5% North America , 0.4% Latin America ).
This city:
2.2%Wisconsin:
5.0%
Marital status for residents in Howard Marital status - White (Caucasian) population 15 years and over
Males 26.3% Never married60.1% Now married0.3% Separated2.0% Widowed11.3% DivorcedFemales 29.5% Never married49.4% Now married1.1% Separated8.7% Widowed11.3% DivorcedWomen who gave birth in the past 12 months Now married:
86.6% (139)Unmarried:
13.4% (21)
Women who did not give birth in the past 12 months Now married:
42.4% (1,853)Unmarried:
57.6% (2,518)
Marital status - Black or African American population 15 years and over
Males 47.4% Never married39.4% Now married0.0% Separated0.0% Widowed13.1% DivorcedFemales 0.0% Never married91.8% Now married0.0% Separated8.2% Widowed0.0% DivorcedWomen who did not give birth in the past 12 months Now married:
100.0% (14)Unmarried:
0.0% (0)
Marital status - American Indian / Alaska Native population 15 years and over
Males 17.2% Never married60.9% Now married0.0% Separated0.0% Widowed21.9% DivorcedFemales 75.0% Never married0.0% Now married0.0% Separated0.0% Widowed25.0% DivorcedWomen who did not give birth in the past 12 months Now married:
0.0% (0)Unmarried:
100.0% (19)
Marital status - Asian population 15 years and over
Males 67.1% Never married32.9% Now married0.0% Separated0.0% Widowed0.0% DivorcedFemales 27.4% Never married44.1% Now married0.0% Separated0.0% Widowed28.5% DivorcedWomen who did not give birth in the past 12 months Now married:
34.2% (53)Unmarried:
65.8% (103)
Marital status - Other race population 15 years and over
Males 31.2% Never married68.8% Now married0.0% Separated0.0% Widowed0.0% DivorcedFemales 0.0% Never married100.0% Now married0.0% Separated0.0% Widowed0.0% DivorcedMarital status - Two or more races population 15 years and over
Males 56.1% Never married32.9% Now married0.0% Separated11.0% Widowed0.0% DivorcedFemales 31.9% Never married27.2% Now married0.0% Separated0.0% Widowed40.8% DivorcedWomen who did not give birth in the past 12 months Now married:
6.4% (10)Unmarried:
93.6% (152)
Marital status - White alone, not Hispanic / Latino population 15 years and over
Males 26.4% Never married60.0% Now married0.3% Separated2.0% Widowed11.3% DivorcedFemales 29.2% Never married49.6% Now married1.1% Separated8.8% Widowed11.4% DivorcedWomen who gave birth in the past 12 months Now married:
86.6% (140)Unmarried:
13.4% (22)
Women who did not give birth in the past 12 months Now married:
42.7% (1,868)Unmarried:
57.3% (2,506)
Marital status - Hispanic or Latino population 15 years and over
Males 38.2% Never married61.8% Now married0.0% Separated0.0% Widowed0.0% DivorcedFemales 52.1% Never married47.2% Now married0.6% Separated0.0% Widowed0.0% DivorcedWomen who did not give birth in the past 12 months Now married:
40.1% (63)Unmarried:
59.9% (95)
Ancestries in Howard
2,741 35.5% German
728 9.4% American
723 9.4% Polish
383 5.0% Irish
260 3.4% Belgian
251 3.2% Eastern European
239 3.1% Norwegian
228 3.0% Dutch
179 2.3% English
174 2.3% Finnish
165 2.1% European
116 1.5% Swedish
98 1.3% Italian
96 1.2% French
71 0.9% Ukrainian
51 0.7% Czech
45 0.6% Welsh
42 0.5% Scottish
38 0.5% Swiss
34 0.4% Canadian
32 0.4% Nigerian
31 0.4% Northern European
28 0.4% Danish
28 0.4% Lithuanian
25 0.3% Russian
23 0.3% Lebanese
21 0.3% French Canadian
17 0.2% Pennsylvania German
16 0.2% Luxembourger
16 0.2% Scandinavian
15 0.2% Czechoslovakian
4 0.05% British
Children Nativity (place of birth) in Howard
Children under 6 years - Living with two parents Both parents native 862 100.0% NativeBoth parents foreign-born 3 100.0% NativeChildren under 6 years - Living with one parent Native parent 124 100.0% Native
Children 6 to 17 years - Living with two parents Both parents native 2,518 99.5% Native13 0.5% Foreign-bornBoth parents foreign-born 2 100.0% NativeChildren 6 to 17 years - Living with one parent Native parent 745 100.0% Native
Grandparents responsible for own grandchildren in Howard
Grandparents (30 to 59 years) White / Caucasian 50 100.0% Not responsible for grandchildrenWhite alone, not Hispanic / Latino 57 100.0% Not responsible for grandchildrenGrandparents (60 years and over) White / Caucasian 93 53.4% Responsible for grandchildren81 46.6% Not responsible for grandchildrenWhite alone, not Hispanic / Latino 93 54.7% Responsible for grandchildren77 45.3% Not responsible for grandchildren