Races in Huber Heights, Ohio (OH) Detailed Stats
Data:
Races - White alone (%)
Races - White alone (% change since 2000)
Races - Black alone (%)
Races - Black alone (% change since 2000)
Races - American Indian alone (%)
Races - American Indian alone (% change since 2000)
Races - Asian alone (%)
Races - Asian alone (% change since 2000)
Races - Hispanic (%)
Races - Hispanic (% change since 2000)
Races - Native Hawaiian and Other Pacific Islander alone (%)
Races - Native Hawaiian and Other Pacific Islander alone (% change since 2000)
Races - Two or more races(%)
Races - Two or more races(% change since 2000)
Races - Other race alone (%)
Races - Other race alone (% change since 2000)
Racial diversity
Place of birth - Born in state of residence (%)
Place of birth - Born in state of residence (%) - White
Place of birth - Born in state of residence (%) - Black or African American
Place of birth - Born in state of residence (%) - Asian
Place of birth - Born in state of residence (%) - Hispanic or Latino
Place of birth - Born in state of residence (%) - American Indian and Alaska Native
Place of birth - Born in state of residence (%) - Multirace
Place of birth - Born in state of residence (%) - Other Race
Place of birth - Born in other state (%)
Place of birth - Born in other state (%) - White
Place of birth - Born in other state (%) - Black or African American
Place of birth - Born in other state (%) - Asian
Place of birth - Born in other state (%) - Hispanic or Latino
Place of birth - Born in other state (%) - American Indian and Alaska Native
Place of birth - Born in other state (%) - Multirace
Place of birth - Born in other state (%) - Other Race
Place of birth - Native, outside of US (%)
Place of birth - Native, outside of US (%) - White
Place of birth - Native, outside of US (%) - Black or African American
Place of birth - Native, outside of US (%) - Asian
Place of birth - Native, outside of US (%) - Hispanic or Latino
Place of birth - Native, outside of US (%) - American Indian and Alaska Native
Place of birth - Native, outside of US (%) - Multirace
Place of birth - Native, outside of US (%) - Other Race
Place of birth - Foreign born (%)
Place of birth - Foreign born (%) - White
Place of birth - Foreign born (%) - Black or African American
Place of birth - Foreign born (%) - Asian
Place of birth - Foreign born (%) - Hispanic or Latino
Place of birth - Foreign born (%) - American Indian and Alaska Native
Place of birth - Foreign born (%) - Multirace
Place of birth - Foreign born (%) - Other Race
Residents speaking English at home (%)
Residents speaking English at home - Born in the United States (%)
Residents speaking English at home - Native, born elsewhere (%)
Residents speaking English at home - Foreign born (%)
Residents speaking Spanish at home (%)
Residents speaking Spanish at home - Born in the United States (%)
Residents speaking Spanish at home - Native, born elsewhere (%)
Residents speaking Spanish at home - Foreign born (%)
Residents speaking other language at home (%)
Residents speaking other language at home - Born in the United States (%)
Residents speaking other language at home - Native, born elsewhere (%)
Residents speaking other language at home - Foreign born (%)
Marital status - Never married (%)
Marital status - Now married (%)
Marital status - Separated (%)
Marital status - Widowed (%)
Marital status - Divorced (%)
Ancestries Reported - Arab (%)
Ancestries Reported - Czech (%)
Ancestries Reported - Danish (%)
Ancestries Reported - Dutch (%)
Ancestries Reported - English (%)
Ancestries Reported - French (%)
Ancestries Reported - French Canadian (%)
Ancestries Reported - German (%)
Ancestries Reported - Greek (%)
Ancestries Reported - Hungarian (%)
Ancestries Reported - Irish (%)
Ancestries Reported - Italian (%)
Ancestries Reported - Lithuanian (%)
Ancestries Reported - Norwegian (%)
Ancestries Reported - Polish (%)
Ancestries Reported - Portuguese (%)
Ancestries Reported - Russian (%)
Ancestries Reported - Scotch-Irish (%)
Ancestries Reported - Scottish (%)
Ancestries Reported - Slovak (%)
Ancestries Reported - Subsaharan African (%)
Ancestries Reported - Swedish (%)
Ancestries Reported - Swiss (%)
Ancestries Reported - Ukrainian (%)
Ancestries Reported - United States (%)
Ancestries Reported - Welsh (%)
Ancestries Reported - West Indian (%)
Ancestries Reported - Other (%)
Geographical mobility - Same house 1 year ago (%)
Geographical mobility - Same house 1 year ago (%) - White
Geographical mobility - Same house 1 year ago (%) - Black or African American
Geographical mobility - Same house 1 year ago (%) - Asian
Geographical mobility - Same house 1 year ago (%) - Hispanic or Latino
Geographical mobility - Same house 1 year ago (%) - American Indian and Alaska Native
Geographical mobility - Same house 1 year ago (%) - Multirace
Geographical mobility - Same house 1 year ago (%) - Other Race
Geographical mobility - Moved within same county (%)
Geographical mobility - Moved within same county (%) - White
Geographical mobility - Moved within same county (%) - Black or African American
Geographical mobility - Moved within same county (%) - Asian
Geographical mobility - Moved within same county (%) - Hispanic or Latino
Geographical mobility - Moved within same county (%) - American Indian and Alaska Native
Geographical mobility - Moved within same county (%) - Multirace
Geographical mobility - Moved within same county (%) - Other Race
Geographical mobility - Moved from different county within same state (%)
Geographical mobility - Moved from different county within same state (%) - White
Geographical mobility - Moved from different county within same state (%) - Black or African American
Geographical mobility - Moved from different county within same state (%) - Asian
Geographical mobility - Moved from different county within same state (%) - Hispanic or Latino
Geographical mobility - Moved from different county within same state (%) - American Indian and Alaska Native
Geographical mobility - Moved from different county within same state (%) - Multirace
Geographical mobility - Moved from different county within same state (%) - Other Race
Geographical mobility - Moved from different state (%)
Geographical mobility - Moved from different state (%) - White
Geographical mobility - Moved from different state (%) - Black or African American
Geographical mobility - Moved from different state (%) - Asian
Geographical mobility - Moved from different state (%) - Hispanic or Latino
Geographical mobility - Moved from different state (%) - American Indian and Alaska Native
Geographical mobility - Moved from different state (%) - Multirace
Geographical mobility - Moved from different state (%) - Other Race
Geographical mobility - Moved from abroad (%)
Geographical mobility - Moved from abroad (%) - White
Geographical mobility - Moved from abroad (%) - Black or African American
Geographical mobility - Moved from abroad (%) - Asian
Geographical mobility - Moved from abroad (%) - Hispanic or Latino
Geographical mobility - Moved from abroad (%) - American Indian and Alaska Native
Geographical mobility - Moved from abroad (%) - Multirace
Geographical mobility - Moved from abroad (%) - Other Race
Place of birth for the foreign-born population - Ireland (%)
Place of birth for the foreign-born population - Denmark (%)
Place of birth for the foreign-born population - Norway (%)
Place of birth for the foreign-born population - Sweden (%)
Place of birth for the foreign-born population - United Kingdom (%)
Place of birth for the foreign-born population - England (%)
Place of birth for the foreign-born population - Scotland (%)
Place of birth for the foreign-born population - Other Northern Europe (%)
Place of birth for the foreign-born population - Austria (%)
Place of birth for the foreign-born population - Belgium (%)
Place of birth for the foreign-born population - France (%)
Place of birth for the foreign-born population - Germany (%)
Place of birth for the foreign-born population - Netherlands (%)
Place of birth for the foreign-born population - Switzerland (%)
Place of birth for the foreign-born population - Other Western Europe (%)
Place of birth for the foreign-born population - Greece (%)
Place of birth for the foreign-born population - Italy (%)
Place of birth for the foreign-born population - Portugal (%)
Place of birth for the foreign-born population - Spain (%)
Place of birth for the foreign-born population - Other Southern Europe (%)
Place of birth for the foreign-born population - Albania (%)
Place of birth for the foreign-born population - Belarus (%)
Place of birth for the foreign-born population - Bosnia and Herzegovina (%)
Place of birth for the foreign-born population - Bulgaria (%)
Place of birth for the foreign-born population - Croatia (%)
Place of birth for the foreign-born population - Czechoslovakia (%)
Place of birth for the foreign-born population - Hungary (%)
Place of birth for the foreign-born population - Latvia (%)
Place of birth for the foreign-born population - Lithuania (%)
Place of birth for the foreign-born population - North Macedonia (Macedonia) (%)
Place of birth for the foreign-born population - Moldova (%)
Place of birth for the foreign-born population - Poland (%)
Place of birth for the foreign-born population - Romania (%)
Place of birth for the foreign-born population - Russia (%)
Place of birth for the foreign-born population - Serbia (%)
Place of birth for the foreign-born population - Ukraine (%)
Place of birth for the foreign-born population - Other Eastern Europe (%)
Place of birth for the foreign-born population - China (%)
Place of birth for the foreign-born population - Hong Kong (%)
Place of birth for the foreign-born population - Taiwan (%)
Place of birth for the foreign-born population - Japan (%)
Place of birth for the foreign-born population - Korea (%)
Place of birth for the foreign-born population - Other Eastern Asia (%)
Place of birth for the foreign-born population - Afghanistan (%)
Place of birth for the foreign-born population - Bangladesh (%)
Place of birth for the foreign-born population - India (%)
Place of birth for the foreign-born population - Iran (%)
Place of birth for the foreign-born population - Kazakhstan (%)
Place of birth for the foreign-born population - Nepal (%)
Place of birth for the foreign-born population - Pakistan (%)
Place of birth for the foreign-born population - Sri Lanka (%)
Place of birth for the foreign-born population - Uzbekistan (%)
Place of birth for the foreign-born population - Other South Central Asia (%)
Place of birth for the foreign-born population - Burma (%)
Place of birth for the foreign-born population - Cambodia (%)
Place of birth for the foreign-born population - Indonesia (%)
Place of birth for the foreign-born population - Laos (%)
Place of birth for the foreign-born population - Malaysia (%)
Place of birth for the foreign-born population - Philippines (%)
Place of birth for the foreign-born population - Singapore (%)
Place of birth for the foreign-born population - Thailand (%)
Place of birth for the foreign-born population - Vietnam (%)
Place of birth for the foreign-born population - Other South Eastern Asia (%)
Place of birth for the foreign-born population - Armenia (%)
Place of birth for the foreign-born population - Iraq (%)
Place of birth for the foreign-born population - Israel (%)
Place of birth for the foreign-born population - Jordan (%)
Place of birth for the foreign-born population - Kuwait (%)
Place of birth for the foreign-born population - Lebanon (%)
Place of birth for the foreign-born population - Saudi Arabia (%)
Place of birth for the foreign-born population - Syria (%)
Place of birth for the foreign-born population - Turkey (%)
Place of birth for the foreign-born population - Yemen (%)
Place of birth for the foreign-born population - Other Western Asia (%)
Place of birth for the foreign-born population - Eritrea (%)
Place of birth for the foreign-born population - Ethiopia (%)
Place of birth for the foreign-born population - Kenya (%)
Place of birth for the foreign-born population - Somalia (%)
Place of birth for the foreign-born population - Uganda (%)
Place of birth for the foreign-born population - Zimbabwe (%)
Place of birth for the foreign-born population - Other Eastern Africa (%)
Place of birth for the foreign-born population - Cameroon (%)
Place of birth for the foreign-born population - Congo (%)
Place of birth for the foreign-born population - Democratic Republic of Congo (Zaire) (%)
Place of birth for the foreign-born population - Other Middle Africa (%)
Place of birth for the foreign-born population - Egypt (%)
Place of birth for the foreign-born population - Morocco (%)
Place of birth for the foreign-born population - Sudan (%)
Place of birth for the foreign-born population - Other Northern Africa (%)
Place of birth for the foreign-born population - South Africa (%)
Place of birth for the foreign-born population - Other Southern Africa (%)
Place of birth for the foreign-born population - Cabo Verde (%)
Place of birth for the foreign-born population - Ghana (%)
Place of birth for the foreign-born population - Liberia (%)
Place of birth for the foreign-born population - Nigeria (%)
Place of birth for the foreign-born population - Senegal (%)
Place of birth for the foreign-born population - Sierra Leone (%)
Place of birth for the foreign-born population - Other Western Africa (%)
Place of birth for the foreign-born population - Australia (%)
Place of birth for the foreign-born population - New Zealand (%)
Place of birth for the foreign-born population - Fiji (%)
Place of birth for the foreign-born population - Micronesia (%)
Place of birth for the foreign-born population - Bahamas (%)
Place of birth for the foreign-born population - Barbados (%)
Place of birth for the foreign-born population - Cuba (%)
Place of birth for the foreign-born population - Dominica (%)
Place of birth for the foreign-born population - Dominican Republic (%)
Place of birth for the foreign-born population - Grenada (%)
Place of birth for the foreign-born population - Haiti (%)
Place of birth for the foreign-born population - Jamaica (%)
Place of birth for the foreign-born population - St. Vincent and the Grenadines (%)
Place of birth for the foreign-born population - Trinidad and Tobago (%)
Place of birth for the foreign-born population - West Indies (%)
Place of birth for the foreign-born population - Other Caribbean (%)
Place of birth for the foreign-born population - Belize (%)
Place of birth for the foreign-born population - Costa Rica (%)
Place of birth for the foreign-born population - El Salvador (%)
Place of birth for the foreign-born population - Guatemala (%)
Place of birth for the foreign-born population - Honduras (%)
Place of birth for the foreign-born population - Mexico (%)
Place of birth for the foreign-born population - Nicaragua (%)
Place of birth for the foreign-born population - Panama (%)
Place of birth for the foreign-born population - Other Central America (%)
Place of birth for the foreign-born population - Argentina (%)
Place of birth for the foreign-born population - Bolivia (%)
Place of birth for the foreign-born population - Brazil (%)
Place of birth for the foreign-born population - Chile (%)
Place of birth for the foreign-born population - Colombia (%)
Place of birth for the foreign-born population - Ecuador (%)
Place of birth for the foreign-born population - Guyana (%)
Place of birth for the foreign-born population - Peru (%)
Place of birth for the foreign-born population - Uruguay (%)
Place of birth for the foreign-born population - Venezuela (%)
Place of birth for the foreign-born population - Other South America (%)
Place of birth for the foreign-born population - Canada (%)
Place of birth for the foreign-born population - Other Northern America (%)
Place of birth for the foreign-born population - Other (%)
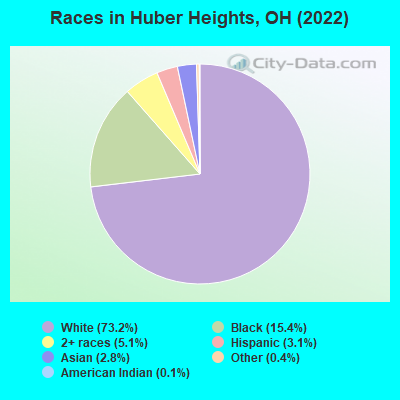
According to 2022 data, the most numerous races in Huber Heights, OH are White alone (31,402 residents), Black alone (6,617 residents), and Two or more races (2,187 residents). 88.8% of Huber Heights residents speak English at home. 7.5% of Huber Heights, OH residents are foreign-born (3.2% born in Asia, 2.7% born in Europe, 0.8% born in Africa), which is 47.0% greater than the foreign-born rate of 4.0% across the entire state of Ohio.
Race distribution in Huber Heights
2000 2022
9,538,111 84.0% White alone 1,290,662 11.4% Black alone 217,123 1.9% Hispanic 137,770 1.2% Two or more races 131,670 1.2% Asian alone 21,985 0.2% American Indian alone 13,483 0.1% Other race alone 2,336 0.02% Native Hawaiian and Other
8,948,793 76.1% White alone 1,401,403 11.9% Black alone 529,291 4.5% Two or more races 517,232 4.4% Hispanic 293,387 2.5% Asian alone 52,805 0.4% Other race alone 9,785 0.08% American Indian alone 3,362 0.03% Native Hawaiian and Other
Income and house value in Huber Heights Median household income in 2022 $77,265 White non-Hispanic householders$64,590 Black householders$57,754 Asian householders$80,059 Two or more races householders$93,852 Hispanic or Latino race householdersMedian 2022 house value $170,332 White Non-Hispanic householders$178,320 Black or African American householders$215,655 American Indian or Alaska Native householders $192,994 Asian householders$176,462 Native Hawaiian and other Pacific Islander householders$348,281 Some other race householders$174,233 Two or more races householders$260,050 Hispanic or Latino householders
Median age by race in Huber Heights
38.9 Median age for White residents38.6 39.2 32.7 Median age for Black or African American residents25.0 38.8 116.2 Median age for American Indian / Alaska Native residents59.2 -1,438,172,041.6 41.0 Median age for Asian residents39.3 42.3 -800,387,596.1 Median age for Native Hawaiian / Pacific Islander residents-750,242,953.6 -805,394,989.6 36.8 Median age for Other race residents36.2 40.4 18.9 Median age for Two or more races residents20.1 17.5 38.7 Median age for White alone residents38.6 38.8 32.3 Median age for Hispanic or Latino residents32.0 36.9
Owner/renter occupied households by race in Huber Heights
House owners and renters - White residents 10,776 78.0% Owner occupied3,045 22.0% Renter occupiedHouse owners and renters - Black or African American residents 1,241 49.3% Owner occupied1,275 50.7% Renter occupiedHouse owners and renters - American Indian / Alaska Native residents 3 100.0% Owner occupiedHouse owners and renters - Asian residents 405 81.1% Owner occupied94 18.9% Renter occupiedHouse owners and renters - Other race residents 46 44.0% Owner occupied58 56.0% Renter occupiedHouse owners and renters - Two or more races residents 397 75.3% Owner occupied131 24.7% Renter occupiedHouse owners and renters - White alone residents 10,608 78.0% Owner occupied3,000 22.0% Renter occupiedHouse owners and renters - Hispanic or Latino residents 409 77.8% Owner occupied116 22.2% Renter occupied
Language usage in Huber Heights
English speakers - Total 88.8% of residents of Huber Heights speak English at home.
2.5% of residents speak Spanish at home 823 84.0% Speak English very well157 16.0% Speak English less than very well9.1% of residents speak other language at home 2,557 70.1% Speak English very well1,089 29.9% Speak English less than very well
English speakers - Born in the United States 93.6% of residents of Huber Heights speak English at home.
1.7% of residents speak Spanish at home 149 89.2% Speak English very well18 10.8% Speak English less than very well5.3% of residents speak other language at home 476 89.1% Speak English very well58 10.9% Speak English less than very well
English speakers - Native, born elsewhere 79.2% of residents of Huber Heights speak English at home.
11.8% of residents speak Spanish at home 97 80.8% Speak English very well23 19.2% Speak English less than very well8.5% of residents speak other language at home 32 36.8% Speak English very well55 63.2% Speak English less than very well
English speakers - Foreign-born 13.8% of residents of Huber Heights speak English at home.
7.9% of residents speak Spanish at home 175 72.3% Speak English very well67 27.7% Speak English less than very well79.8% of residents speak other language at home 1,489 60.8% Speak English very well962 39.2% Speak English less than very well
White (Caucasian) - Speak only English Native:
96.1% (26,940)Foreign-born:
14.3% (241)
White (Caucasian) - Speak another language Native:
4.4% (1,220)Foreign-born:
85.9% (1,448)
Black or African American - Speak another language Native:
2.3% (137)Foreign-born:
74.0% (165)
Asian - Speak only English Native:
37.4% (93)Foreign-born:
4.9% (42)
Asian - Speak another language Native:
60.8% (151)Foreign-born:
98.0% (844)
Other race - Speak only English Native:
42.1% (88)Foreign-born:
38.2% (22)
Other race - Speak another language Native:
59.8% (125)Foreign-born:
61.9% (36)
Two or more races - Speak only English Native:
89.7% (2,091)Foreign-born:
40.7% (110)
Two or more races - Speak another language Native:
9.5% (221)Foreign-born:
49.0% (132)
White alone - Speak only English Native:
96.3% (26,770)Foreign-born:
13.9% (238)
White alone - Speak another language Native:
4.4% (1,211)Foreign-born:
89.6% (1,532)
Hispanic or Latino - Speak only English Native:
51.8% (507)Foreign-born:
21.3% (59)
Hispanic or Latino - Speak another language Native:
48.6% (476)Foreign-born:
80.3% (223)
Foreign-born residents in Huber Heights 3,240 residents are foreign born (3.2% Asia , 2.7% Europe , 0.8% Africa ).
Marital status for residents in Huber Heights Marital status - White (Caucasian) population 15 years and over
Males 29.2% Never married53.9% Now married1.3% Separated2.5% Widowed13.1% DivorcedFemales 22.8% Never married53.7% Now married0.7% Separated8.5% Widowed14.3% DivorcedWomen who gave birth in the past 12 months Now married:
57.0% (259)Unmarried:
43.0% (196)
Women who did not give birth in the past 12 months Now married:
52.1% (3,400)Unmarried:
47.9% (3,127)
Marital status - Black or African American population 15 years and over
Males 59.3% Never married27.6% Now married0.0% Separated1.9% Widowed11.1% DivorcedFemales 55.4% Never married18.7% Now married2.4% Separated5.0% Widowed18.6% DivorcedWomen who gave birth in the past 12 months Now married:
69.4% (43)Unmarried:
30.6% (19)
Women who did not give birth in the past 12 months Now married:
19.9% (383)Unmarried:
80.1% (1,545)
Marital status - American Indian / Alaska Native population 15 years and over
Males 24.5% Never married45.3% Now married24.5% Separated5.7% Widowed0.0% DivorcedFemales 100.0% Never married0.0% Now married0.0% Separated0.0% Widowed0.0% DivorcedWomen who did not give birth in the past 12 months Now married:
0.0% (0)Unmarried:
100.0% (10)
Marital status - Asian population 15 years and over
Males 36.5% Never married52.0% Now married0.0% Separated3.7% Widowed7.9% DivorcedFemales 21.9% Never married47.1% Now married0.0% Separated24.9% Widowed6.2% DivorcedWomen who gave birth in the past 12 months Now married:
100.0% (14)Unmarried:
0.0% (0)
Women who did not give birth in the past 12 months Now married:
48.6% (139)Unmarried:
51.4% (147)
Marital status - Other race population 15 years and over
Males 34.3% Never married65.7% Now married0.0% Separated0.0% Widowed0.0% DivorcedFemales 19.8% Never married67.0% Now married13.2% Separated0.0% Widowed0.0% DivorcedWomen who did not give birth in the past 12 months Now married:
74.3% (69)Unmarried:
25.7% (24)
Marital status - Two or more races population 15 years and over
Males 57.0% Never married38.5% Now married0.0% Separated1.0% Widowed3.5% DivorcedFemales 37.9% Never married36.5% Now married1.5% Separated0.0% Widowed24.1% DivorcedWomen who did not give birth in the past 12 months Now married:
25.4% (143)Unmarried:
74.6% (419)
Marital status - White alone, not Hispanic / Latino population 15 years and over
Males 29.2% Never married54.1% Now married1.0% Separated2.6% Widowed13.2% DivorcedFemales 22.7% Never married54.1% Now married0.7% Separated8.5% Widowed14.0% DivorcedWomen who gave birth in the past 12 months Now married:
60.0% (262)Unmarried:
40.0% (174)
Women who did not give birth in the past 12 months Now married:
52.7% (3,410)Unmarried:
47.3% (3,065)
Marital status - Hispanic or Latino population 15 years and over
Males 36.7% Never married49.0% Now married10.4% Separated0.0% Widowed3.9% DivorcedFemales 40.1% Never married38.2% Now married2.1% Separated4.5% Widowed15.1% DivorcedWomen who gave birth in the past 12 months Now married:
0.0% (0)Unmarried:
100.0% (26)
Women who did not give birth in the past 12 months Now married:
29.7% (114)Unmarried:
70.3% (269)
Ancestries in Huber Heights
3,235 15.9% German2,197 10.8% American2,180 10.7% English1,330 6.5% Turkish1,159 5.7% Irish623 3.1% European449 2.2% Scottish431 2.1% Italian355 1.7% Russian345 1.7% African139 0.7% Hungarian135 0.7% Palestinian119 0.6% French118 0.6% Scotch-Irish97 0.5% Lebanese92 0.5% Ethiopian82 0.4% Polish76 0.4% Greek62 0.3% British58 0.3% Iraqi40 0.2% Northern European39 0.2% Nigerian38 0.2% Slovak38 0.2% Welsh29 0.1% Haitian25 0.1% French Canadian24 0.1% Finnish24 0.1% Dutch20 0.10% Norwegian19 0.09% Danish18 0.09% Scandinavian18 0.09% Ukrainian17 0.08% Eastern European14 0.07% Jamaican13 0.06% Pennsylvania German11 0.05% Croatian11 0.05% Romanian10 0.05% Swedish9 0.04% Trinidadian and Tobagonian6 0.03% Czech4 0.02% Austrian4 0.02% Yugoslavian
Geographical mobility in Huber Heights Same house 1 year ago 28,213 89.8% White (Caucasian)5,183 77.7% Black or African American80 100.0% American Indian / Alaska Native1,052 89.9% Asian326 95.4% Other race2,548 89.9% Two or more races27,983 90.0% White alone, not Hispanic / Latino1,035 79.8% Hispanic or LatinoMoved within same county 949 3.0% White / Caucasian985 14.8% Black or African American29 2.4% Asian101 3.5% Two or more races900 2.9% White alone, not Hispanic / Latino72 5.6% Hispanic or LatinoMoved within same state 1,476 4.7% White / Caucasian382 5.7% Black or African American15 4.3% Other race89 3.2% Two or more races1,467 4.7% White alone, not Hispanic / Latino236 18.2% Hispanic or LatinoMoved from different state 864 2.8% White / Caucasian48 0.7% Black or African American24 2.1% Asian106 3.7% Two or more races853 2.7% White alone, not Hispanic / Latino39 3.0% Hispanic or LatinoMoved from abroad 238 0.8% White160 2.4% Black or African American252 0.8% White alone, not Hispanic / Latino
Children Nativity (place of birth) in Huber Heights
Children under 6 years - Living with two parents Both parents native 1,620 100.0% NativeBoth parents foreign-born 512 100.0% NativeOne native, one foreign-born parent 204 100.0% NativeChildren under 6 years - Living with one parent Native parent 1,033 100.0% NativeForeign-born parent 62 100.0% NativeChildren 6 to 17 years - Living with two parents Both parents native 4,075 99.9% Native3 0.1% Foreign-bornBoth parents foreign-born 582 76.7% Native177 23.3% Foreign-bornOne native, one foreign-born parent 350 100.0% NativeChildren 6 to 17 years - Living with one parent Native parent 2,000 100.0% Native
Grandparents responsible for own grandchildren in Huber Heights
Grandparents (30 to 59 years) White / Caucasian 129 28.5% Responsible for grandchildren324 71.5% Not responsible for grandchildrenBlack or African American 14 38.1% Responsible for grandchildren23 61.9% Not responsible for grandchildrenAmerican Indian / Alaska Native 26 100.0% Not responsible for grandchildrenTwo or more races 7 100.0% Not responsible for grandchildrenWhite alone, not Hispanic / Latino 130 29.7% Responsible for grandchildren307 70.3% Not responsible for grandchildrenHispanic or Latino 16 100.0% Not responsible for grandchildrenGrandparents (60 years and over) White / Caucasian 99 52.4% Responsible for grandchildren90 47.6% Not responsible for grandchildrenBlack or African American 17 8.9% Responsible for grandchildren172 91.1% Not responsible for grandchildrenWhite alone, not Hispanic / Latino 99 51.9% Responsible for grandchildren92 48.1% Not responsible for grandchildren