Races in Huntington, Virginia (VA) Detailed Stats
Data:
Races - White alone (%)
Races - White alone (% change since 2000)
Races - Black alone (%)
Races - Black alone (% change since 2000)
Races - American Indian alone (%)
Races - American Indian alone (% change since 2000)
Races - Asian alone (%)
Races - Asian alone (% change since 2000)
Races - Hispanic (%)
Races - Hispanic (% change since 2000)
Races - Native Hawaiian and Other Pacific Islander alone (%)
Races - Native Hawaiian and Other Pacific Islander alone (% change since 2000)
Races - Two or more races(%)
Races - Two or more races(% change since 2000)
Races - Other race alone (%)
Races - Other race alone (% change since 2000)
Racial diversity
Place of birth - Born in state of residence (%)
Place of birth - Born in state of residence (%) - White
Place of birth - Born in state of residence (%) - Black or African American
Place of birth - Born in state of residence (%) - Asian
Place of birth - Born in state of residence (%) - Hispanic or Latino
Place of birth - Born in state of residence (%) - American Indian and Alaska Native
Place of birth - Born in state of residence (%) - Multirace
Place of birth - Born in state of residence (%) - Other Race
Place of birth - Born in other state (%)
Place of birth - Born in other state (%) - White
Place of birth - Born in other state (%) - Black or African American
Place of birth - Born in other state (%) - Asian
Place of birth - Born in other state (%) - Hispanic or Latino
Place of birth - Born in other state (%) - American Indian and Alaska Native
Place of birth - Born in other state (%) - Multirace
Place of birth - Born in other state (%) - Other Race
Place of birth - Native, outside of US (%)
Place of birth - Native, outside of US (%) - White
Place of birth - Native, outside of US (%) - Black or African American
Place of birth - Native, outside of US (%) - Asian
Place of birth - Native, outside of US (%) - Hispanic or Latino
Place of birth - Native, outside of US (%) - American Indian and Alaska Native
Place of birth - Native, outside of US (%) - Multirace
Place of birth - Native, outside of US (%) - Other Race
Place of birth - Foreign born (%)
Place of birth - Foreign born (%) - White
Place of birth - Foreign born (%) - Black or African American
Place of birth - Foreign born (%) - Asian
Place of birth - Foreign born (%) - Hispanic or Latino
Place of birth - Foreign born (%) - American Indian and Alaska Native
Place of birth - Foreign born (%) - Multirace
Place of birth - Foreign born (%) - Other Race
Residents speaking English at home (%)
Residents speaking English at home - Born in the United States (%)
Residents speaking English at home - Native, born elsewhere (%)
Residents speaking English at home - Foreign born (%)
Residents speaking Spanish at home (%)
Residents speaking Spanish at home - Born in the United States (%)
Residents speaking Spanish at home - Native, born elsewhere (%)
Residents speaking Spanish at home - Foreign born (%)
Residents speaking other language at home (%)
Residents speaking other language at home - Born in the United States (%)
Residents speaking other language at home - Native, born elsewhere (%)
Residents speaking other language at home - Foreign born (%)
Marital status - Never married (%)
Marital status - Now married (%)
Marital status - Separated (%)
Marital status - Widowed (%)
Marital status - Divorced (%)
Ancestries Reported - Arab (%)
Ancestries Reported - Czech (%)
Ancestries Reported - Danish (%)
Ancestries Reported - Dutch (%)
Ancestries Reported - English (%)
Ancestries Reported - French (%)
Ancestries Reported - French Canadian (%)
Ancestries Reported - German (%)
Ancestries Reported - Greek (%)
Ancestries Reported - Hungarian (%)
Ancestries Reported - Irish (%)
Ancestries Reported - Italian (%)
Ancestries Reported - Lithuanian (%)
Ancestries Reported - Norwegian (%)
Ancestries Reported - Polish (%)
Ancestries Reported - Portuguese (%)
Ancestries Reported - Russian (%)
Ancestries Reported - Scotch-Irish (%)
Ancestries Reported - Scottish (%)
Ancestries Reported - Slovak (%)
Ancestries Reported - Subsaharan African (%)
Ancestries Reported - Swedish (%)
Ancestries Reported - Swiss (%)
Ancestries Reported - Ukrainian (%)
Ancestries Reported - United States (%)
Ancestries Reported - Welsh (%)
Ancestries Reported - West Indian (%)
Ancestries Reported - Other (%)
Geographical mobility - Same house 1 year ago (%)
Geographical mobility - Same house 1 year ago (%) - White
Geographical mobility - Same house 1 year ago (%) - Black or African American
Geographical mobility - Same house 1 year ago (%) - Asian
Geographical mobility - Same house 1 year ago (%) - Hispanic or Latino
Geographical mobility - Same house 1 year ago (%) - American Indian and Alaska Native
Geographical mobility - Same house 1 year ago (%) - Multirace
Geographical mobility - Same house 1 year ago (%) - Other Race
Geographical mobility - Moved within same county (%)
Geographical mobility - Moved within same county (%) - White
Geographical mobility - Moved within same county (%) - Black or African American
Geographical mobility - Moved within same county (%) - Asian
Geographical mobility - Moved within same county (%) - Hispanic or Latino
Geographical mobility - Moved within same county (%) - American Indian and Alaska Native
Geographical mobility - Moved within same county (%) - Multirace
Geographical mobility - Moved within same county (%) - Other Race
Geographical mobility - Moved from different county within same state (%)
Geographical mobility - Moved from different county within same state (%) - White
Geographical mobility - Moved from different county within same state (%) - Black or African American
Geographical mobility - Moved from different county within same state (%) - Asian
Geographical mobility - Moved from different county within same state (%) - Hispanic or Latino
Geographical mobility - Moved from different county within same state (%) - American Indian and Alaska Native
Geographical mobility - Moved from different county within same state (%) - Multirace
Geographical mobility - Moved from different county within same state (%) - Other Race
Geographical mobility - Moved from different state (%)
Geographical mobility - Moved from different state (%) - White
Geographical mobility - Moved from different state (%) - Black or African American
Geographical mobility - Moved from different state (%) - Asian
Geographical mobility - Moved from different state (%) - Hispanic or Latino
Geographical mobility - Moved from different state (%) - American Indian and Alaska Native
Geographical mobility - Moved from different state (%) - Multirace
Geographical mobility - Moved from different state (%) - Other Race
Geographical mobility - Moved from abroad (%)
Geographical mobility - Moved from abroad (%) - White
Geographical mobility - Moved from abroad (%) - Black or African American
Geographical mobility - Moved from abroad (%) - Asian
Geographical mobility - Moved from abroad (%) - Hispanic or Latino
Geographical mobility - Moved from abroad (%) - American Indian and Alaska Native
Geographical mobility - Moved from abroad (%) - Multirace
Geographical mobility - Moved from abroad (%) - Other Race
Place of birth for the foreign-born population - Ireland (%)
Place of birth for the foreign-born population - Denmark (%)
Place of birth for the foreign-born population - Norway (%)
Place of birth for the foreign-born population - Sweden (%)
Place of birth for the foreign-born population - United Kingdom (%)
Place of birth for the foreign-born population - England (%)
Place of birth for the foreign-born population - Scotland (%)
Place of birth for the foreign-born population - Other Northern Europe (%)
Place of birth for the foreign-born population - Austria (%)
Place of birth for the foreign-born population - Belgium (%)
Place of birth for the foreign-born population - France (%)
Place of birth for the foreign-born population - Germany (%)
Place of birth for the foreign-born population - Netherlands (%)
Place of birth for the foreign-born population - Switzerland (%)
Place of birth for the foreign-born population - Other Western Europe (%)
Place of birth for the foreign-born population - Greece (%)
Place of birth for the foreign-born population - Italy (%)
Place of birth for the foreign-born population - Portugal (%)
Place of birth for the foreign-born population - Spain (%)
Place of birth for the foreign-born population - Other Southern Europe (%)
Place of birth for the foreign-born population - Albania (%)
Place of birth for the foreign-born population - Belarus (%)
Place of birth for the foreign-born population - Bosnia and Herzegovina (%)
Place of birth for the foreign-born population - Bulgaria (%)
Place of birth for the foreign-born population - Croatia (%)
Place of birth for the foreign-born population - Czechoslovakia (%)
Place of birth for the foreign-born population - Hungary (%)
Place of birth for the foreign-born population - Latvia (%)
Place of birth for the foreign-born population - Lithuania (%)
Place of birth for the foreign-born population - North Macedonia (Macedonia) (%)
Place of birth for the foreign-born population - Moldova (%)
Place of birth for the foreign-born population - Poland (%)
Place of birth for the foreign-born population - Romania (%)
Place of birth for the foreign-born population - Russia (%)
Place of birth for the foreign-born population - Serbia (%)
Place of birth for the foreign-born population - Ukraine (%)
Place of birth for the foreign-born population - Other Eastern Europe (%)
Place of birth for the foreign-born population - China (%)
Place of birth for the foreign-born population - Hong Kong (%)
Place of birth for the foreign-born population - Taiwan (%)
Place of birth for the foreign-born population - Japan (%)
Place of birth for the foreign-born population - Korea (%)
Place of birth for the foreign-born population - Other Eastern Asia (%)
Place of birth for the foreign-born population - Afghanistan (%)
Place of birth for the foreign-born population - Bangladesh (%)
Place of birth for the foreign-born population - India (%)
Place of birth for the foreign-born population - Iran (%)
Place of birth for the foreign-born population - Kazakhstan (%)
Place of birth for the foreign-born population - Nepal (%)
Place of birth for the foreign-born population - Pakistan (%)
Place of birth for the foreign-born population - Sri Lanka (%)
Place of birth for the foreign-born population - Uzbekistan (%)
Place of birth for the foreign-born population - Other South Central Asia (%)
Place of birth for the foreign-born population - Burma (%)
Place of birth for the foreign-born population - Cambodia (%)
Place of birth for the foreign-born population - Indonesia (%)
Place of birth for the foreign-born population - Laos (%)
Place of birth for the foreign-born population - Malaysia (%)
Place of birth for the foreign-born population - Philippines (%)
Place of birth for the foreign-born population - Singapore (%)
Place of birth for the foreign-born population - Thailand (%)
Place of birth for the foreign-born population - Vietnam (%)
Place of birth for the foreign-born population - Other South Eastern Asia (%)
Place of birth for the foreign-born population - Armenia (%)
Place of birth for the foreign-born population - Iraq (%)
Place of birth for the foreign-born population - Israel (%)
Place of birth for the foreign-born population - Jordan (%)
Place of birth for the foreign-born population - Kuwait (%)
Place of birth for the foreign-born population - Lebanon (%)
Place of birth for the foreign-born population - Saudi Arabia (%)
Place of birth for the foreign-born population - Syria (%)
Place of birth for the foreign-born population - Turkey (%)
Place of birth for the foreign-born population - Yemen (%)
Place of birth for the foreign-born population - Other Western Asia (%)
Place of birth for the foreign-born population - Eritrea (%)
Place of birth for the foreign-born population - Ethiopia (%)
Place of birth for the foreign-born population - Kenya (%)
Place of birth for the foreign-born population - Somalia (%)
Place of birth for the foreign-born population - Uganda (%)
Place of birth for the foreign-born population - Zimbabwe (%)
Place of birth for the foreign-born population - Other Eastern Africa (%)
Place of birth for the foreign-born population - Cameroon (%)
Place of birth for the foreign-born population - Congo (%)
Place of birth for the foreign-born population - Democratic Republic of Congo (Zaire) (%)
Place of birth for the foreign-born population - Other Middle Africa (%)
Place of birth for the foreign-born population - Egypt (%)
Place of birth for the foreign-born population - Morocco (%)
Place of birth for the foreign-born population - Sudan (%)
Place of birth for the foreign-born population - Other Northern Africa (%)
Place of birth for the foreign-born population - South Africa (%)
Place of birth for the foreign-born population - Other Southern Africa (%)
Place of birth for the foreign-born population - Cabo Verde (%)
Place of birth for the foreign-born population - Ghana (%)
Place of birth for the foreign-born population - Liberia (%)
Place of birth for the foreign-born population - Nigeria (%)
Place of birth for the foreign-born population - Senegal (%)
Place of birth for the foreign-born population - Sierra Leone (%)
Place of birth for the foreign-born population - Other Western Africa (%)
Place of birth for the foreign-born population - Australia (%)
Place of birth for the foreign-born population - New Zealand (%)
Place of birth for the foreign-born population - Fiji (%)
Place of birth for the foreign-born population - Micronesia (%)
Place of birth for the foreign-born population - Bahamas (%)
Place of birth for the foreign-born population - Barbados (%)
Place of birth for the foreign-born population - Cuba (%)
Place of birth for the foreign-born population - Dominica (%)
Place of birth for the foreign-born population - Dominican Republic (%)
Place of birth for the foreign-born population - Grenada (%)
Place of birth for the foreign-born population - Haiti (%)
Place of birth for the foreign-born population - Jamaica (%)
Place of birth for the foreign-born population - St. Vincent and the Grenadines (%)
Place of birth for the foreign-born population - Trinidad and Tobago (%)
Place of birth for the foreign-born population - West Indies (%)
Place of birth for the foreign-born population - Other Caribbean (%)
Place of birth for the foreign-born population - Belize (%)
Place of birth for the foreign-born population - Costa Rica (%)
Place of birth for the foreign-born population - El Salvador (%)
Place of birth for the foreign-born population - Guatemala (%)
Place of birth for the foreign-born population - Honduras (%)
Place of birth for the foreign-born population - Mexico (%)
Place of birth for the foreign-born population - Nicaragua (%)
Place of birth for the foreign-born population - Panama (%)
Place of birth for the foreign-born population - Other Central America (%)
Place of birth for the foreign-born population - Argentina (%)
Place of birth for the foreign-born population - Bolivia (%)
Place of birth for the foreign-born population - Brazil (%)
Place of birth for the foreign-born population - Chile (%)
Place of birth for the foreign-born population - Colombia (%)
Place of birth for the foreign-born population - Ecuador (%)
Place of birth for the foreign-born population - Guyana (%)
Place of birth for the foreign-born population - Peru (%)
Place of birth for the foreign-born population - Uruguay (%)
Place of birth for the foreign-born population - Venezuela (%)
Place of birth for the foreign-born population - Other South America (%)
Place of birth for the foreign-born population - Canada (%)
Place of birth for the foreign-born population - Other Northern America (%)
Place of birth for the foreign-born population - Other (%)
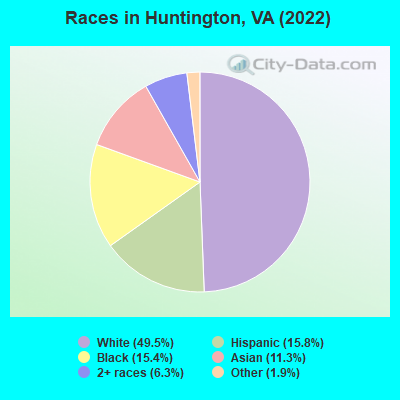
According to 2022 data, the most numerous races in Huntington, VA are White alone (6,849 residents), Black alone (2,134 residents), and Hispanic (2,191 residents). 70.5% of Huntington residents speak English at home. 24.3% of Huntington, VA residents are foreign-born (9.0% born in Latin America, 7.9% born in Asia, 3.5% born in Europe, 3.2% born in Africa), which is 50.6% greater than the foreign-born rate of 12.0% across the entire state of Virginia.
Race distribution in Huntington
2000 2022
4,965,637 70.2% White alone 1,376,378 19.4% Black alone 329,540 4.7% Hispanic 259,277 3.7% Asian alone 114,022 1.6% Two or more races 18,596 0.3% American Indian alone 11,685 0.2% Other race alone 3,380 0.05% Native Hawaiian and Other
5,095,130 58.7% White alone 1,594,785 18.4% Black alone 905,750 10.4% Hispanic 602,881 6.9% Asian alone 406,047 4.7% Two or more races 60,419 0.7% Other race alone 11,738 0.1% American Indian alone 6,869 0.08% Native Hawaiian and Other
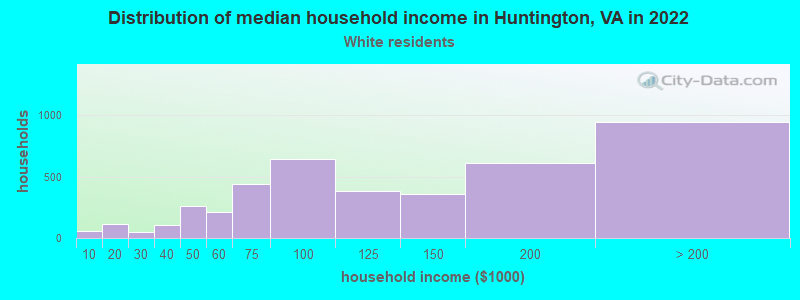
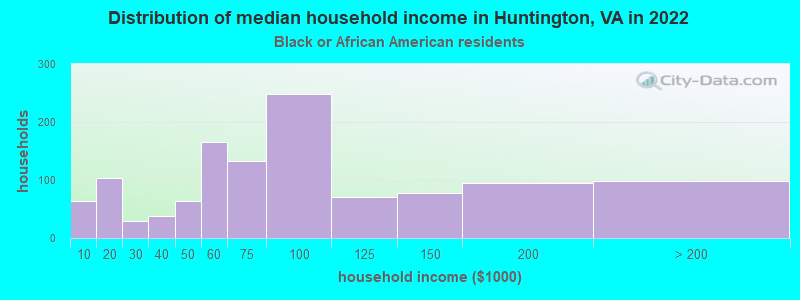
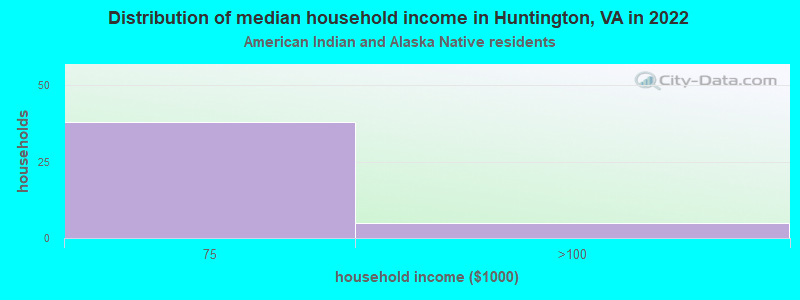
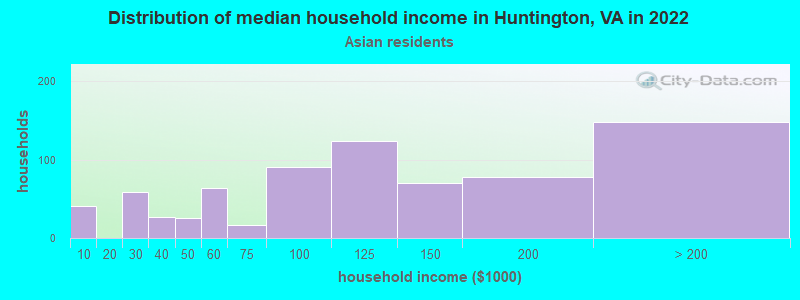
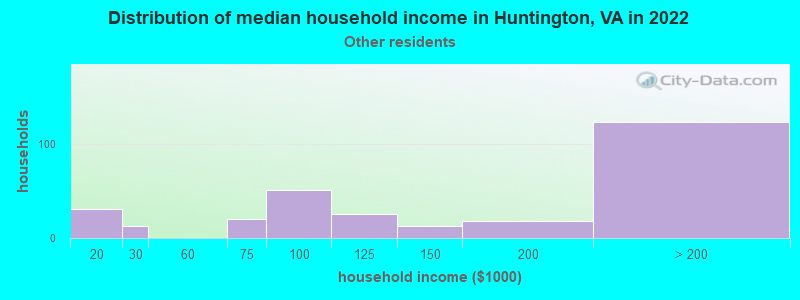
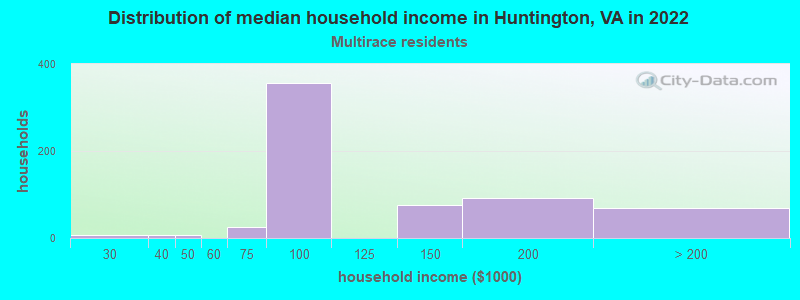
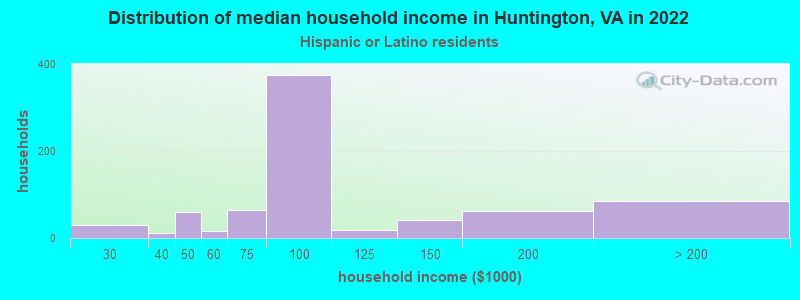
Income and house value in Huntington Median household income in 2022 $116,660 White non-Hispanic householders$72,661 Black householders$102,264 Asian householders$105,666 Some other race householders$96,834 Two or more races householders$86,251 Hispanic or Latino race householdersMedian 2022 house value $480,690 White Non-Hispanic householders$435,055 Black or African American householders$713,049 American Indian or Alaska Native householders $544,960 Asian householders$855,659 Native Hawaiian and other Pacific Islander householders$505,409 Some other race householders$713,049 Two or more races householders$495,522 Hispanic or Latino householders
Median age by race in Huntington
38.6 Median age for White residents38.7 38.5 37.4 Median age for Black or African American residents35.4 38.2 3.3 Median age for American Indian / Alaska Native residents3.8 21.8 37.4 Median age for Asian residents36.4 39.7 -666,666,666.0 Median age for Native Hawaiian / Pacific Islander residents-558,791,801.0 -584,518,166.9 30.9 Median age for Other race residents29.5 36.0 33.4 Median age for Two or more races residents37.8 28.9 38.0 Median age for White alone residents38.0 37.7 33.0 Median age for Hispanic or Latino residents31.0 37.6
Owner/renter occupied households by race in Huntington
House owners and renters - White residents 2,201 52.7% Owner occupied1,974 47.3% Renter occupiedHouse owners and renters - Black or African American residents 142 10.9% Owner occupied1,159 89.1% Renter occupiedHouse owners and renters - American Indian / Alaska Native residents 5 13.4% Owner occupied34 86.6% Renter occupiedHouse owners and renters - Asian residents 272 35.6% Owner occupied493 64.4% Renter occupiedHouse owners and renters - Other race residents 153 51.4% Owner occupied145 48.6% Renter occupiedHouse owners and renters - Two or more races residents 258 38.7% Owner occupied409 61.3% Renter occupiedHouse owners and renters - White alone residents 2,222 52.8% Owner occupied1,987 47.2% Renter occupiedHouse owners and renters - Hispanic or Latino residents 293 37.4% Owner occupied490 62.6% Renter occupied
Language usage in Huntington
English speakers - Total 70.5% of residents of Huntington speak English at home.
14.5% of residents speak Spanish at home 945 50.2% Speak English very well938 49.8% Speak English less than very well15.2% of residents speak other language at home 1,398 71.0% Speak English very well570 29.0% Speak English less than very well
English speakers - Born in the United States 92.8% of residents of Huntington speak English at home.
5.0% of residents speak Spanish at home 282 81.5% Speak English very well64 18.5% Speak English less than very well2.3% of residents speak other language at home 132 82.0% Speak English very well29 18.0% Speak English less than very well
English speakers - Native, born elsewhere 60.7% of residents of Huntington speak English at home.
35.4% of residents speak Spanish at home 94 87.0% Speak English very well14 13.0% Speak English less than very well1.3% of residents speak other language at home 4 100.0% Speak English very well
English speakers - Foreign-born 22.0% of residents of Huntington speak English at home.
31.5% of residents speak Spanish at home 214 20.2% Speak English very well847 79.8% Speak English less than very well47.9% of residents speak other language at home 1,064 66.0% Speak English very well547 34.0% Speak English less than very well
White (Caucasian) - Speak only English Native:
95.1% (5,653)Foreign-born:
49.7% (299)
White (Caucasian) - Speak another language Native:
5.3% (317)Foreign-born:
59.0% (355)
Black or African American - Speak only English Native:
85.9% (1,441)Foreign-born:
19.4% (92)
Black or African American - Speak another language Native:
14.6% (246)Foreign-born:
79.5% (379)
American Indian / Alaska Native - Speak another language Native:
6.7% (3)Foreign-born:
100.0% (151)
Asian - Speak only English Native:
60.9% (220)Foreign-born:
23.2% (256)
Asian - Speak another language Native:
38.1% (138)Foreign-born:
78.2% (862)
Other race - Speak only English Native:
67.4% (431)Foreign-born:
4.1% (18)
Other race - Speak another language Native:
39.9% (255)Foreign-born:
95.0% (427)
Two or more races - Speak only English Native:
70.7% (641)Foreign-born:
5.4% (39)
Two or more races - Speak another language Native:
29.5% (268)Foreign-born:
94.7% (690)
White alone - Speak only English Native:
95.2% (5,624)Foreign-born:
50.5% (321)
White alone - Speak another language Native:
4.9% (288)Foreign-born:
52.7% (335)
Hispanic or Latino - Speak only English Native:
30.9% (273)Foreign-born:
1.4% (15)
Hispanic or Latino - Speak another language Native:
66.2% (584)Foreign-born:
98.5% (1,057)
Foreign-born residents in Huntington 3,361 residents are foreign born (9.0% Latin America , 7.9% Asia , 3.5% Europe , 3.2% Africa ).
This city:
24.3%Virginia:
12.6%
Marital status for residents in Huntington Marital status - White (Caucasian) population 15 years and over
Males 46.2% Never married41.2% Now married0.9% Separated1.5% Widowed10.2% DivorcedFemales 35.9% Never married43.3% Now married0.6% Separated4.7% Widowed15.5% DivorcedWomen who gave birth in the past 12 months Now married:
86.1% (83)Unmarried:
13.9% (13)
Women who did not give birth in the past 12 months Now married:
44.5% (754)Unmarried:
55.5% (941)
Marital status - Black or African American population 15 years and over
Males 49.7% Never married45.4% Now married0.0% Separated0.9% Widowed4.0% DivorcedFemales 58.0% Never married26.4% Now married2.0% Separated2.3% Widowed11.3% DivorcedWomen who gave birth in the past 12 months Now married:
100.0% (30)Unmarried:
0.0% (0)
Women who did not give birth in the past 12 months Now married:
24.3% (188)Unmarried:
75.7% (584)
Marital status - American Indian / Alaska Native population 15 years and over
Males 100.0% Never married0.0% Now married0.0% Separated0.0% Widowed0.0% DivorcedFemales 44.6% Never married0.0% Now married0.0% Separated0.0% Widowed55.4% DivorcedWomen who did not give birth in the past 12 months Now married:
0.0% (0)Unmarried:
100.0% (56)
Marital status - Asian population 15 years and over
Males 28.4% Never married58.8% Now married0.0% Separated2.4% Widowed10.4% DivorcedFemales 19.9% Never married57.8% Now married0.0% Separated13.4% Widowed9.0% DivorcedWomen who gave birth in the past 12 months Now married:
100.0% (40)Unmarried:
0.0% (0)
Women who did not give birth in the past 12 months Now married:
73.0% (273)Unmarried:
27.0% (101)
Marital status - Other race population 15 years and over
Males 76.8% Never married23.2% Now married0.0% Separated0.0% Widowed0.0% DivorcedFemales 64.1% Never married28.7% Now married0.8% Separated3.1% Widowed3.3% DivorcedWomen who did not give birth in the past 12 months Now married:
23.4% (91)Unmarried:
76.6% (297)
Marital status - Two or more races population 15 years and over
Males 34.9% Never married47.1% Now married15.7% Separated0.0% Widowed2.3% DivorcedFemales 41.2% Never married46.7% Now married0.0% Separated0.0% Widowed12.2% DivorcedWomen who gave birth in the past 12 months Now married:
100.0% (35)Unmarried:
0.0% (0)
Women who did not give birth in the past 12 months Now married:
44.3% (233)Unmarried:
55.7% (293)
Marital status - White alone, not Hispanic / Latino population 15 years and over
Males 47.0% Never married40.0% Now married1.0% Separated1.6% Widowed10.4% DivorcedFemales 34.2% Never married43.7% Now married0.6% Separated5.0% Widowed16.5% DivorcedWomen who gave birth in the past 12 months Now married:
86.1% (90)Unmarried:
13.9% (15)
Women who did not give birth in the past 12 months Now married:
46.2% (769)Unmarried:
53.8% (896)
Marital status - Hispanic or Latino population 15 years and over
Males 53.5% Never married38.1% Now married6.9% Separated0.0% Widowed1.5% DivorcedFemales 50.1% Never married39.6% Now married0.4% Separated1.5% Widowed8.4% DivorcedWomen who did not give birth in the past 12 months Now married:
32.4% (201)Unmarried:
67.6% (419)
Ancestries in Huntington
432 6.1% English359 5.1% Irish341 4.8% American275 3.9% Italian240 3.4% German119 1.7% Afghan114 1.6% Polish112 1.6% European102 1.4% Ethiopian78 1.1% Egyptian69 1.0% African65 0.9% Russian55 0.8% Scottish55 0.8% Greek48 0.7% Scotch-Irish42 0.6% Eastern European40 0.6% Ukrainian38 0.5% West Indian36 0.5% Swedish36 0.5% Jamaican35 0.5% Albanian33 0.5% Norwegian28 0.4% Austrian26 0.4% Brazilian23 0.3% French21 0.3% French Canadian18 0.3% Iranian16 0.2% Hungarian15 0.2% Danish15 0.2% Kenyan14 0.2% Bulgarian14 0.2% Arab11 0.2% Scandinavian11 0.2% Czech8 0.1% Swiss7 0.10% Latvian7 0.10% Canadian7 0.10% British West Indian6 0.08% Dutch6 0.08% British5 0.07% Northern European3 0.04% Welsh2 0.03% Moroccan1 0.01% Portuguese
Geographical mobility in Huntington Same house 1 year ago 5,148 76.7% White (Caucasian)1,526 69.3% Black or African American326 96.1% American Indian / Alaska Native1,027 65.8% Asian918 83.9% Other race1,562 83.3% Two or more races5,125 75.8% White alone, not Hispanic / Latino1,793 82.0% Hispanic or LatinoMoved within same county 493 7.3% White / Caucasian114 5.2% Black or African American72 4.6% Asian13 1.2% Other race23 1.2% Two or more races538 8.0% White alone, not Hispanic / Latino27 1.2% Hispanic or LatinoMoved within same state 535 8.0% White / Caucasian136 6.2% Black or African American207 13.2% Asian21 1.9% Other race119 6.3% Two or more races528 7.8% White alone, not Hispanic / Latino107 4.9% Hispanic or LatinoMoved from different state 583 8.7% White / Caucasian577 26.2% Black or African American225 14.4% Asian27 2.4% Other race102 5.4% Two or more races614 9.1% White alone, not Hispanic / Latino136 6.2% Hispanic or LatinoMoved from abroad 11 0.2% White130 11.9% Other race31 1.6% Two or more races12 0.2% White alone, not Hispanic / Latino132 6.0% Hispanic or Latino
Children Nativity (place of birth) in Huntington
Children under 6 years - Living with two parents Both parents native 216 100.0% NativeBoth parents foreign-born 154 89.9% Native17 10.1% Foreign-bornOne native, one foreign-born parent 162 100.0% NativeChildren under 6 years - Living with one parent Native parent 179 97.9% Native4 2.1% Foreign-bornForeign-born parent 158 100.0% NativeChildren 6 to 17 years - Living with two parents Both parents native 197 100.0% NativeBoth parents foreign-born 216 80.1% Native54 19.9% Foreign-bornOne native, one foreign-born parent 57 100.0% NativeChildren 6 to 17 years - Living with one parent Native parent 205 100.0% NativeForeign-born parent 243 54.6% Native202 45.4% Foreign-born
Grandparents responsible for own grandchildren in Huntington
Grandparents (30 to 59 years) American Indian / Alaska Native 22 100.0% Responsible for grandchildrenOther race 4 100.0% Not responsible for grandchildrenTwo or more races 27 54.1% Responsible for grandchildren23 45.9% Not responsible for grandchildrenHispanic or Latino 30 65.7% Responsible for grandchildren16 34.3% Not responsible for grandchildren
Grandparents (60 years and over) Other race 19 100.0% Not responsible for grandchildrenHispanic or Latino 17 100.0% Not responsible for grandchildren