Races in Jeffersonville, Indiana (IN) Detailed Stats
Data:
Races - White alone (%)
Races - White alone (% change since 2000)
Races - Black alone (%)
Races - Black alone (% change since 2000)
Races - American Indian alone (%)
Races - American Indian alone (% change since 2000)
Races - Asian alone (%)
Races - Asian alone (% change since 2000)
Races - Hispanic (%)
Races - Hispanic (% change since 2000)
Races - Native Hawaiian and Other Pacific Islander alone (%)
Races - Native Hawaiian and Other Pacific Islander alone (% change since 2000)
Races - Two or more races(%)
Races - Two or more races(% change since 2000)
Races - Other race alone (%)
Races - Other race alone (% change since 2000)
Racial diversity
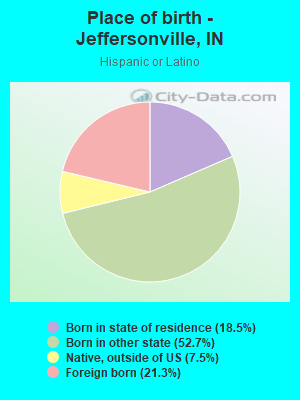
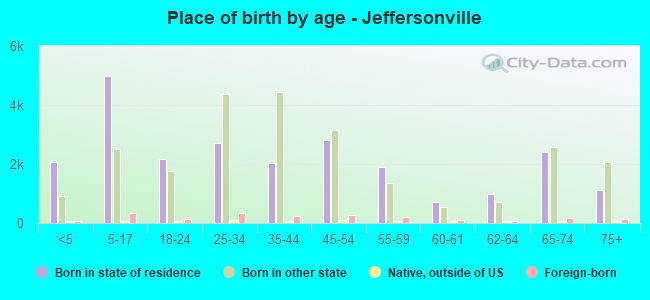
Place of birth - Born in state of residence (%)
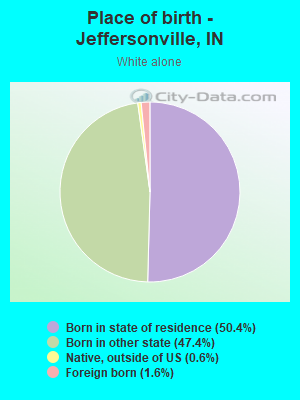
Place of birth - Born in state of residence (%) - White
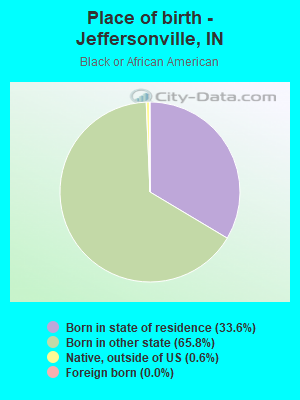
Place of birth - Born in state of residence (%) - Black or African American
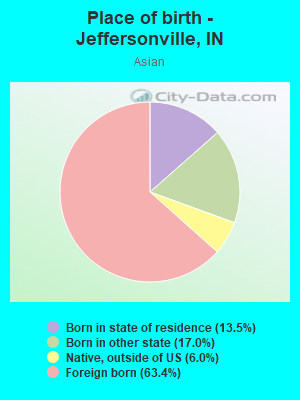
Place of birth - Born in state of residence (%) - Asian
Place of birth - Born in state of residence (%) - Hispanic or Latino
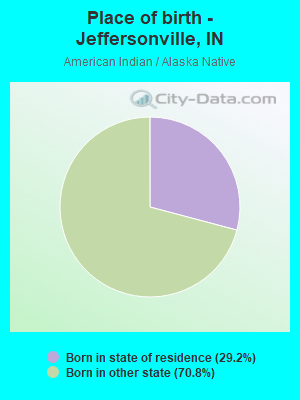
Place of birth - Born in state of residence (%) - American Indian and Alaska Native
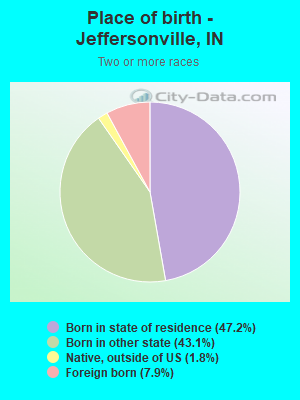
Place of birth - Born in state of residence (%) - Multirace
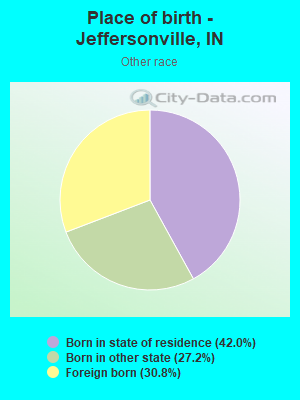
Place of birth - Born in state of residence (%) - Other Race
Place of birth - Born in other state (%)
Place of birth - Born in other state (%) - White
Place of birth - Born in other state (%) - Black or African American
Place of birth - Born in other state (%) - Asian
Place of birth - Born in other state (%) - Hispanic or Latino
Place of birth - Born in other state (%) - American Indian and Alaska Native
Place of birth - Born in other state (%) - Multirace
Place of birth - Born in other state (%) - Other Race
Place of birth - Native, outside of US (%)
Place of birth - Native, outside of US (%) - White
Place of birth - Native, outside of US (%) - Black or African American
Place of birth - Native, outside of US (%) - Asian
Place of birth - Native, outside of US (%) - Hispanic or Latino
Place of birth - Native, outside of US (%) - American Indian and Alaska Native
Place of birth - Native, outside of US (%) - Multirace
Place of birth - Native, outside of US (%) - Other Race
Place of birth - Foreign born (%)
Place of birth - Foreign born (%) - White
Place of birth - Foreign born (%) - Black or African American
Place of birth - Foreign born (%) - Asian
Place of birth - Foreign born (%) - Hispanic or Latino
Place of birth - Foreign born (%) - American Indian and Alaska Native
Place of birth - Foreign born (%) - Multirace
Place of birth - Foreign born (%) - Other Race
Residents speaking English at home (%)
Residents speaking English at home - Born in the United States (%)
Residents speaking English at home - Native, born elsewhere (%)
Residents speaking English at home - Foreign born (%)
Residents speaking Spanish at home (%)
Residents speaking Spanish at home - Born in the United States (%)
Residents speaking Spanish at home - Native, born elsewhere (%)
Residents speaking Spanish at home - Foreign born (%)
Residents speaking other language at home (%)
Residents speaking other language at home - Born in the United States (%)
Residents speaking other language at home - Native, born elsewhere (%)
Residents speaking other language at home - Foreign born (%)
Marital status - Never married (%)
Marital status - Now married (%)
Marital status - Separated (%)
Marital status - Widowed (%)
Marital status - Divorced (%)
Ancestries Reported - Arab (%)
Ancestries Reported - Czech (%)
Ancestries Reported - Danish (%)
Ancestries Reported - Dutch (%)
Ancestries Reported - English (%)
Ancestries Reported - French (%)
Ancestries Reported - French Canadian (%)
Ancestries Reported - German (%)
Ancestries Reported - Greek (%)
Ancestries Reported - Hungarian (%)
Ancestries Reported - Irish (%)
Ancestries Reported - Italian (%)
Ancestries Reported - Lithuanian (%)
Ancestries Reported - Norwegian (%)
Ancestries Reported - Polish (%)
Ancestries Reported - Portuguese (%)
Ancestries Reported - Russian (%)
Ancestries Reported - Scotch-Irish (%)
Ancestries Reported - Scottish (%)
Ancestries Reported - Slovak (%)
Ancestries Reported - Subsaharan African (%)
Ancestries Reported - Swedish (%)
Ancestries Reported - Swiss (%)
Ancestries Reported - Ukrainian (%)
Ancestries Reported - United States (%)
Ancestries Reported - Welsh (%)
Ancestries Reported - West Indian (%)
Ancestries Reported - Other (%)
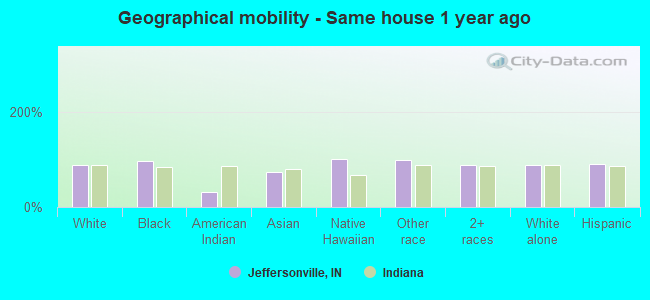
Geographical mobility - Same house 1 year ago (%)
Geographical mobility - Same house 1 year ago (%) - White
Geographical mobility - Same house 1 year ago (%) - Black or African American
Geographical mobility - Same house 1 year ago (%) - Asian
Geographical mobility - Same house 1 year ago (%) - Hispanic or Latino
Geographical mobility - Same house 1 year ago (%) - American Indian and Alaska Native
Geographical mobility - Same house 1 year ago (%) - Multirace
Geographical mobility - Same house 1 year ago (%) - Other Race
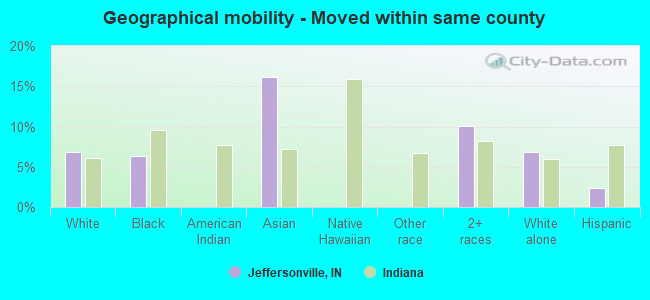
Geographical mobility - Moved within same county (%)
Geographical mobility - Moved within same county (%) - White
Geographical mobility - Moved within same county (%) - Black or African American
Geographical mobility - Moved within same county (%) - Asian
Geographical mobility - Moved within same county (%) - Hispanic or Latino
Geographical mobility - Moved within same county (%) - American Indian and Alaska Native
Geographical mobility - Moved within same county (%) - Multirace
Geographical mobility - Moved within same county (%) - Other Race
Geographical mobility - Moved from different county within same state (%)
Geographical mobility - Moved from different county within same state (%) - White
Geographical mobility - Moved from different county within same state (%) - Black or African American
Geographical mobility - Moved from different county within same state (%) - Asian
Geographical mobility - Moved from different county within same state (%) - Hispanic or Latino
Geographical mobility - Moved from different county within same state (%) - American Indian and Alaska Native
Geographical mobility - Moved from different county within same state (%) - Multirace
Geographical mobility - Moved from different county within same state (%) - Other Race
Geographical mobility - Moved from different state (%)
Geographical mobility - Moved from different state (%) - White
Geographical mobility - Moved from different state (%) - Black or African American
Geographical mobility - Moved from different state (%) - Asian
Geographical mobility - Moved from different state (%) - Hispanic or Latino
Geographical mobility - Moved from different state (%) - American Indian and Alaska Native
Geographical mobility - Moved from different state (%) - Multirace
Geographical mobility - Moved from different state (%) - Other Race
Geographical mobility - Moved from abroad (%)
Geographical mobility - Moved from abroad (%) - White
Geographical mobility - Moved from abroad (%) - Black or African American
Geographical mobility - Moved from abroad (%) - Asian
Geographical mobility - Moved from abroad (%) - Hispanic or Latino
Geographical mobility - Moved from abroad (%) - American Indian and Alaska Native
Geographical mobility - Moved from abroad (%) - Multirace
Geographical mobility - Moved from abroad (%) - Other Race
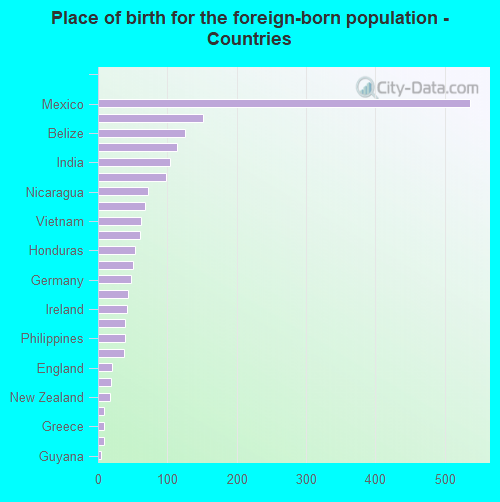
Place of birth for the foreign-born population - Ireland (%)
Place of birth for the foreign-born population - Denmark (%)
Place of birth for the foreign-born population - Norway (%)
Place of birth for the foreign-born population - Sweden (%)
Place of birth for the foreign-born population - United Kingdom (%)
Place of birth for the foreign-born population - England (%)
Place of birth for the foreign-born population - Scotland (%)
Place of birth for the foreign-born population - Other Northern Europe (%)
Place of birth for the foreign-born population - Austria (%)
Place of birth for the foreign-born population - Belgium (%)
Place of birth for the foreign-born population - France (%)
Place of birth for the foreign-born population - Germany (%)
Place of birth for the foreign-born population - Netherlands (%)
Place of birth for the foreign-born population - Switzerland (%)
Place of birth for the foreign-born population - Other Western Europe (%)
Place of birth for the foreign-born population - Greece (%)
Place of birth for the foreign-born population - Italy (%)
Place of birth for the foreign-born population - Portugal (%)
Place of birth for the foreign-born population - Spain (%)
Place of birth for the foreign-born population - Other Southern Europe (%)
Place of birth for the foreign-born population - Albania (%)
Place of birth for the foreign-born population - Belarus (%)
Place of birth for the foreign-born population - Bosnia and Herzegovina (%)
Place of birth for the foreign-born population - Bulgaria (%)
Place of birth for the foreign-born population - Croatia (%)
Place of birth for the foreign-born population - Czechoslovakia (%)
Place of birth for the foreign-born population - Hungary (%)
Place of birth for the foreign-born population - Latvia (%)
Place of birth for the foreign-born population - Lithuania (%)
Place of birth for the foreign-born population - North Macedonia (Macedonia) (%)
Place of birth for the foreign-born population - Moldova (%)
Place of birth for the foreign-born population - Poland (%)
Place of birth for the foreign-born population - Romania (%)
Place of birth for the foreign-born population - Russia (%)
Place of birth for the foreign-born population - Serbia (%)
Place of birth for the foreign-born population - Ukraine (%)
Place of birth for the foreign-born population - Other Eastern Europe (%)
Place of birth for the foreign-born population - China (%)
Place of birth for the foreign-born population - Hong Kong (%)
Place of birth for the foreign-born population - Taiwan (%)
Place of birth for the foreign-born population - Japan (%)
Place of birth for the foreign-born population - Korea (%)
Place of birth for the foreign-born population - Other Eastern Asia (%)
Place of birth for the foreign-born population - Afghanistan (%)
Place of birth for the foreign-born population - Bangladesh (%)
Place of birth for the foreign-born population - India (%)
Place of birth for the foreign-born population - Iran (%)
Place of birth for the foreign-born population - Kazakhstan (%)
Place of birth for the foreign-born population - Nepal (%)
Place of birth for the foreign-born population - Pakistan (%)
Place of birth for the foreign-born population - Sri Lanka (%)
Place of birth for the foreign-born population - Uzbekistan (%)
Place of birth for the foreign-born population - Other South Central Asia (%)
Place of birth for the foreign-born population - Burma (%)
Place of birth for the foreign-born population - Cambodia (%)
Place of birth for the foreign-born population - Indonesia (%)
Place of birth for the foreign-born population - Laos (%)
Place of birth for the foreign-born population - Malaysia (%)
Place of birth for the foreign-born population - Philippines (%)
Place of birth for the foreign-born population - Singapore (%)
Place of birth for the foreign-born population - Thailand (%)
Place of birth for the foreign-born population - Vietnam (%)
Place of birth for the foreign-born population - Other South Eastern Asia (%)
Place of birth for the foreign-born population - Armenia (%)
Place of birth for the foreign-born population - Iraq (%)
Place of birth for the foreign-born population - Israel (%)
Place of birth for the foreign-born population - Jordan (%)
Place of birth for the foreign-born population - Kuwait (%)
Place of birth for the foreign-born population - Lebanon (%)
Place of birth for the foreign-born population - Saudi Arabia (%)
Place of birth for the foreign-born population - Syria (%)
Place of birth for the foreign-born population - Turkey (%)
Place of birth for the foreign-born population - Yemen (%)
Place of birth for the foreign-born population - Other Western Asia (%)
Place of birth for the foreign-born population - Eritrea (%)
Place of birth for the foreign-born population - Ethiopia (%)
Place of birth for the foreign-born population - Kenya (%)
Place of birth for the foreign-born population - Somalia (%)
Place of birth for the foreign-born population - Uganda (%)
Place of birth for the foreign-born population - Zimbabwe (%)
Place of birth for the foreign-born population - Other Eastern Africa (%)
Place of birth for the foreign-born population - Cameroon (%)
Place of birth for the foreign-born population - Congo (%)
Place of birth for the foreign-born population - Democratic Republic of Congo (Zaire) (%)
Place of birth for the foreign-born population - Other Middle Africa (%)
Place of birth for the foreign-born population - Egypt (%)
Place of birth for the foreign-born population - Morocco (%)
Place of birth for the foreign-born population - Sudan (%)
Place of birth for the foreign-born population - Other Northern Africa (%)
Place of birth for the foreign-born population - South Africa (%)
Place of birth for the foreign-born population - Other Southern Africa (%)
Place of birth for the foreign-born population - Cabo Verde (%)
Place of birth for the foreign-born population - Ghana (%)
Place of birth for the foreign-born population - Liberia (%)
Place of birth for the foreign-born population - Nigeria (%)
Place of birth for the foreign-born population - Senegal (%)
Place of birth for the foreign-born population - Sierra Leone (%)
Place of birth for the foreign-born population - Other Western Africa (%)
Place of birth for the foreign-born population - Australia (%)
Place of birth for the foreign-born population - New Zealand (%)
Place of birth for the foreign-born population - Fiji (%)
Place of birth for the foreign-born population - Micronesia (%)
Place of birth for the foreign-born population - Bahamas (%)
Place of birth for the foreign-born population - Barbados (%)
Place of birth for the foreign-born population - Cuba (%)
Place of birth for the foreign-born population - Dominica (%)
Place of birth for the foreign-born population - Dominican Republic (%)
Place of birth for the foreign-born population - Grenada (%)
Place of birth for the foreign-born population - Haiti (%)
Place of birth for the foreign-born population - Jamaica (%)
Place of birth for the foreign-born population - St. Vincent and the Grenadines (%)
Place of birth for the foreign-born population - Trinidad and Tobago (%)
Place of birth for the foreign-born population - West Indies (%)
Place of birth for the foreign-born population - Other Caribbean (%)
Place of birth for the foreign-born population - Belize (%)
Place of birth for the foreign-born population - Costa Rica (%)
Place of birth for the foreign-born population - El Salvador (%)
Place of birth for the foreign-born population - Guatemala (%)
Place of birth for the foreign-born population - Honduras (%)
Place of birth for the foreign-born population - Mexico (%)
Place of birth for the foreign-born population - Nicaragua (%)
Place of birth for the foreign-born population - Panama (%)
Place of birth for the foreign-born population - Other Central America (%)
Place of birth for the foreign-born population - Argentina (%)
Place of birth for the foreign-born population - Bolivia (%)
Place of birth for the foreign-born population - Brazil (%)
Place of birth for the foreign-born population - Chile (%)
Place of birth for the foreign-born population - Colombia (%)
Place of birth for the foreign-born population - Ecuador (%)
Place of birth for the foreign-born population - Guyana (%)
Place of birth for the foreign-born population - Peru (%)
Place of birth for the foreign-born population - Uruguay (%)
Place of birth for the foreign-born population - Venezuela (%)
Place of birth for the foreign-born population - Other South America (%)
Place of birth for the foreign-born population - Canada (%)
Place of birth for the foreign-born population - Other Northern America (%)
Place of birth for the foreign-born population - Other (%)
Latest news about races in Jeffersonville, IN collected exclusively by city-data.com from local newspapers, TV, and radio stations
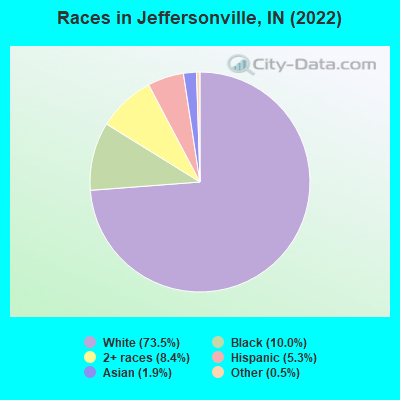
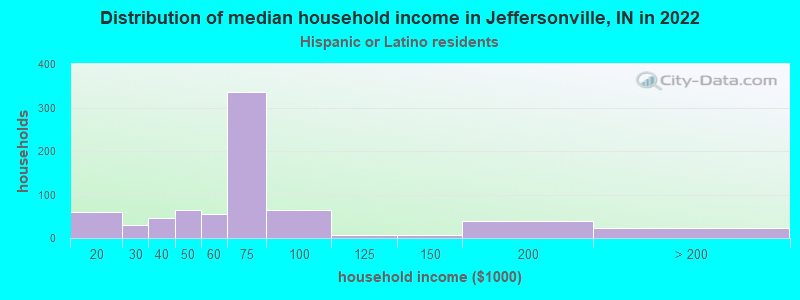
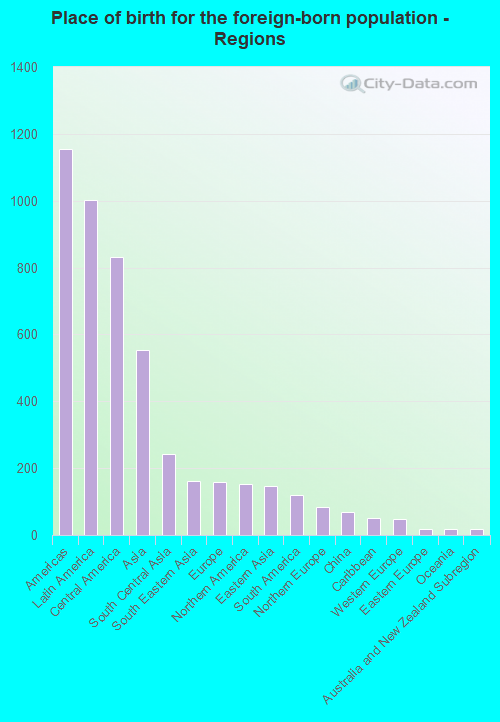
According to 2022 data, the most numerous races in Jeffersonville, IN are White alone (37,419 residents), Black alone (5,107 residents), and Hispanic (2,716 residents). 94.8% of Jeffersonville residents speak English at home. 3.7% of Jeffersonville, IN residents are foreign-born (1.8% born in Latin America, 1.0% born in Asia), which is 61.9% less than the foreign-born rate of 6.0% across the entire state of Indiana.
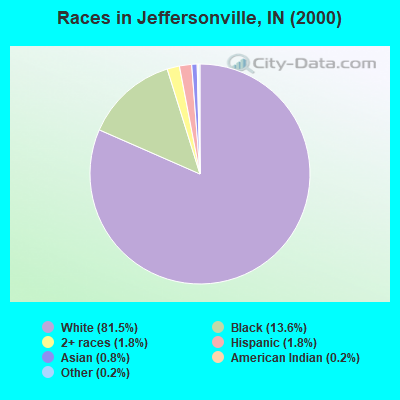
Race distribution in Jeffersonville
2000 2022
5,219,373 85.8% White alone 505,462 8.3% Black alone 214,536 3.5% Hispanic 61,115 1.0% Two or more races 58,424 1.0% Asian alone 13,654 0.2% American Indian alone 6,348 0.1% Other race alone 1,573 0.03% Native Hawaiian and Other
5,192,455 76.0% White alone 628,054 9.2% Black alone 534,528 7.8% Hispanic 263,242 3.9% Two or more races 172,880 2.5% Asian alone 33,467 0.5% Other race alone 5,866 0.09% American Indian alone 2,545 0.04% Native Hawaiian and Other
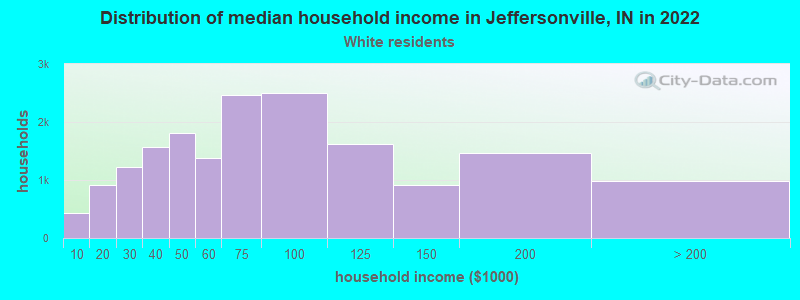
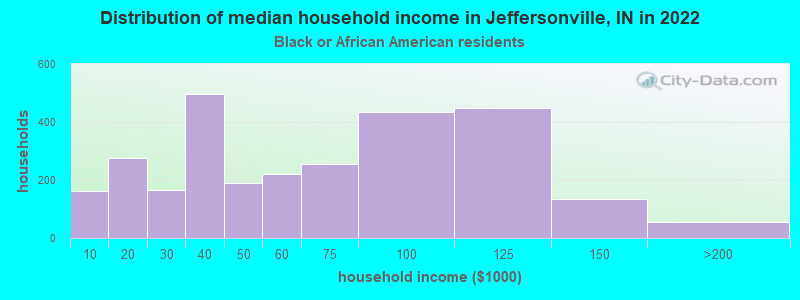
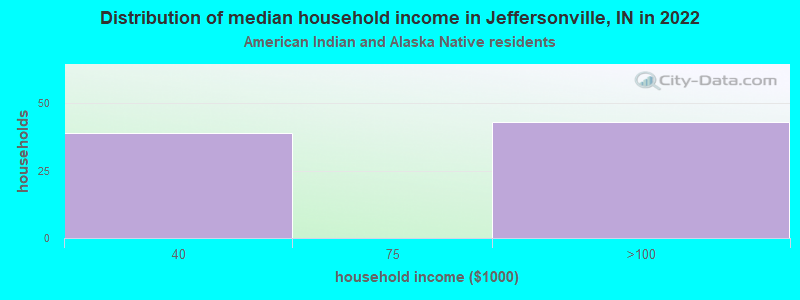
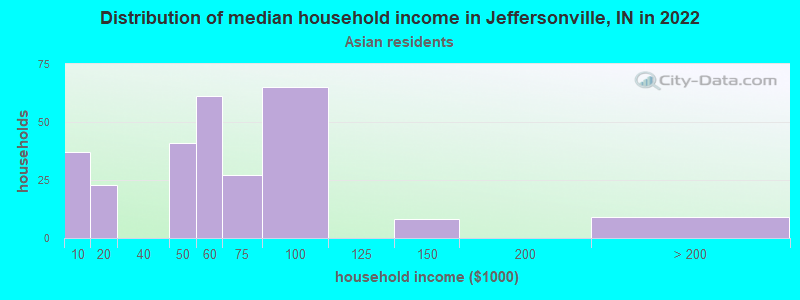
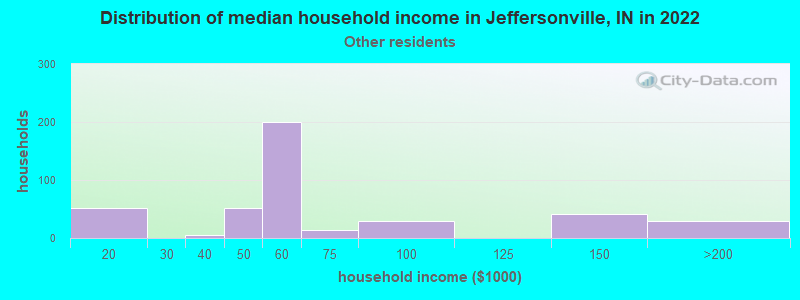
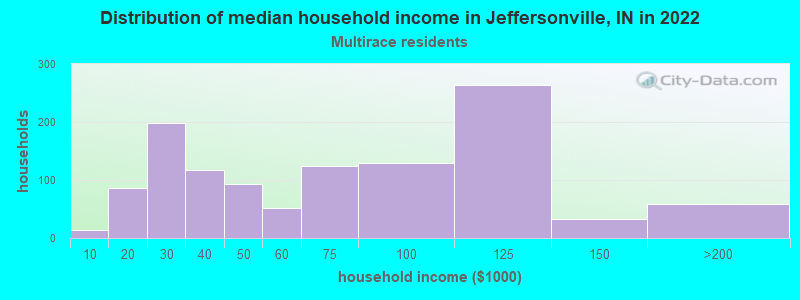
Income and house value in Jeffersonville Median household income in 2022 $69,883 White non-Hispanic householders$72,459 Black householders$61,604 Asian householders$41,572 Some other race householders$45,500 Two or more races householders$46,446 Hispanic or Latino race householdersMedian 2022 house value $219,010 White Non-Hispanic householders$192,547 Black or African American householders$228,335 American Indian or Alaska Native householders $444,573 Asian householders$198,596 Some other race householders$202,880 Two or more races householders$220,018 Hispanic or Latino householders
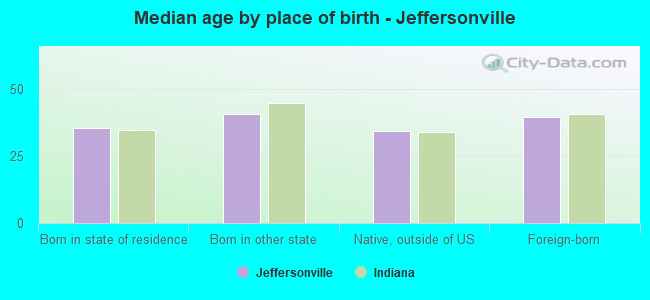
Median age by race in Jeffersonville
42.0 Median age for White residents40.6 42.8 37.1 Median age for Black or African American residents27.5 43.1 44.0 Median age for American Indian / Alaska Native residents-654,255,318.5 -491,600,353.2 34.8 Median age for Asian residents37.8 32.7 -666,666,666.0 Median age for Native Hawaiian / Pacific Islander residents-666,666,666.0 -666,666,666.0 47.5 Median age for Other race residents41.3 42.7 22.0 Median age for Two or more races residents18.0 23.9 42.3 Median age for White alone residents41.0 44.1 25.8 Median age for Hispanic or Latino residents23.8 26.9
Owner/renter occupied households by race in Jeffersonville
House owners and renters - White residents 13,377 77.2% Owner occupied3,961 22.8% Renter occupiedHouse owners and renters - Black or African American residents 1,016 50.1% Owner occupied1,010 49.9% Renter occupiedHouse owners and renters - American Indian / Alaska Native residents 83 100.0% Owner occupiedHouse owners and renters - Asian residents 263 87.3% Owner occupied38 12.7% Renter occupiedHouse owners and renters - Other race residents 183 52.7% Owner occupied164 47.3% Renter occupiedHouse owners and renters - Two or more races residents 868 63.5% Owner occupied499 36.5% Renter occupiedHouse owners and renters - White alone residents 13,304 77.2% Owner occupied3,925 22.8% Renter occupiedHouse owners and renters - Hispanic or Latino residents 232 30.1% Owner occupied538 69.9% Renter occupied
Language usage in Jeffersonville
English speakers - Total 94.8% of residents of Jeffersonville speak English at home.
2.6% of residents speak Spanish at home 660 53.9% Speak English very well565 46.1% Speak English less than very well2.5% of residents speak other language at home 690 58.5% Speak English very well489 41.5% Speak English less than very well
English speakers - Born in the United States 97.6% of residents of Jeffersonville speak English at home.
1.7% of residents speak Spanish at home 327 82.2% Speak English very well71 17.8% Speak English less than very well0.7% of residents speak other language at home 161 100.0% Speak English very well
English speakers - Native, born elsewhere 48.9% of residents of Jeffersonville speak English at home.
36.6% of residents speak Spanish at home 156 79.2% Speak English very well41 20.8% Speak English less than very well12.5% of residents speak other language at home 67 100.0% Speak English very well
English speakers - Foreign-born 24.5% of residents of Jeffersonville speak English at home.
28.7% of residents speak Spanish at home 224 40.4% Speak English very well330 59.6% Speak English less than very well52.4% of residents speak other language at home 587 58.1% Speak English very well424 41.9% Speak English less than very well
White (Caucasian) - Speak only English Native:
99.1% (35,343)Foreign-born:
79.0% (442)
White (Caucasian) - Speak another language Native:
1.0% (355)Foreign-born:
41.1% (230)
Black or African American - Speak only English Native:
99.1% (5,561)Foreign-born:
68.2% (5)
Asian - Speak only English Native:
59.6% (116)Foreign-born:
9.9% (44)
Asian - Speak another language Native:
39.0% (76)Foreign-born:
90.0% (396)
Other race - Speak only English Native:
65.3% (252)Foreign-born:
4.9% (20)
Other race - Speak another language Native:
36.5% (141)Foreign-born:
93.8% (390)
Two or more races - Speak only English Native:
93.4% (3,575)Foreign-born:
11.3% (46)
Two or more races - Speak another language Native:
6.8% (260)Foreign-born:
83.4% (340)
White alone - Speak only English Native:
99.6% (34,984)Foreign-born:
69.2% (401)
White alone - Speak another language Native:
0.4% (136)Foreign-born:
11.8% (69)
Hispanic or Latino - Speak only English Native:
78.1% (1,554)Foreign-born:
6.0% (38)
Hispanic or Latino - Speak another language Native:
28.6% (569)Foreign-born:
92.7% (580)
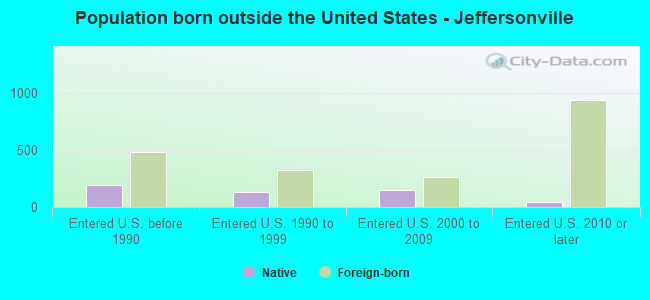
Foreign-born residents in Jeffersonville 1,886 residents are foreign born (1.8% Latin America , 1.0% Asia ).
This city:
3.7%Indiana:
5.6%
Marital status for residents in Jeffersonville Marital status - White (Caucasian) population 15 years and over
Males 29.8% Never married49.8% Now married1.3% Separated4.7% Widowed14.3% DivorcedFemales 23.7% Never married50.4% Now married0.8% Separated9.4% Widowed15.7% DivorcedWomen who gave birth in the past 12 months Now married:
74.5% (424)Unmarried:
25.5% (145)
Women who did not give birth in the past 12 months Now married:
49.8% (4,176)Unmarried:
50.2% (4,208)
Marital status - Black or African American population 15 years and over
Males 51.4% Never married25.5% Now married1.3% Separated1.8% Widowed20.1% DivorcedFemales 37.5% Never married27.9% Now married3.1% Separated9.2% Widowed22.3% DivorcedWomen who gave birth in the past 12 months Now married:
6.3% (4)Unmarried:
93.7% (59)
Women who did not give birth in the past 12 months Now married:
24.5% (321)Unmarried:
75.5% (990)
Marital status - American Indian / Alaska Native population 15 years and over
Males 0.0% Never married100.0% Now married0.0% Separated0.0% Widowed0.0% DivorcedFemales 0.0% Never married100.0% Now married0.0% Separated0.0% Widowed0.0% DivorcedMarital status - Asian population 15 years and over
Males 9.1% Never married60.0% Now married0.0% Separated0.0% Widowed30.9% DivorcedFemales 25.8% Never married58.3% Now married0.0% Separated0.0% Widowed15.9% DivorcedWomen who gave birth in the past 12 months Now married:
100.0% (48)Unmarried:
0.0% (0)
Women who did not give birth in the past 12 months Now married:
56.8% (122)Unmarried:
43.2% (93)
Marital status - Other race population 15 years and over
Males 19.8% Never married75.6% Now married0.0% Separated0.0% Widowed4.5% DivorcedFemales 9.8% Never married37.1% Now married0.0% Separated53.1% Widowed0.0% DivorcedWomen who did not give birth in the past 12 months Now married:
60.0% (51)Unmarried:
40.0% (34)
Marital status - Two or more races population 15 years and over
Males 57.0% Never married37.6% Now married0.0% Separated0.0% Widowed5.4% DivorcedFemales 42.6% Never married29.6% Now married0.0% Separated6.3% Widowed21.5% DivorcedWomen who gave birth in the past 12 months Now married:
100.0% (67)Unmarried:
0.0% (0)
Women who did not give birth in the past 12 months Now married:
22.5% (271)Unmarried:
77.5% (934)
Marital status - White alone, not Hispanic / Latino population 15 years and over
Males 29.3% Never married49.7% Now married1.4% Separated4.9% Widowed14.7% DivorcedFemales 23.0% Never married50.7% Now married0.8% Separated9.5% Widowed16.1% DivorcedWomen who gave birth in the past 12 months Now married:
79.6% (406)Unmarried:
20.4% (104)
Women who did not give birth in the past 12 months Now married:
50.1% (4,130)Unmarried:
49.9% (4,119)
Marital status - Hispanic or Latino population 15 years and over
Males 46.8% Never married53.2% Now married0.0% Separated0.0% Widowed0.0% DivorcedFemales 41.9% Never married46.8% Now married1.1% Separated6.1% Widowed4.1% DivorcedWomen who gave birth in the past 12 months Now married:
38.0% (29)Unmarried:
62.0% (47)
Women who did not give birth in the past 12 months Now married:
42.1% (212)Unmarried:
57.9% (292)
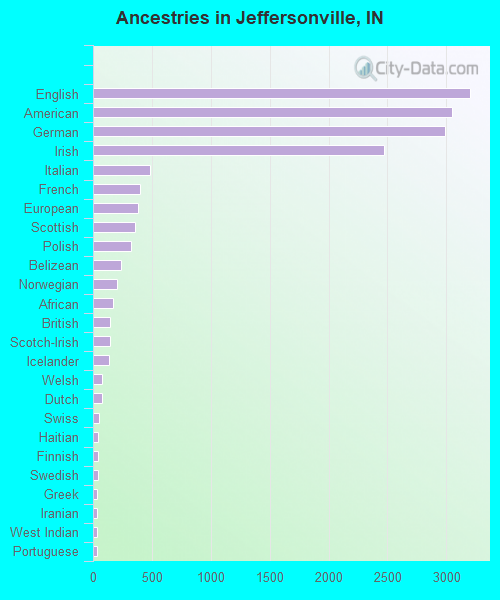
Ancestries in Jeffersonville
3,202 13.7% English3,045 13.0% American2,989 12.8% German2,473 10.6% Irish480 2.1% Italian401 1.7% French378 1.6% European360 1.5% Scottish321 1.4% Polish239 1.0% Belizean202 0.9% Norwegian170 0.7% African144 0.6% British141 0.6% Scotch-Irish134 0.6% Icelander80 0.3% Welsh77 0.3% Dutch51 0.2% Swiss46 0.2% Haitian45 0.2% Finnish40 0.2% Swedish36 0.2% Greek36 0.2% Iranian33 0.1% West Indian30 0.1% Portuguese21 0.09% Somali19 0.08% Hungarian17 0.07% Eastern European17 0.07% New Zealander11 0.05% Croatian10 0.04% Pennsylvania German10 0.04% Latvian8 0.03% Scandinavian8 0.03% Czech8 0.03% Ukrainian8 0.03% Jamaican7 0.03% Slavic6 0.03% Austrian5 0.02% French Canadian2 0.01% Belgian
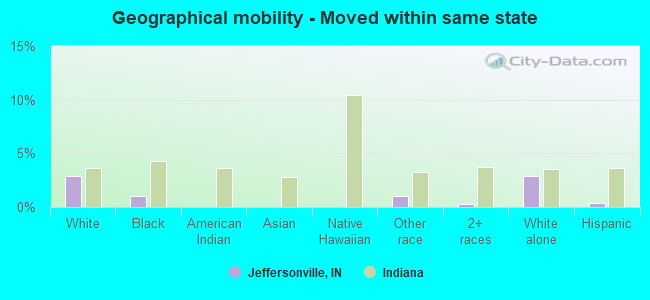
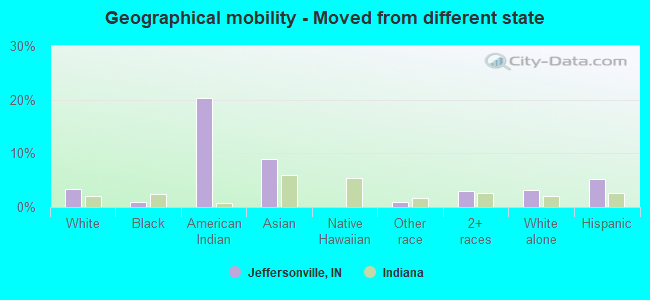
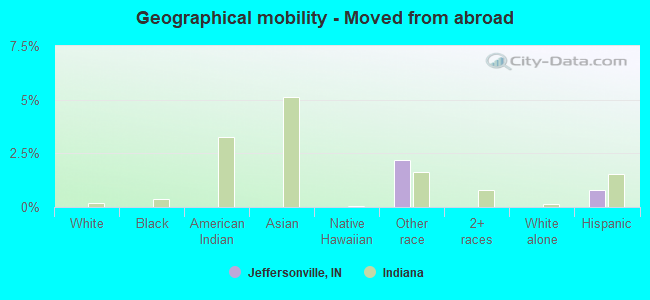
Geographical mobility in Jeffersonville Same house 1 year ago 32,290 86.9% White (Caucasian)5,647 96.6% Black or African American38 30.9% American Indian / Alaska Native494 74.2% Asian15 100.0% Native Hawaiian / Pacific Islander821 97.9% Other race4,464 86.8% Two or more races31,928 87.1% White alone, not Hispanic / Latino2,288 91.2% Hispanic or LatinoMoved within same county 2,552 6.9% White / Caucasian374 6.4% Black or African American107 16.1% Asian514 10.0% Two or more races2,495 6.8% White alone, not Hispanic / Latino59 2.4% Hispanic or LatinoMoved within same state 1,076 2.9% White / Caucasian57 1.0% Black or African American9 1.0% Other race16 0.3% Two or more races1,070 2.9% White alone, not Hispanic / Latino10 0.4% Hispanic or LatinoMoved from different state 1,267 3.4% White / Caucasian55 0.9% Black or African American25 20.3% American Indian / Alaska Native60 9.0% Asian8 1.0% Other race155 3.0% Two or more races1,135 3.1% White alone, not Hispanic / Latino133 5.3% Hispanic or LatinoMoved from abroad 1 0.0% Black or African American18 2.2% Other race20 0.8% Hispanic or Latino
Children Nativity (place of birth) in Jeffersonville
Children under 6 years - Living with two parents Both parents native 2,164 100.0% NativeBoth parents foreign-born 242 100.0% NativeOne native, one foreign-born parent 131 100.0% NativeChildren under 6 years - Living with one parent Native parent 1,082 100.0% NativeForeign-born parent 19 100.0% NativeChildren 6 to 17 years - Living with two parents Both parents native 3,434 100.0% NativeBoth parents foreign-born 114 100.0% NativeOne native, one foreign-born parent 469 100.0% NativeChildren 6 to 17 years - Living with one parent Native parent 1,936 91.0% Native192 9.0% Foreign-bornForeign-born parent 218 81.5% Native50 18.5% Foreign-born
Grandparents responsible for own grandchildren in Jeffersonville
Grandparents (30 to 59 years) White / Caucasian 112 39.6% Responsible for grandchildren171 60.4% Not responsible for grandchildrenBlack or African American 37 69.1% Responsible for grandchildren16 30.9% Not responsible for grandchildrenAsian 29 100.0% Not responsible for grandchildrenOther race 47 100.0% Not responsible for grandchildrenTwo or more races 11 100.0% Not responsible for grandchildrenWhite alone, not Hispanic / Latino 112 39.6% Responsible for grandchildren171 60.4% Not responsible for grandchildrenHispanic or Latino 38 100.0% Not responsible for grandchildrenGrandparents (60 years and over) White / Caucasian 91 19.7% Responsible for grandchildren372 80.3% Not responsible for grandchildrenBlack or African American 28 56.2% Responsible for grandchildren22 43.8% Not responsible for grandchildrenAsian 55 100.0% Not responsible for grandchildrenOther race 77 100.0% Not responsible for grandchildrenTwo or more races 7 100.0% Not responsible for grandchildrenWhite alone, not Hispanic / Latino 91 19.7% Responsible for grandchildren372 80.3% Not responsible for grandchildrenHispanic or Latino 3 100.0% Not responsible for grandchildren