Races in Johnstown, Colorado (CO) Detailed Stats
Data:
Races - White alone (%)
Races - White alone (% change since 2000)
Races - Black alone (%)
Races - Black alone (% change since 2000)
Races - American Indian alone (%)
Races - American Indian alone (% change since 2000)
Races - Asian alone (%)
Races - Asian alone (% change since 2000)
Races - Hispanic (%)
Races - Hispanic (% change since 2000)
Races - Native Hawaiian and Other Pacific Islander alone (%)
Races - Native Hawaiian and Other Pacific Islander alone (% change since 2000)
Races - Two or more races(%)
Races - Two or more races(% change since 2000)
Races - Other race alone (%)
Races - Other race alone (% change since 2000)
Racial diversity
Place of birth - Born in state of residence (%)
Place of birth - Born in state of residence (%) - White
Place of birth - Born in state of residence (%) - Black or African American
Place of birth - Born in state of residence (%) - Asian
Place of birth - Born in state of residence (%) - Hispanic or Latino
Place of birth - Born in state of residence (%) - American Indian and Alaska Native
Place of birth - Born in state of residence (%) - Multirace
Place of birth - Born in state of residence (%) - Other Race
Place of birth - Born in other state (%)
Place of birth - Born in other state (%) - White
Place of birth - Born in other state (%) - Black or African American
Place of birth - Born in other state (%) - Asian
Place of birth - Born in other state (%) - Hispanic or Latino
Place of birth - Born in other state (%) - American Indian and Alaska Native
Place of birth - Born in other state (%) - Multirace
Place of birth - Born in other state (%) - Other Race
Place of birth - Native, outside of US (%)
Place of birth - Native, outside of US (%) - White
Place of birth - Native, outside of US (%) - Black or African American
Place of birth - Native, outside of US (%) - Asian
Place of birth - Native, outside of US (%) - Hispanic or Latino
Place of birth - Native, outside of US (%) - American Indian and Alaska Native
Place of birth - Native, outside of US (%) - Multirace
Place of birth - Native, outside of US (%) - Other Race
Place of birth - Foreign born (%)
Place of birth - Foreign born (%) - White
Place of birth - Foreign born (%) - Black or African American
Place of birth - Foreign born (%) - Asian
Place of birth - Foreign born (%) - Hispanic or Latino
Place of birth - Foreign born (%) - American Indian and Alaska Native
Place of birth - Foreign born (%) - Multirace
Place of birth - Foreign born (%) - Other Race
Residents speaking English at home (%)
Residents speaking English at home - Born in the United States (%)
Residents speaking English at home - Native, born elsewhere (%)
Residents speaking English at home - Foreign born (%)
Residents speaking Spanish at home (%)
Residents speaking Spanish at home - Born in the United States (%)
Residents speaking Spanish at home - Native, born elsewhere (%)
Residents speaking Spanish at home - Foreign born (%)
Residents speaking other language at home (%)
Residents speaking other language at home - Born in the United States (%)
Residents speaking other language at home - Native, born elsewhere (%)
Residents speaking other language at home - Foreign born (%)
Marital status - Never married (%)
Marital status - Now married (%)
Marital status - Separated (%)
Marital status - Widowed (%)
Marital status - Divorced (%)
Ancestries Reported - Arab (%)
Ancestries Reported - Czech (%)
Ancestries Reported - Danish (%)
Ancestries Reported - Dutch (%)
Ancestries Reported - English (%)
Ancestries Reported - French (%)
Ancestries Reported - French Canadian (%)
Ancestries Reported - German (%)
Ancestries Reported - Greek (%)
Ancestries Reported - Hungarian (%)
Ancestries Reported - Irish (%)
Ancestries Reported - Italian (%)
Ancestries Reported - Lithuanian (%)
Ancestries Reported - Norwegian (%)
Ancestries Reported - Polish (%)
Ancestries Reported - Portuguese (%)
Ancestries Reported - Russian (%)
Ancestries Reported - Scotch-Irish (%)
Ancestries Reported - Scottish (%)
Ancestries Reported - Slovak (%)
Ancestries Reported - Subsaharan African (%)
Ancestries Reported - Swedish (%)
Ancestries Reported - Swiss (%)
Ancestries Reported - Ukrainian (%)
Ancestries Reported - United States (%)
Ancestries Reported - Welsh (%)
Ancestries Reported - West Indian (%)
Ancestries Reported - Other (%)
Geographical mobility - Same house 1 year ago (%)
Geographical mobility - Same house 1 year ago (%) - White
Geographical mobility - Same house 1 year ago (%) - Black or African American
Geographical mobility - Same house 1 year ago (%) - Asian
Geographical mobility - Same house 1 year ago (%) - Hispanic or Latino
Geographical mobility - Same house 1 year ago (%) - American Indian and Alaska Native
Geographical mobility - Same house 1 year ago (%) - Multirace
Geographical mobility - Same house 1 year ago (%) - Other Race
Geographical mobility - Moved within same county (%)
Geographical mobility - Moved within same county (%) - White
Geographical mobility - Moved within same county (%) - Black or African American
Geographical mobility - Moved within same county (%) - Asian
Geographical mobility - Moved within same county (%) - Hispanic or Latino
Geographical mobility - Moved within same county (%) - American Indian and Alaska Native
Geographical mobility - Moved within same county (%) - Multirace
Geographical mobility - Moved within same county (%) - Other Race
Geographical mobility - Moved from different county within same state (%)
Geographical mobility - Moved from different county within same state (%) - White
Geographical mobility - Moved from different county within same state (%) - Black or African American
Geographical mobility - Moved from different county within same state (%) - Asian
Geographical mobility - Moved from different county within same state (%) - Hispanic or Latino
Geographical mobility - Moved from different county within same state (%) - American Indian and Alaska Native
Geographical mobility - Moved from different county within same state (%) - Multirace
Geographical mobility - Moved from different county within same state (%) - Other Race
Geographical mobility - Moved from different state (%)
Geographical mobility - Moved from different state (%) - White
Geographical mobility - Moved from different state (%) - Black or African American
Geographical mobility - Moved from different state (%) - Asian
Geographical mobility - Moved from different state (%) - Hispanic or Latino
Geographical mobility - Moved from different state (%) - American Indian and Alaska Native
Geographical mobility - Moved from different state (%) - Multirace
Geographical mobility - Moved from different state (%) - Other Race
Geographical mobility - Moved from abroad (%)
Geographical mobility - Moved from abroad (%) - White
Geographical mobility - Moved from abroad (%) - Black or African American
Geographical mobility - Moved from abroad (%) - Asian
Geographical mobility - Moved from abroad (%) - Hispanic or Latino
Geographical mobility - Moved from abroad (%) - American Indian and Alaska Native
Geographical mobility - Moved from abroad (%) - Multirace
Geographical mobility - Moved from abroad (%) - Other Race
Place of birth for the foreign-born population - Ireland (%)
Place of birth for the foreign-born population - Denmark (%)
Place of birth for the foreign-born population - Norway (%)
Place of birth for the foreign-born population - Sweden (%)
Place of birth for the foreign-born population - United Kingdom (%)
Place of birth for the foreign-born population - England (%)
Place of birth for the foreign-born population - Scotland (%)
Place of birth for the foreign-born population - Other Northern Europe (%)
Place of birth for the foreign-born population - Austria (%)
Place of birth for the foreign-born population - Belgium (%)
Place of birth for the foreign-born population - France (%)
Place of birth for the foreign-born population - Germany (%)
Place of birth for the foreign-born population - Netherlands (%)
Place of birth for the foreign-born population - Switzerland (%)
Place of birth for the foreign-born population - Other Western Europe (%)
Place of birth for the foreign-born population - Greece (%)
Place of birth for the foreign-born population - Italy (%)
Place of birth for the foreign-born population - Portugal (%)
Place of birth for the foreign-born population - Spain (%)
Place of birth for the foreign-born population - Other Southern Europe (%)
Place of birth for the foreign-born population - Albania (%)
Place of birth for the foreign-born population - Belarus (%)
Place of birth for the foreign-born population - Bosnia and Herzegovina (%)
Place of birth for the foreign-born population - Bulgaria (%)
Place of birth for the foreign-born population - Croatia (%)
Place of birth for the foreign-born population - Czechoslovakia (%)
Place of birth for the foreign-born population - Hungary (%)
Place of birth for the foreign-born population - Latvia (%)
Place of birth for the foreign-born population - Lithuania (%)
Place of birth for the foreign-born population - North Macedonia (Macedonia) (%)
Place of birth for the foreign-born population - Moldova (%)
Place of birth for the foreign-born population - Poland (%)
Place of birth for the foreign-born population - Romania (%)
Place of birth for the foreign-born population - Russia (%)
Place of birth for the foreign-born population - Serbia (%)
Place of birth for the foreign-born population - Ukraine (%)
Place of birth for the foreign-born population - Other Eastern Europe (%)
Place of birth for the foreign-born population - China (%)
Place of birth for the foreign-born population - Hong Kong (%)
Place of birth for the foreign-born population - Taiwan (%)
Place of birth for the foreign-born population - Japan (%)
Place of birth for the foreign-born population - Korea (%)
Place of birth for the foreign-born population - Other Eastern Asia (%)
Place of birth for the foreign-born population - Afghanistan (%)
Place of birth for the foreign-born population - Bangladesh (%)
Place of birth for the foreign-born population - India (%)
Place of birth for the foreign-born population - Iran (%)
Place of birth for the foreign-born population - Kazakhstan (%)
Place of birth for the foreign-born population - Nepal (%)
Place of birth for the foreign-born population - Pakistan (%)
Place of birth for the foreign-born population - Sri Lanka (%)
Place of birth for the foreign-born population - Uzbekistan (%)
Place of birth for the foreign-born population - Other South Central Asia (%)
Place of birth for the foreign-born population - Burma (%)
Place of birth for the foreign-born population - Cambodia (%)
Place of birth for the foreign-born population - Indonesia (%)
Place of birth for the foreign-born population - Laos (%)
Place of birth for the foreign-born population - Malaysia (%)
Place of birth for the foreign-born population - Philippines (%)
Place of birth for the foreign-born population - Singapore (%)
Place of birth for the foreign-born population - Thailand (%)
Place of birth for the foreign-born population - Vietnam (%)
Place of birth for the foreign-born population - Other South Eastern Asia (%)
Place of birth for the foreign-born population - Armenia (%)
Place of birth for the foreign-born population - Iraq (%)
Place of birth for the foreign-born population - Israel (%)
Place of birth for the foreign-born population - Jordan (%)
Place of birth for the foreign-born population - Kuwait (%)
Place of birth for the foreign-born population - Lebanon (%)
Place of birth for the foreign-born population - Saudi Arabia (%)
Place of birth for the foreign-born population - Syria (%)
Place of birth for the foreign-born population - Turkey (%)
Place of birth for the foreign-born population - Yemen (%)
Place of birth for the foreign-born population - Other Western Asia (%)
Place of birth for the foreign-born population - Eritrea (%)
Place of birth for the foreign-born population - Ethiopia (%)
Place of birth for the foreign-born population - Kenya (%)
Place of birth for the foreign-born population - Somalia (%)
Place of birth for the foreign-born population - Uganda (%)
Place of birth for the foreign-born population - Zimbabwe (%)
Place of birth for the foreign-born population - Other Eastern Africa (%)
Place of birth for the foreign-born population - Cameroon (%)
Place of birth for the foreign-born population - Congo (%)
Place of birth for the foreign-born population - Democratic Republic of Congo (Zaire) (%)
Place of birth for the foreign-born population - Other Middle Africa (%)
Place of birth for the foreign-born population - Egypt (%)
Place of birth for the foreign-born population - Morocco (%)
Place of birth for the foreign-born population - Sudan (%)
Place of birth for the foreign-born population - Other Northern Africa (%)
Place of birth for the foreign-born population - South Africa (%)
Place of birth for the foreign-born population - Other Southern Africa (%)
Place of birth for the foreign-born population - Cabo Verde (%)
Place of birth for the foreign-born population - Ghana (%)
Place of birth for the foreign-born population - Liberia (%)
Place of birth for the foreign-born population - Nigeria (%)
Place of birth for the foreign-born population - Senegal (%)
Place of birth for the foreign-born population - Sierra Leone (%)
Place of birth for the foreign-born population - Other Western Africa (%)
Place of birth for the foreign-born population - Australia (%)
Place of birth for the foreign-born population - New Zealand (%)
Place of birth for the foreign-born population - Fiji (%)
Place of birth for the foreign-born population - Micronesia (%)
Place of birth for the foreign-born population - Bahamas (%)
Place of birth for the foreign-born population - Barbados (%)
Place of birth for the foreign-born population - Cuba (%)
Place of birth for the foreign-born population - Dominica (%)
Place of birth for the foreign-born population - Dominican Republic (%)
Place of birth for the foreign-born population - Grenada (%)
Place of birth for the foreign-born population - Haiti (%)
Place of birth for the foreign-born population - Jamaica (%)
Place of birth for the foreign-born population - St. Vincent and the Grenadines (%)
Place of birth for the foreign-born population - Trinidad and Tobago (%)
Place of birth for the foreign-born population - West Indies (%)
Place of birth for the foreign-born population - Other Caribbean (%)
Place of birth for the foreign-born population - Belize (%)
Place of birth for the foreign-born population - Costa Rica (%)
Place of birth for the foreign-born population - El Salvador (%)
Place of birth for the foreign-born population - Guatemala (%)
Place of birth for the foreign-born population - Honduras (%)
Place of birth for the foreign-born population - Mexico (%)
Place of birth for the foreign-born population - Nicaragua (%)
Place of birth for the foreign-born population - Panama (%)
Place of birth for the foreign-born population - Other Central America (%)
Place of birth for the foreign-born population - Argentina (%)
Place of birth for the foreign-born population - Bolivia (%)
Place of birth for the foreign-born population - Brazil (%)
Place of birth for the foreign-born population - Chile (%)
Place of birth for the foreign-born population - Colombia (%)
Place of birth for the foreign-born population - Ecuador (%)
Place of birth for the foreign-born population - Guyana (%)
Place of birth for the foreign-born population - Peru (%)
Place of birth for the foreign-born population - Uruguay (%)
Place of birth for the foreign-born population - Venezuela (%)
Place of birth for the foreign-born population - Other South America (%)
Place of birth for the foreign-born population - Canada (%)
Place of birth for the foreign-born population - Other Northern America (%)
Place of birth for the foreign-born population - Other (%)
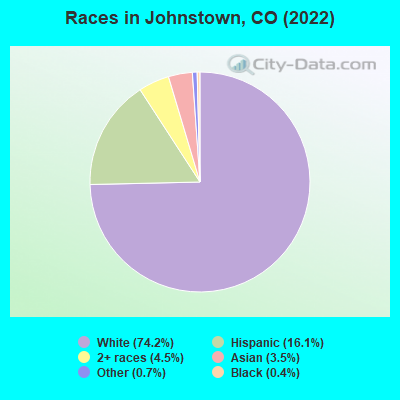
According to 2022 data, the most numerous races in Johnstown, CO are White alone (12,194 residents), Hispanic (2,470 residents), and Two or more races (322 residents). 87.7% of Johnstown residents speak English at home. 4.8% of Johnstown, CO residents are foreign-born (3.1% born in Latin America, 1.5% born in Asia), which is 85.9% less than the foreign-born rate of 9.0% across the entire state of Colorado.
Race distribution in Johnstown
2000 2022
3,202,880 74.5% White alone 735,601 17.1% Hispanic 158,443 3.7% Black alone 93,277 2.2% Asian alone 72,721 1.7% Two or more races 28,982 0.7% American Indian alone 5,512 0.1% Other race alone 3,845 0.09% Native Hawaiian and Other
3,793,270 65.0% White alone 1,314,962 22.5% Hispanic 268,754 4.6% Two or more races 220,756 3.8% Black alone 182,658 3.1% Asian alone 29,798 0.5% Other race alone 23,389 0.4% American Indian alone 6,339 0.1% Native Hawaiian and Other
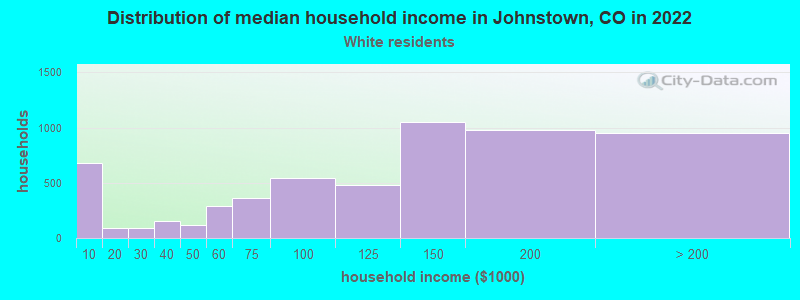
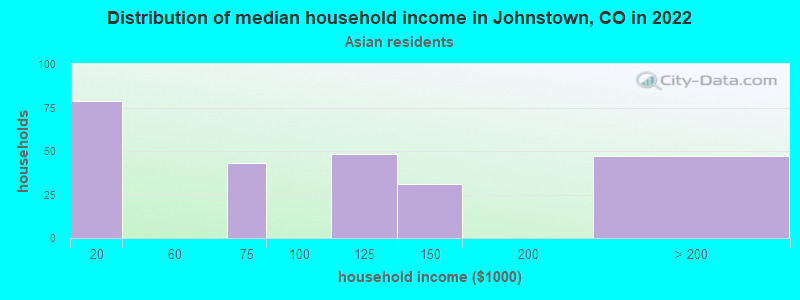
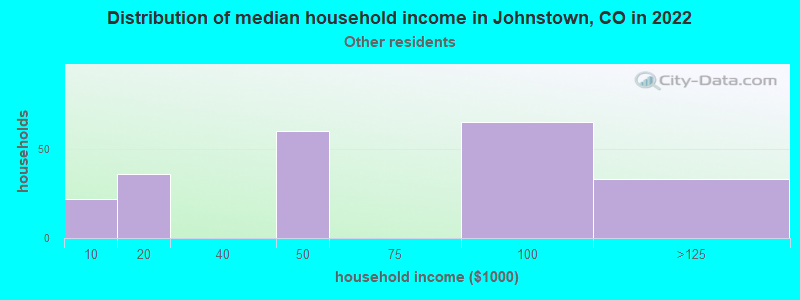
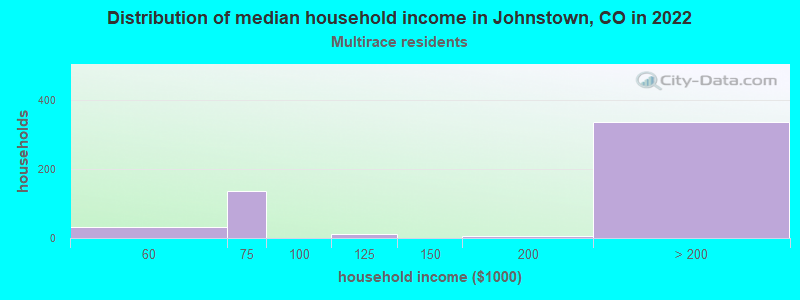
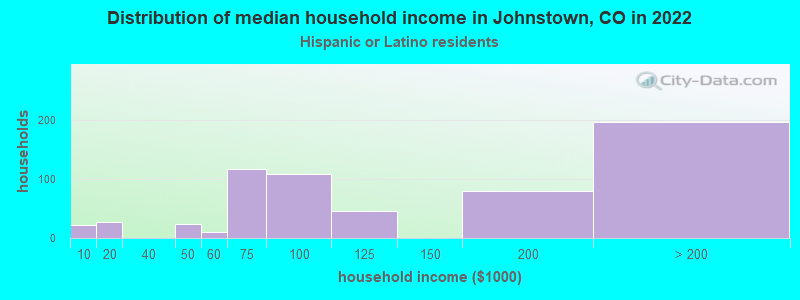
Income and house value in Johnstown Median household income in 2022 $132,319 White non-Hispanic householders$94,167 American Indian and Alaska Native householders$158,893 Some other race householders$117,931 Two or more races householders$83,223 Hispanic or Latino race householdersMedian 2022 house value $523,138 White Non-Hispanic householders$588,821 American Indian or Alaska Native householders$380,826 Some other race householders$373,196 Two or more races householders$418,643 Hispanic or Latino householders
Median age by race in Johnstown
36.2 Median age for White residents34.9 38.8 37.7 Median age for Black or African American residents12.0 Median age for American Indian / Alaska Native residents38.5 Median age for Asian residents33.8 44.4 34.3 Median age for Other race residents11.1 Median age for Two or more races residents10.9 7.1 37.7 Median age for White alone residents35.3 43.0 30.4 Median age for Hispanic or Latino residents31.9 22.6
Owner/renter occupied households by race in Johnstown
House owners and renters - White residents 4,550 89.2% Owner occupied553 10.8% Renter occupiedHouse owners and renters - Black or African American residents 38 100.0% Owner occupiedHouse owners and renters - Asian residents 245 100.0% Owner occupiedHouse owners and renters - Other race residents 71 100.0% Renter occupiedHouse owners and renters - Two or more races residents 119 66.4% Owner occupied60 33.6% Renter occupiedHouse owners and renters - White alone residents 4,517 89.9% Owner occupied510 10.1% Renter occupiedHouse owners and renters - Hispanic or Latino residents 297 63.0% Owner occupied174 37.0% Renter occupied
Language usage in Johnstown
English speakers - Total 87.7% of residents of Johnstown speak English at home.
9.5% of residents speak Spanish at home 943 71.2% Speak English very well382 28.8% Speak English less than very well2.9% of residents speak other language at home 142 34.5% Speak English very well270 65.5% Speak English less than very well
English speakers - Born in the United States 92.4% of residents of Johnstown speak English at home.
6.6% of residents speak Spanish at home 393 88.9% Speak English very well49 11.1% Speak English less than very well1.0% of residents speak other language at home 69 100.0% Speak English very well
English speakers - Native, born elsewhere 51.4% of residents of Johnstown speak English at home.
41.4% of residents speak other language at home 29 100.0% Speak English very well
English speakers - Foreign-born 21.8% of residents of Johnstown speak English at home.
52.0% of residents speak Spanish at home 163 39.9% Speak English very well246 60.1% Speak English less than very well24.9% of residents speak other language at home 196 100.0% Speak English less than very well
White (Caucasian) - Speak only English Native:
95.8% (11,512)Foreign-born:
14.2% (47)
White (Caucasian) - Speak another language Native:
4.9% (585)Foreign-born:
80.4% (264)
Black or African American - Speak only English Native:
98.2% (57)Foreign-born:
91.1% (29)
Asian - Speak only English Native:
35.7% (72)Foreign-born:
38.6% (86)
Asian - Speak another language Native:
45.0% (91)Foreign-born:
63.0% (140)
Other race - Speak another language Native:
47.1% (193)Foreign-born:
97.3% (134)
White alone - Speak only English Native:
97.8% (11,242)Foreign-born:
73.0% (57)
White alone - Speak another language Native:
2.1% (241)Foreign-born:
27.0% (21)
Hispanic or Latino - Speak only English Native:
58.5% (1,076)Foreign-born:
6.0% (32)
Hispanic or Latino - Speak another language Native:
40.7% (748)Foreign-born:
93.7% (498)
Foreign-born residents in Johnstown 789 residents are foreign born (3.1% Latin America , 1.5% Asia ).
This city:
4.8%Colorado:
100.0%
Marital status for residents in Johnstown Marital status - White (Caucasian) population 15 years and over
Males 24.2% Never married66.2% Now married1.0% Separated0.0% Widowed8.6% DivorcedFemales 16.3% Never married66.9% Now married0.7% Separated5.0% Widowed11.2% DivorcedWomen who gave birth in the past 12 months Now married:
100.0% (101)Unmarried:
0.0% (0)
Women who did not give birth in the past 12 months Now married:
67.7% (1,917)Unmarried:
32.3% (916)
Marital status - Black or African American population 15 years and over
Males 0.0% Never married44.8% Now married0.0% Separated0.0% Widowed55.2% DivorcedFemales 0.0% Never married100.0% Now married0.0% Separated0.0% Widowed0.0% DivorcedWomen who did not give birth in the past 12 months Now married:
100.0% (26)Unmarried:
0.0% (0)
Marital status - Asian population 15 years and over
Males 40.2% Never married59.8% Now married0.0% Separated0.0% Widowed0.0% DivorcedFemales 13.6% Never married72.4% Now married0.0% Separated0.0% Widowed14.0% DivorcedWomen who gave birth in the past 12 months Now married:
100.0% (55)Unmarried:
0.0% (0)
Women who did not give birth in the past 12 months Now married:
74.4% (102)Unmarried:
25.6% (35)
Marital status - Other race population 15 years and over
Males 54.8% Never married45.2% Now married0.0% Separated0.0% Widowed0.0% DivorcedFemales 70.5% Never married0.0% Now married0.0% Separated29.5% Widowed0.0% DivorcedWomen who did not give birth in the past 12 months Now married:
0.0% (0)Unmarried:
100.0% (60)
Marital status - Two or more races population 15 years and over
Males 24.5% Never married75.5% Now married0.0% Separated0.0% Widowed0.0% DivorcedFemales 100.0% Never married0.0% Now married0.0% Separated0.0% Widowed0.0% DivorcedWomen who did not give birth in the past 12 months Now married:
0.0% (0)Unmarried:
100.0% (72)
Marital status - White alone, not Hispanic / Latino population 15 years and over
Males 22.8% Never married68.2% Now married1.2% Separated0.0% Widowed7.9% DivorcedFemales 13.3% Never married68.2% Now married0.7% Separated5.5% Widowed12.3% DivorcedWomen who gave birth in the past 12 months Now married:
100.0% (110)Unmarried:
0.0% (0)
Women who did not give birth in the past 12 months Now married:
69.6% (1,865)Unmarried:
30.4% (816)
Marital status - Hispanic or Latino population 15 years and over
Males 38.2% Never married51.8% Now married0.0% Separated0.0% Widowed10.0% DivorcedFemales 45.8% Never married51.8% Now married0.0% Separated2.4% Widowed0.0% DivorcedWomen who did not give birth in the past 12 months Now married:
54.2% (288)Unmarried:
45.8% (243)
Ancestries in Johnstown
787 13.6% English685 11.8% German516 8.9% American488 8.4% Irish256 4.4% European194 3.3% Italian131 2.3% Eastern European122 2.1% Polish55 0.9% Welsh48 0.8% French46 0.8% Ukrainian45 0.8% British40 0.7% Northern European37 0.6% Scottish33 0.6% Dutch32 0.6% Czechoslovakian31 0.5% Lebanese29 0.5% Greek25 0.4% Scotch-Irish25 0.4% Jamaican24 0.4% Romanian21 0.4% Canadian16 0.3% Slovene14 0.2% Russian
Children Nativity (place of birth) in Johnstown
Children under 6 years - Living with two parents Both parents native 1,283 100.0% NativeOne native, one foreign-born parent 197 100.0% NativeChildren under 6 years - Living with one parent Native parent 6 100.0% NativeForeign-born parent 22 100.0% Native
Children 6 to 17 years - Living with two parents Both parents native 1,989 100.0% NativeBoth parents foreign-born 64 100.0% NativeOne native, one foreign-born parent 240 100.0% NativeChildren 6 to 17 years - Living with one parent Native parent 112 100.0% Native
Grandparents responsible for own grandchildren in Johnstown
Grandparents (30 to 59 years) White / Caucasian 67 100.0% Not responsible for grandchildrenWhite alone, not Hispanic / Latino 77 100.0% Not responsible for grandchildrenHispanic or Latino 11 100.0% Not responsible for grandchildren
Grandparents (60 years and over) White / Caucasian 184 100.0% Not responsible for grandchildrenWhite alone, not Hispanic / Latino 186 100.0% Not responsible for grandchildrenHispanic or Latino 33 100.0% Not responsible for grandchildren