Races in King of Prussia, Pennsylvania (PA) Detailed Stats
Data:
Races - White alone (%)
Races - White alone (% change since 2000)
Races - Black alone (%)
Races - Black alone (% change since 2000)
Races - American Indian alone (%)
Races - American Indian alone (% change since 2000)
Races - Asian alone (%)
Races - Asian alone (% change since 2000)
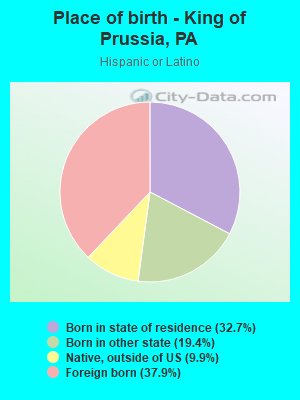
Races - Hispanic (%)
Races - Hispanic (% change since 2000)
Races - Native Hawaiian and Other Pacific Islander alone (%)
Races - Native Hawaiian and Other Pacific Islander alone (% change since 2000)
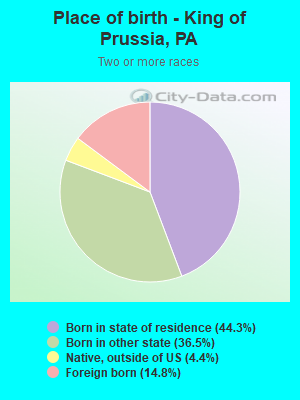
Races - Two or more races(%)
Races - Two or more races(% change since 2000)
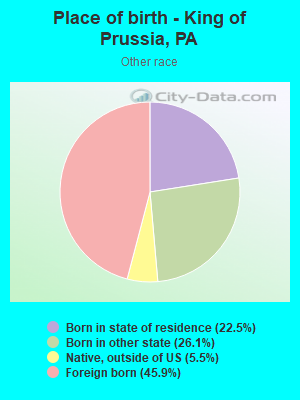
Races - Other race alone (%)
Races - Other race alone (% change since 2000)
Racial diversity
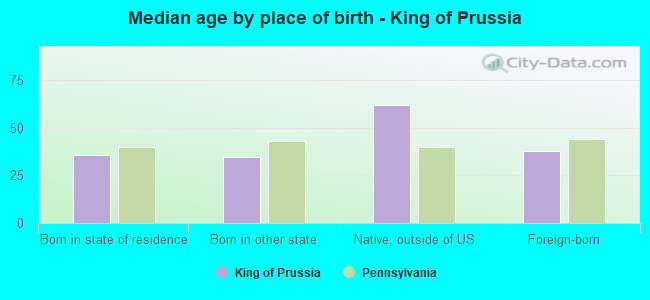
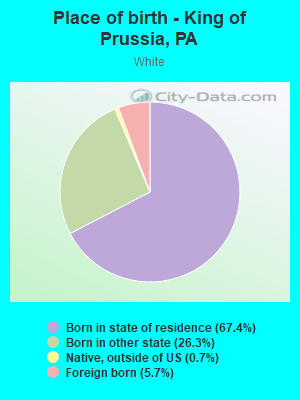
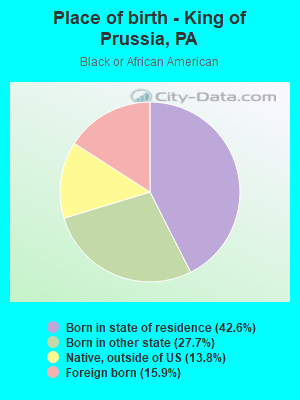
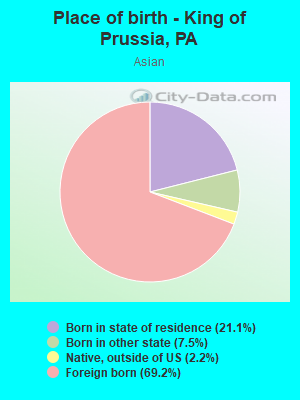
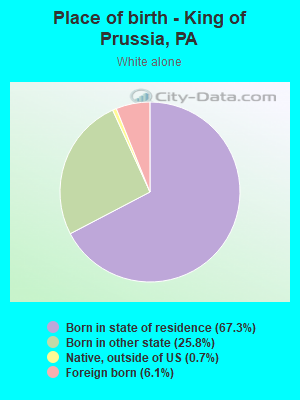
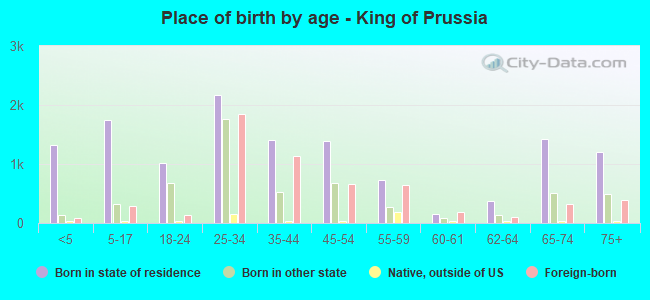
Place of birth - Born in state of residence (%)
Place of birth - Born in state of residence (%) - White
Place of birth - Born in state of residence (%) - Black or African American
Place of birth - Born in state of residence (%) - Asian
Place of birth - Born in state of residence (%) - Hispanic or Latino
Place of birth - Born in state of residence (%) - American Indian and Alaska Native
Place of birth - Born in state of residence (%) - Multirace
Place of birth - Born in state of residence (%) - Other Race
Place of birth - Born in other state (%)
Place of birth - Born in other state (%) - White
Place of birth - Born in other state (%) - Black or African American
Place of birth - Born in other state (%) - Asian
Place of birth - Born in other state (%) - Hispanic or Latino
Place of birth - Born in other state (%) - American Indian and Alaska Native
Place of birth - Born in other state (%) - Multirace
Place of birth - Born in other state (%) - Other Race
Place of birth - Native, outside of US (%)
Place of birth - Native, outside of US (%) - White
Place of birth - Native, outside of US (%) - Black or African American
Place of birth - Native, outside of US (%) - Asian
Place of birth - Native, outside of US (%) - Hispanic or Latino
Place of birth - Native, outside of US (%) - American Indian and Alaska Native
Place of birth - Native, outside of US (%) - Multirace
Place of birth - Native, outside of US (%) - Other Race
Place of birth - Foreign born (%)
Place of birth - Foreign born (%) - White
Place of birth - Foreign born (%) - Black or African American
Place of birth - Foreign born (%) - Asian
Place of birth - Foreign born (%) - Hispanic or Latino
Place of birth - Foreign born (%) - American Indian and Alaska Native
Place of birth - Foreign born (%) - Multirace
Place of birth - Foreign born (%) - Other Race
Residents speaking English at home (%)
Residents speaking English at home - Born in the United States (%)
Residents speaking English at home - Native, born elsewhere (%)
Residents speaking English at home - Foreign born (%)
Residents speaking Spanish at home (%)
Residents speaking Spanish at home - Born in the United States (%)
Residents speaking Spanish at home - Native, born elsewhere (%)
Residents speaking Spanish at home - Foreign born (%)
Residents speaking other language at home (%)
Residents speaking other language at home - Born in the United States (%)
Residents speaking other language at home - Native, born elsewhere (%)
Residents speaking other language at home - Foreign born (%)
Marital status - Never married (%)
Marital status - Now married (%)
Marital status - Separated (%)
Marital status - Widowed (%)
Marital status - Divorced (%)
Ancestries Reported - Arab (%)
Ancestries Reported - Czech (%)
Ancestries Reported - Danish (%)
Ancestries Reported - Dutch (%)
Ancestries Reported - English (%)
Ancestries Reported - French (%)
Ancestries Reported - French Canadian (%)
Ancestries Reported - German (%)
Ancestries Reported - Greek (%)
Ancestries Reported - Hungarian (%)
Ancestries Reported - Irish (%)
Ancestries Reported - Italian (%)
Ancestries Reported - Lithuanian (%)
Ancestries Reported - Norwegian (%)
Ancestries Reported - Polish (%)
Ancestries Reported - Portuguese (%)
Ancestries Reported - Russian (%)
Ancestries Reported - Scotch-Irish (%)
Ancestries Reported - Scottish (%)
Ancestries Reported - Slovak (%)
Ancestries Reported - Subsaharan African (%)
Ancestries Reported - Swedish (%)
Ancestries Reported - Swiss (%)
Ancestries Reported - Ukrainian (%)
Ancestries Reported - United States (%)
Ancestries Reported - Welsh (%)
Ancestries Reported - West Indian (%)
Ancestries Reported - Other (%)
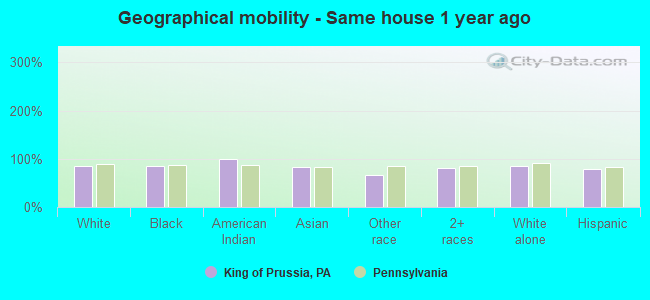
Geographical mobility - Same house 1 year ago (%)
Geographical mobility - Same house 1 year ago (%) - White
Geographical mobility - Same house 1 year ago (%) - Black or African American
Geographical mobility - Same house 1 year ago (%) - Asian
Geographical mobility - Same house 1 year ago (%) - Hispanic or Latino
Geographical mobility - Same house 1 year ago (%) - American Indian and Alaska Native
Geographical mobility - Same house 1 year ago (%) - Multirace
Geographical mobility - Same house 1 year ago (%) - Other Race
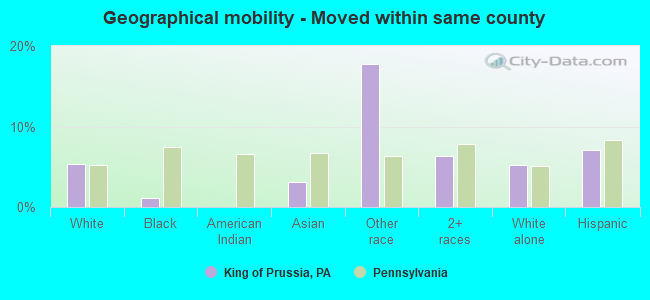
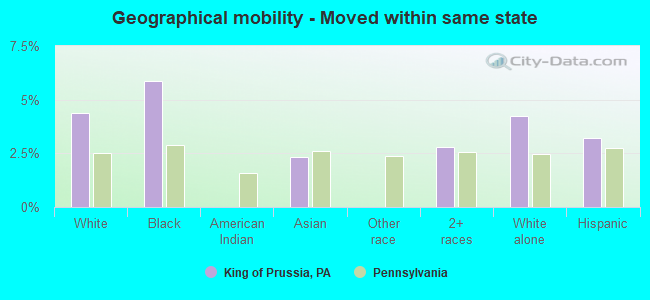
Geographical mobility - Moved within same county (%)
Geographical mobility - Moved within same county (%) - White
Geographical mobility - Moved within same county (%) - Black or African American
Geographical mobility - Moved within same county (%) - Asian
Geographical mobility - Moved within same county (%) - Hispanic or Latino
Geographical mobility - Moved within same county (%) - American Indian and Alaska Native
Geographical mobility - Moved within same county (%) - Multirace
Geographical mobility - Moved within same county (%) - Other Race
Geographical mobility - Moved from different county within same state (%)
Geographical mobility - Moved from different county within same state (%) - White
Geographical mobility - Moved from different county within same state (%) - Black or African American
Geographical mobility - Moved from different county within same state (%) - Asian
Geographical mobility - Moved from different county within same state (%) - Hispanic or Latino
Geographical mobility - Moved from different county within same state (%) - American Indian and Alaska Native
Geographical mobility - Moved from different county within same state (%) - Multirace
Geographical mobility - Moved from different county within same state (%) - Other Race
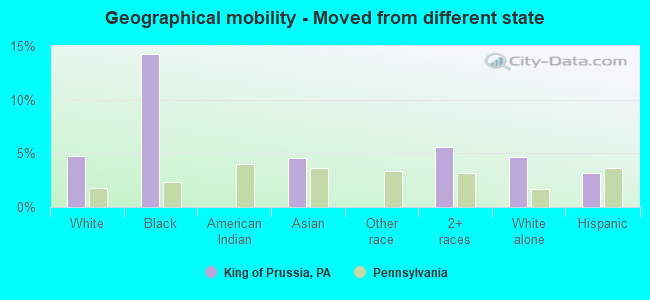
Geographical mobility - Moved from different state (%)
Geographical mobility - Moved from different state (%) - White
Geographical mobility - Moved from different state (%) - Black or African American
Geographical mobility - Moved from different state (%) - Asian
Geographical mobility - Moved from different state (%) - Hispanic or Latino
Geographical mobility - Moved from different state (%) - American Indian and Alaska Native
Geographical mobility - Moved from different state (%) - Multirace
Geographical mobility - Moved from different state (%) - Other Race
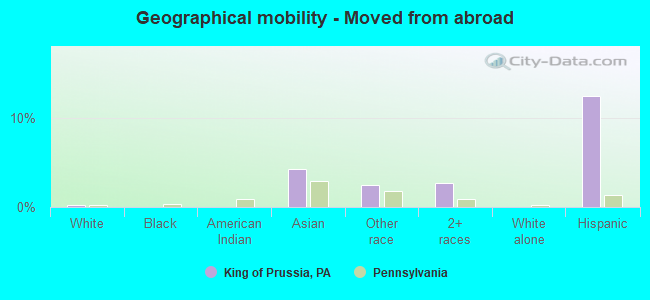
Geographical mobility - Moved from abroad (%)
Geographical mobility - Moved from abroad (%) - White
Geographical mobility - Moved from abroad (%) - Black or African American
Geographical mobility - Moved from abroad (%) - Asian
Geographical mobility - Moved from abroad (%) - Hispanic or Latino
Geographical mobility - Moved from abroad (%) - American Indian and Alaska Native
Geographical mobility - Moved from abroad (%) - Multirace
Geographical mobility - Moved from abroad (%) - Other Race
Place of birth for the foreign-born population - Ireland (%)
Place of birth for the foreign-born population - Denmark (%)
Place of birth for the foreign-born population - Norway (%)
Place of birth for the foreign-born population - Sweden (%)
Place of birth for the foreign-born population - United Kingdom (%)
Place of birth for the foreign-born population - England (%)
Place of birth for the foreign-born population - Scotland (%)
Place of birth for the foreign-born population - Other Northern Europe (%)
Place of birth for the foreign-born population - Austria (%)
Place of birth for the foreign-born population - Belgium (%)
Place of birth for the foreign-born population - France (%)
Place of birth for the foreign-born population - Germany (%)
Place of birth for the foreign-born population - Netherlands (%)
Place of birth for the foreign-born population - Switzerland (%)
Place of birth for the foreign-born population - Other Western Europe (%)
Place of birth for the foreign-born population - Greece (%)
Place of birth for the foreign-born population - Italy (%)
Place of birth for the foreign-born population - Portugal (%)
Place of birth for the foreign-born population - Spain (%)
Place of birth for the foreign-born population - Other Southern Europe (%)
Place of birth for the foreign-born population - Albania (%)
Place of birth for the foreign-born population - Belarus (%)
Place of birth for the foreign-born population - Bosnia and Herzegovina (%)
Place of birth for the foreign-born population - Bulgaria (%)
Place of birth for the foreign-born population - Croatia (%)
Place of birth for the foreign-born population - Czechoslovakia (%)
Place of birth for the foreign-born population - Hungary (%)
Place of birth for the foreign-born population - Latvia (%)
Place of birth for the foreign-born population - Lithuania (%)
Place of birth for the foreign-born population - North Macedonia (Macedonia) (%)
Place of birth for the foreign-born population - Moldova (%)
Place of birth for the foreign-born population - Poland (%)
Place of birth for the foreign-born population - Romania (%)
Place of birth for the foreign-born population - Russia (%)
Place of birth for the foreign-born population - Serbia (%)
Place of birth for the foreign-born population - Ukraine (%)
Place of birth for the foreign-born population - Other Eastern Europe (%)
Place of birth for the foreign-born population - China (%)
Place of birth for the foreign-born population - Hong Kong (%)
Place of birth for the foreign-born population - Taiwan (%)
Place of birth for the foreign-born population - Japan (%)
Place of birth for the foreign-born population - Korea (%)
Place of birth for the foreign-born population - Other Eastern Asia (%)
Place of birth for the foreign-born population - Afghanistan (%)
Place of birth for the foreign-born population - Bangladesh (%)
Place of birth for the foreign-born population - India (%)
Place of birth for the foreign-born population - Iran (%)
Place of birth for the foreign-born population - Kazakhstan (%)
Place of birth for the foreign-born population - Nepal (%)
Place of birth for the foreign-born population - Pakistan (%)
Place of birth for the foreign-born population - Sri Lanka (%)
Place of birth for the foreign-born population - Uzbekistan (%)
Place of birth for the foreign-born population - Other South Central Asia (%)
Place of birth for the foreign-born population - Burma (%)
Place of birth for the foreign-born population - Cambodia (%)
Place of birth for the foreign-born population - Indonesia (%)
Place of birth for the foreign-born population - Laos (%)
Place of birth for the foreign-born population - Malaysia (%)
Place of birth for the foreign-born population - Philippines (%)
Place of birth for the foreign-born population - Singapore (%)
Place of birth for the foreign-born population - Thailand (%)
Place of birth for the foreign-born population - Vietnam (%)
Place of birth for the foreign-born population - Other South Eastern Asia (%)
Place of birth for the foreign-born population - Armenia (%)
Place of birth for the foreign-born population - Iraq (%)
Place of birth for the foreign-born population - Israel (%)
Place of birth for the foreign-born population - Jordan (%)
Place of birth for the foreign-born population - Kuwait (%)
Place of birth for the foreign-born population - Lebanon (%)
Place of birth for the foreign-born population - Saudi Arabia (%)
Place of birth for the foreign-born population - Syria (%)
Place of birth for the foreign-born population - Turkey (%)
Place of birth for the foreign-born population - Yemen (%)
Place of birth for the foreign-born population - Other Western Asia (%)
Place of birth for the foreign-born population - Eritrea (%)
Place of birth for the foreign-born population - Ethiopia (%)
Place of birth for the foreign-born population - Kenya (%)
Place of birth for the foreign-born population - Somalia (%)
Place of birth for the foreign-born population - Uganda (%)
Place of birth for the foreign-born population - Zimbabwe (%)
Place of birth for the foreign-born population - Other Eastern Africa (%)
Place of birth for the foreign-born population - Cameroon (%)
Place of birth for the foreign-born population - Congo (%)
Place of birth for the foreign-born population - Democratic Republic of Congo (Zaire) (%)
Place of birth for the foreign-born population - Other Middle Africa (%)
Place of birth for the foreign-born population - Egypt (%)
Place of birth for the foreign-born population - Morocco (%)
Place of birth for the foreign-born population - Sudan (%)
Place of birth for the foreign-born population - Other Northern Africa (%)
Place of birth for the foreign-born population - South Africa (%)
Place of birth for the foreign-born population - Other Southern Africa (%)
Place of birth for the foreign-born population - Cabo Verde (%)
Place of birth for the foreign-born population - Ghana (%)
Place of birth for the foreign-born population - Liberia (%)
Place of birth for the foreign-born population - Nigeria (%)
Place of birth for the foreign-born population - Senegal (%)
Place of birth for the foreign-born population - Sierra Leone (%)
Place of birth for the foreign-born population - Other Western Africa (%)
Place of birth for the foreign-born population - Australia (%)
Place of birth for the foreign-born population - New Zealand (%)
Place of birth for the foreign-born population - Fiji (%)
Place of birth for the foreign-born population - Micronesia (%)
Place of birth for the foreign-born population - Bahamas (%)
Place of birth for the foreign-born population - Barbados (%)
Place of birth for the foreign-born population - Cuba (%)
Place of birth for the foreign-born population - Dominica (%)
Place of birth for the foreign-born population - Dominican Republic (%)
Place of birth for the foreign-born population - Grenada (%)
Place of birth for the foreign-born population - Haiti (%)
Place of birth for the foreign-born population - Jamaica (%)
Place of birth for the foreign-born population - St. Vincent and the Grenadines (%)
Place of birth for the foreign-born population - Trinidad and Tobago (%)
Place of birth for the foreign-born population - West Indies (%)
Place of birth for the foreign-born population - Other Caribbean (%)
Place of birth for the foreign-born population - Belize (%)
Place of birth for the foreign-born population - Costa Rica (%)
Place of birth for the foreign-born population - El Salvador (%)
Place of birth for the foreign-born population - Guatemala (%)
Place of birth for the foreign-born population - Honduras (%)
Place of birth for the foreign-born population - Mexico (%)
Place of birth for the foreign-born population - Nicaragua (%)
Place of birth for the foreign-born population - Panama (%)
Place of birth for the foreign-born population - Other Central America (%)
Place of birth for the foreign-born population - Argentina (%)
Place of birth for the foreign-born population - Bolivia (%)
Place of birth for the foreign-born population - Brazil (%)
Place of birth for the foreign-born population - Chile (%)
Place of birth for the foreign-born population - Colombia (%)
Place of birth for the foreign-born population - Ecuador (%)
Place of birth for the foreign-born population - Guyana (%)
Place of birth for the foreign-born population - Peru (%)
Place of birth for the foreign-born population - Uruguay (%)
Place of birth for the foreign-born population - Venezuela (%)
Place of birth for the foreign-born population - Other South America (%)
Place of birth for the foreign-born population - Canada (%)
Place of birth for the foreign-born population - Other Northern America (%)
Place of birth for the foreign-born population - Other (%)
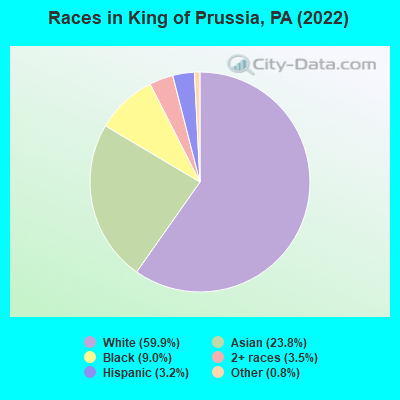
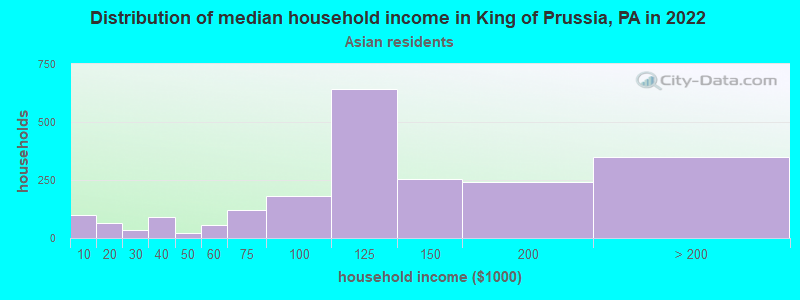
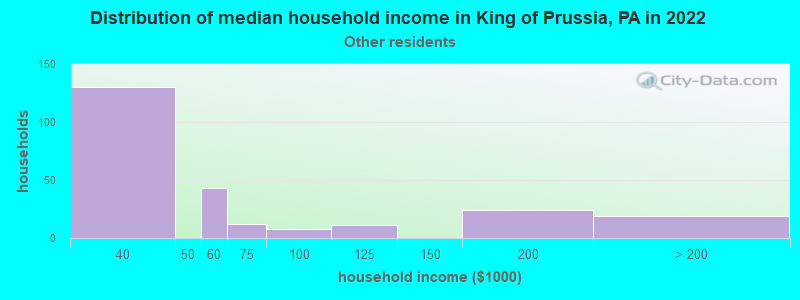
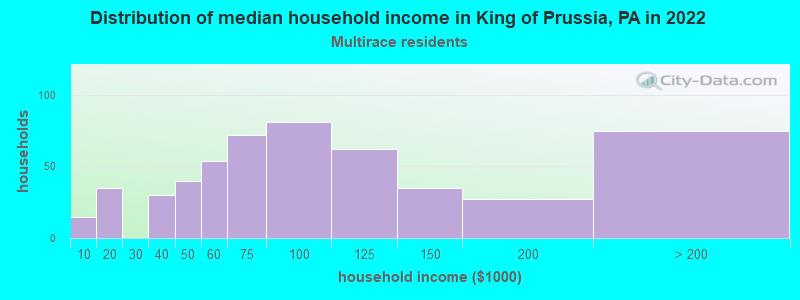
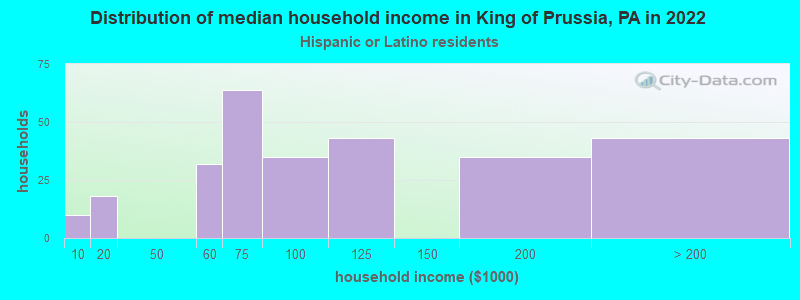
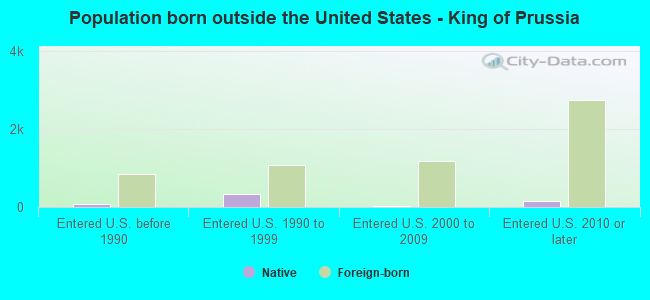
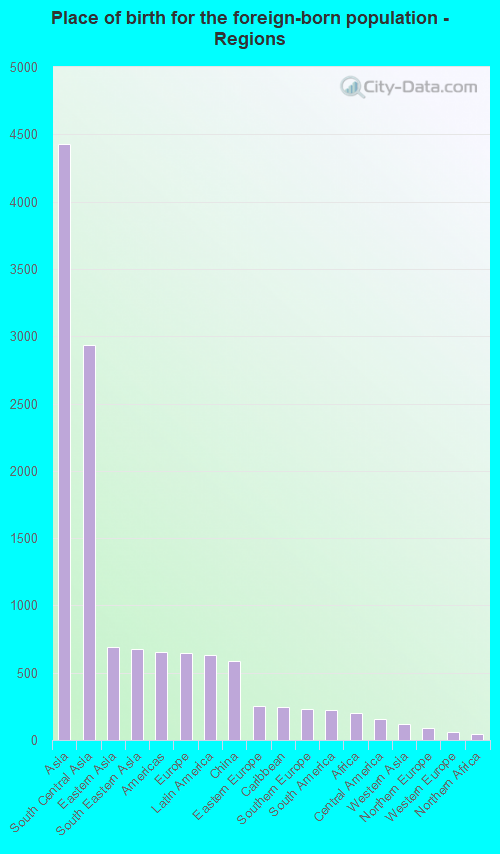
According to 2022 data, the most numerous races in King of Prussia, PA are White alone (14,771 residents), Black alone (2,219 residents), and Hispanic (797 residents). 75.0% of King of Prussia residents speak English at home. 24.0% of King of Prussia, PA residents are foreign-born (17.5% born in Asia, 2.6% born in Europe, 2.5% born in Latin America), which is 70.9% greater than the foreign-born rate of 7.0% across the entire state of Pennsylvania.
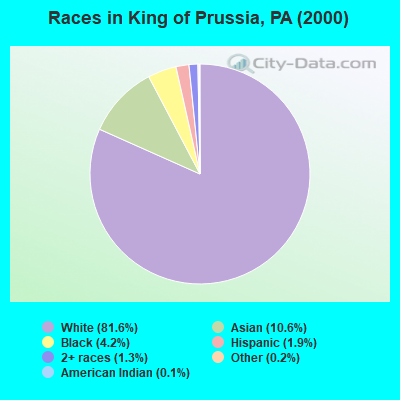
Race distribution in King of Prussia
2000 2022
10,322,455 84.1% White alone 1,202,437 9.8% Black alone 394,088 3.2% Hispanic 218,296 1.8% Asian alone 113,097 0.9% Two or more races 13,086 0.1% Other race alone 14,904 0.1% American Indian alone 2,691 0.02% Native Hawaiian and Other
9,487,228 73.1% White alone 1,311,581 10.1% Black alone 1,115,997 8.6% Hispanic 493,942 3.8% Two or more races 487,124 3.8% Asian alone 63,582 0.5% Other race alone 10,130 0.08% American Indian alone 2,424 0.02% Native Hawaiian and Other
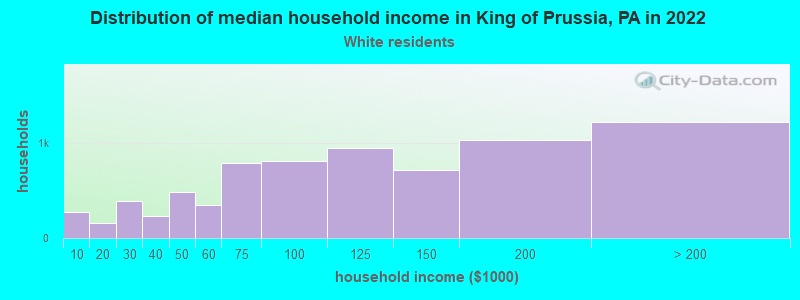
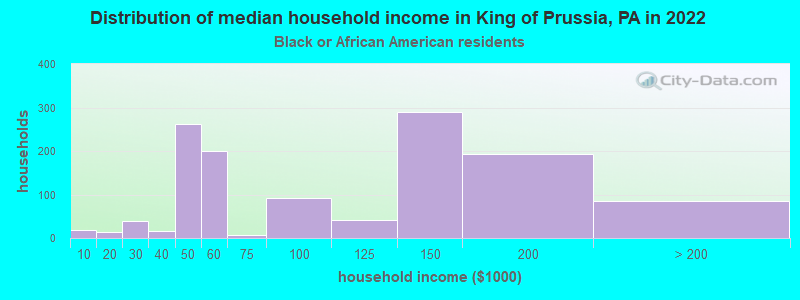
Income and house value in King of Prussia Median household income in 2022 $105,168 White non-Hispanic householders$94,323 Black householders$121,884 Asian householders$59,339 Some other race householders$85,370 Two or more races householders$84,216 Hispanic or Latino race householdersMedian 2022 house value $411,711 White Non-Hispanic householders$415,366 Black or African American householders$391,609 American Indian or Alaska Native householders $434,686 Asian householders$481,418 Native Hawaiian and other Pacific Islander householders$462,360 Some other race householders$333,912 Two or more races householders$375,422 Hispanic or Latino householders
Median age by race in King of Prussia
45.6 Median age for White residents43.0 48.1 34.1 Median age for Black or African American residents33.3 34.7 -626,180,836.1 Median age for American Indian / Alaska Native residents-1,098,934,549.9 -577,519,379.3 33.9 Median age for Asian residents34.2 33.6 -680,432,644.4 Median age for Native Hawaiian / Pacific Islander residents-649,523,808.9 -747,474,746.7 28.2 Median age for Other race residents29.9 34.5 25.9 Median age for Two or more races residents23.7 29.1 45.4 Median age for White alone residents43.0 48.0 30.8 Median age for Hispanic or Latino residents26.8 34.9
Owner/renter occupied households by race in King of Prussia
House owners and renters - White residents 4,065 54.3% Owner occupied3,420 45.7% Renter occupiedHouse owners and renters - Black or African American residents 296 27.4% Owner occupied786 72.6% Renter occupiedHouse owners and renters - American Indian / Alaska Native residents 14 100.0% Renter occupiedHouse owners and renters - Asian residents 859 40.2% Owner occupied1,278 59.8% Renter occupiedHouse owners and renters - Other race residents 175 82.7% Owner occupied37 17.3% Renter occupiedHouse owners and renters - Two or more races residents 243 43.4% Owner occupied317 56.6% Renter occupiedHouse owners and renters - White alone residents 4,080 54.1% Owner occupied3,468 45.9% Renter occupiedHouse owners and renters - Hispanic or Latino residents 131 44.7% Owner occupied162 55.3% Renter occupied
Language usage in King of Prussia
English speakers - Total 75.0% of residents of King of Prussia speak English at home.
2.4% of residents speak Spanish at home 328 59.1% Speak English very well227 40.9% Speak English less than very well22.7% of residents speak other language at home 3,674 70.1% Speak English very well1,567 29.9% Speak English less than very well
English speakers - Born in the United States 92.2% of residents of King of Prussia speak English at home.
2.5% of residents speak Spanish at home 102 76.7% Speak English very well31 23.3% Speak English less than very well5.4% of residents speak other language at home 278 95.9% Speak English very well12 4.1% Speak English less than very well
English speakers - Native, born elsewhere 72.1% of residents of King of Prussia speak English at home.
11.2% of residents speak Spanish at home 49 87.5% Speak English very well7 12.5% Speak English less than very well6.2% of residents speak other language at home 9 29.0% Speak English very well22 71.0% Speak English less than very well
English speakers - Foreign-born 18.2% of residents of King of Prussia speak English at home.
4.4% of residents speak Spanish at home 99 40.4% Speak English very well146 59.6% Speak English less than very well76.5% of residents speak other language at home 2,866 66.8% Speak English very well1,423 33.2% Speak English less than very well
White (Caucasian) - Speak only English Native:
97.0% (12,814)Foreign-born:
25.4% (212)
White (Caucasian) - Speak another language Native:
3.0% (401)Foreign-born:
73.7% (615)
Black or African American - Speak only English Native:
96.8% (1,723)Foreign-born:
86.9% (316)
Black or African American - Speak another language Native:
3.2% (57)Foreign-born:
18.2% (66)
Asian - Speak only English Native:
61.5% (820)Foreign-born:
11.2% (448)
Asian - Speak another language Native:
35.3% (471)Foreign-born:
88.7% (3,535)
Other race - Speak only English Native:
63.5% (155)Foreign-born:
21.3% (45)
Other race - Speak another language Native:
23.6% (58)Foreign-born:
94.5% (198)
Two or more races - Speak only English Native:
82.6% (771)Foreign-born:
39.1% (84)
Two or more races - Speak another language Native:
17.7% (165)Foreign-born:
60.4% (129)
White alone - Speak only English Native:
96.6% (12,757)Foreign-born:
23.6% (212)
White alone - Speak another language Native:
3.4% (452)Foreign-born:
76.9% (689)
Hispanic or Latino - Speak only English Native:
66.6% (262)Foreign-born:
22.2% (67)
Hispanic or Latino - Speak another language Native:
33.7% (132)Foreign-born:
75.0% (226)
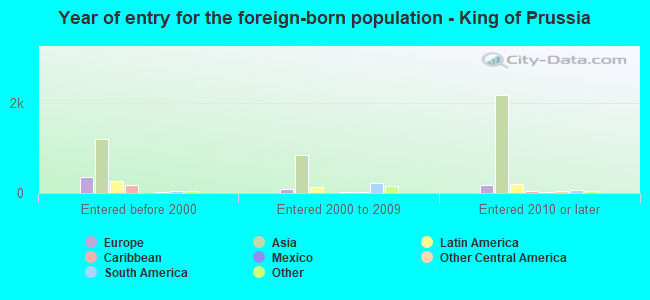
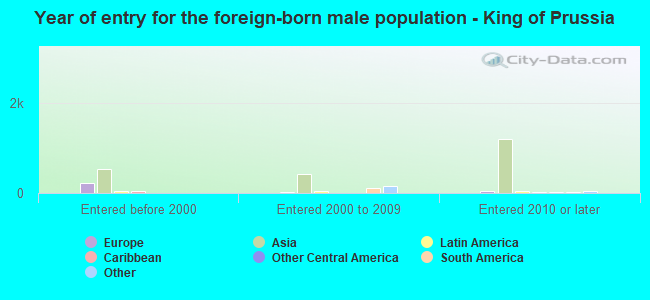
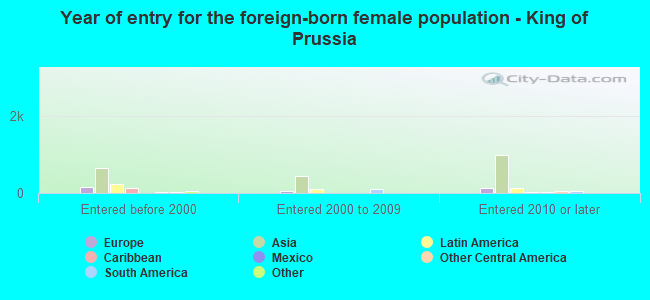
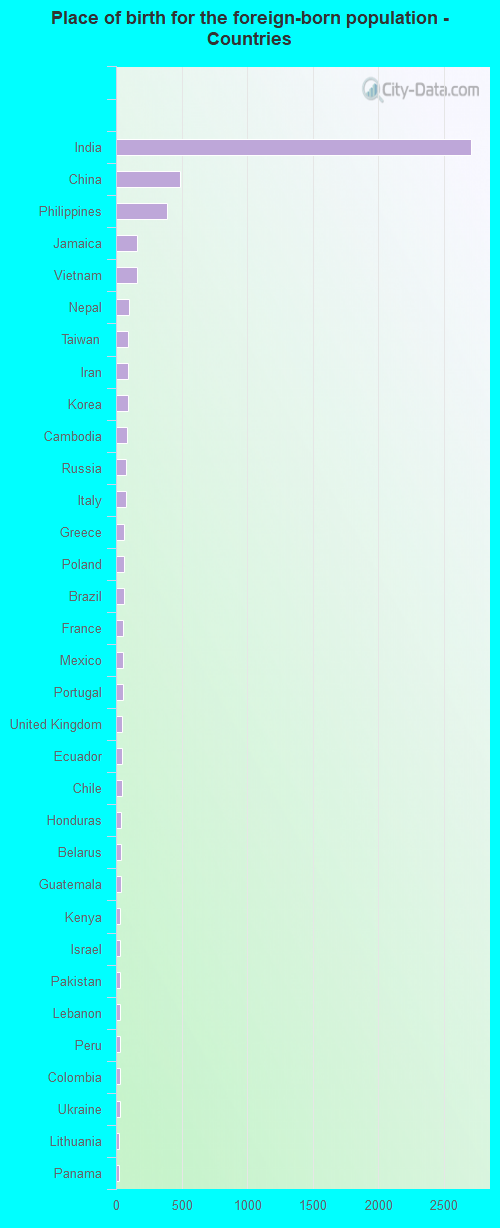
Foreign-born residents in King of Prussia 5,929 residents are foreign born (17.5% Asia , 2.6% Europe , 2.5% Latin America ).
This city:
24.0%Pennsylvania:
7.3%
Marital status for residents in King of Prussia Marital status - White (Caucasian) population 15 years and over
Males 36.7% Never married53.0% Now married2.3% Separated1.7% Widowed6.4% DivorcedFemales 30.5% Never married47.6% Now married0.8% Separated10.4% Widowed10.7% DivorcedWomen who gave birth in the past 12 months Now married:
95.0% (220)Unmarried:
5.0% (12)
Women who did not give birth in the past 12 months Now married:
40.8% (1,208)Unmarried:
59.2% (1,755)
Marital status - Black or African American population 15 years and over
Males 55.2% Never married43.6% Now married0.0% Separated0.9% Widowed0.4% DivorcedFemales 52.3% Never married37.8% Now married0.0% Separated2.2% Widowed7.7% DivorcedWomen who gave birth in the past 12 months Now married:
100.0% (18)Unmarried:
0.0% (0)
Women who did not give birth in the past 12 months Now married:
16.6% (99)Unmarried:
83.4% (499)
Marital status - Asian population 15 years and over
Males 33.7% Never married64.2% Now married0.0% Separated0.6% Widowed1.4% DivorcedFemales 20.3% Never married73.0% Now married0.0% Separated3.1% Widowed3.5% DivorcedWomen who gave birth in the past 12 months Now married:
100.0% (195)Unmarried:
0.0% (0)
Women who did not give birth in the past 12 months Now married:
70.8% (957)Unmarried:
29.2% (395)
Marital status - Other race population 15 years and over
Males 25.6% Never married59.3% Now married0.0% Separated0.0% Widowed15.1% DivorcedFemales 58.5% Never married34.9% Now married0.0% Separated2.2% Widowed4.4% DivorcedWomen who did not give birth in the past 12 months Now married:
28.7% (68)Unmarried:
71.3% (170)
Marital status - Two or more races population 15 years and over
Males 69.5% Never married27.6% Now married0.0% Separated0.0% Widowed2.8% DivorcedFemales 46.5% Never married26.2% Now married0.0% Separated19.2% Widowed8.1% DivorcedWomen who did not give birth in the past 12 months Now married:
25.3% (105)Unmarried:
74.7% (309)
Marital status - White alone, not Hispanic / Latino population 15 years and over
Males 36.2% Never married53.4% Now married2.3% Separated1.7% Widowed6.4% DivorcedFemales 30.3% Never married48.0% Now married0.8% Separated10.3% Widowed10.5% DivorcedWomen who gave birth in the past 12 months Now married:
95.0% (223)Unmarried:
5.0% (12)
Women who did not give birth in the past 12 months Now married:
41.8% (1,222)Unmarried:
58.2% (1,702)
Marital status - Hispanic or Latino population 15 years and over
Males 65.5% Never married34.5% Now married0.0% Separated0.0% Widowed0.0% DivorcedFemales 32.4% Never married26.1% Now married0.0% Separated26.6% Widowed14.9% DivorcedWomen who did not give birth in the past 12 months Now married:
19.1% (42)Unmarried:
80.9% (176)
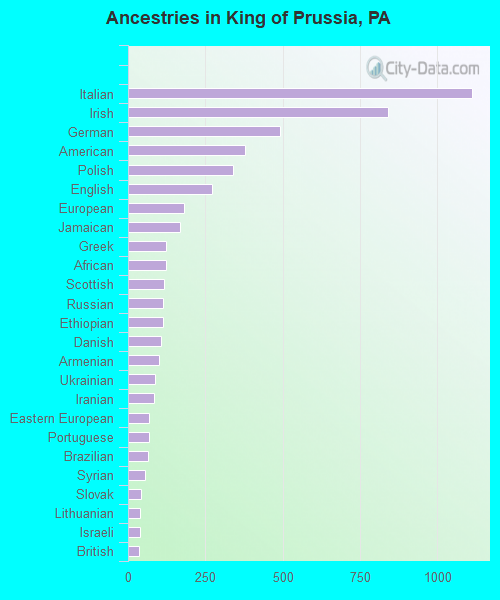
Ancestries in King of Prussia
1,112 8.8% Italian842 6.7% Irish493 3.9% German380 3.0% American338 2.7% Polish273 2.2% English181 1.4% European167 1.3% Jamaican124 1.0% Greek123 1.0% African117 0.9% Scottish114 0.9% Russian112 0.9% Ethiopian108 0.9% Danish100 0.8% Armenian86 0.7% Ukrainian84 0.7% Iranian68 0.5% Eastern European67 0.5% Portuguese65 0.5% Brazilian54 0.4% Syrian43 0.3% Slovak40 0.3% Lithuanian38 0.3% Israeli37 0.3% British36 0.3% French33 0.3% Lebanese32 0.3% Turkish25 0.2% Canadian21 0.2% Scotch-Irish20 0.2% Hungarian19 0.2% Kenyan19 0.2% Liberian18 0.1% Haitian17 0.1% Swedish17 0.1% Bulgarian15 0.1% Croatian10 0.08% Pennsylvania German10 0.08% Trinidadian and Tobagonian9 0.07% Romanian9 0.07% Barbadian8 0.06% Austrian7 0.06% Ghanaian7 0.06% Egyptian6 0.05% Northern European5 0.04% Finnish5 0.04% Dutch5 0.04% Czech4 0.03% Moroccan
Children Nativity (place of birth) in King of Prussia
Children under 6 years - Living with two parents Both parents native 878 99.3% Native7 0.7% Foreign-bornBoth parents foreign-born 353 77.5% Native102 22.5% Foreign-bornOne native, one foreign-born parent 153 100.0% NativeChildren under 6 years - Living with one parent Native parent 292 100.0% NativeForeign-born parent 15 100.0% NativeChildren 6 to 17 years - Living with two parents Both parents native 1,079 100.0% NativeBoth parents foreign-born 308 68.5% Native142 31.5% Foreign-bornOne native, one foreign-born parent 170 100.0% NativeChildren 6 to 17 years - Living with one parent Native parent 238 100.0% NativeForeign-born parent 57 56.2% Native44 43.8% Foreign-born
Grandparents responsible for own grandchildren in King of Prussia
Grandparents (30 to 59 years) White / Caucasian 40 100.0% Not responsible for grandchildrenAsian 64 100.0% Not responsible for grandchildrenWhite alone, not Hispanic / Latino 42 100.0% Not responsible for grandchildrenGrandparents (60 years and over) White / Caucasian 137 68.8% Responsible for grandchildren62 31.2% Not responsible for grandchildrenAsian 53 100.0% Not responsible for grandchildrenWhite alone, not Hispanic / Latino 137 68.5% Responsible for grandchildren63 31.5% Not responsible for grandchildren