Races in Kittrell, Tennessee (TN) Detailed Stats
Ancestries, Foreign-born residents, place of birth
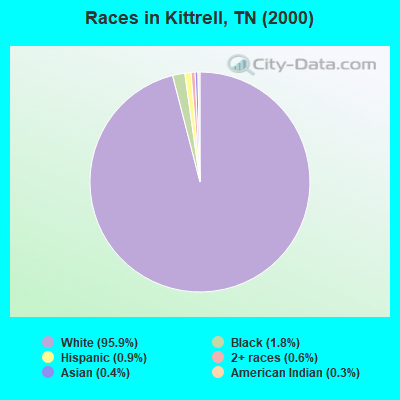
Race distribution in Kittrell

- 4,01195.9%White alone
- 771.8%Black alone
- 360.9%Hispanic
- 260.6%Two or more races
- 170.4%Asian alone
- 120.3%American Indian alone
- 20.05%Native Hawaiian and Other
Pacific Islander alone
2000
2022
-
- 4,505,93079.2%White alone
- 928,20416.3%Black alone
- 123,8382.2%Hispanic
- 54,8241.0%Two or more races
- 56,0771.0%Asian alone
- 13,8200.2%American Indian alone
- 4,7800.08%Other race alone
- 1,8100.03%Native Hawaiian and Other
Pacific Islander alone

-
- 5,070,02671.9%White alone
- 1,089,73815.5%Black alone
- 442,6296.3%Hispanic
- 279,3814.0%Two or more races
- 131,8171.9%Asian alone
- 26,9720.4%Other race alone
- 6,3870.09%American Indian alone
- 4,3890.06%Native Hawaiian and Other
Pacific Islander alone

Income and house value in Kittrell
- Median household income in 2022
- $70,401White non-Hispanic householders
- $157,725Black householders
- $117,285American Indian and Alaska Native householders
- $60,059Asian householders
- $93,512Two or more races householders
- $155,847Hispanic or Latino race householders
- Median 2022 house value
- $354,147White Non-Hispanic householders
- $274,022Black or African American householders
- $294,834American Indian or Alaska Native householders
- $294,834Asian householders
- $390,221Hispanic or Latino householders
Household income for White non-Hispanic householders

Household income for Black householders

Household income for American Indian and Alaska Native householders

Household income for Asian householders

Household income for Two or more races householders

Household income for Hispanic or Latino race householders

Zip code: 37149