Estimated zip code population in 2022: 2,169 Zip code population in 2010: 2,210 Zip code population in 2000: 1,888
Houses and condos: 996 Renter-occupied apartments: 79
% of renters here:
8%
State:
33%
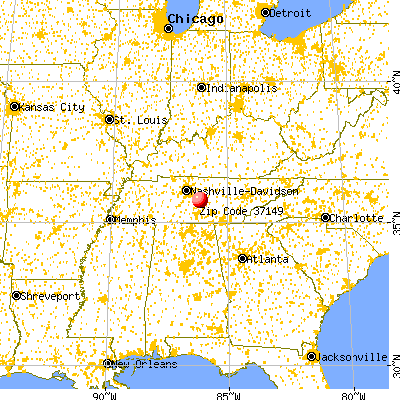
March 2022 cost of living index in zip code 37149: 81.8 (low, U.S. average is 100)
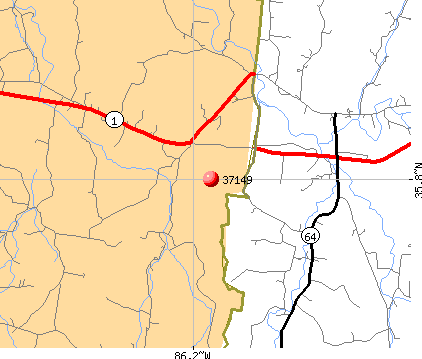
Land area: 65.1 sq. mi. Water area: 0.0 sq. mi.
Population density: 33 people per square mile
(very low).
OSM Map
General Map
Google Map
MSN Map
OSM Map
General Map
Google Map
MSN Map
OSM Map
General Map
Google Map
MSN Map
OSM Map
General Map
Google Map
MSN Map
Please wait while loading the map...
Real estate property taxes paid for housing units in 2022:
This zip code:
0.4% ($1,275)
Tennessee:
0.5% ($1,376)
Median real estate property taxes paid for housing units with mortgages in 2022: $1,377 (0.4%) Median real estate property taxes paid for housing units with no mortgage in 2022: $1,091 (0.5%)
Business Search- 14 Million verified businesses
Males: 1,072
(49.4%)
Females: 1,097
(50.6%)
For population 25 years and over in 37149:
High school or higher: 90.9%
Bachelor's degree or higher: 20.6%
Graduate or professional degree: 5.2%
Unemployed: 5.1%
Mean travel time to work (commute): 35.2 minutes
For population 15 years and over in 37149:
Never married: 22.6%
Now married: 54.1%
Separated: 0.7%
Widowed: 12.2%
Divorced: 10.3%
Zip code 37149 compared to state average:
Black race population percentage significantly below state average.
Hispanic race population percentage significantly below state average.
Median age significantly above state average.
Foreign-born population percentage significantly below state average.
Renting percentage significantly below state average.
Length of stay since moving in significantly above state average.
Averages for the 2020 tax year for zip code 37149, filed in 2021:
Average Adjusted Gross Income (AGI) in 2020: $67,463 (Individual Income Tax Returns)
Here:
$67,463
State:
$69,014
Salary/wage: $55,265 (reported on 78.2% of returns)
Here:
$55,265
State:
$55,872
(% of AGI for various income ranges: 1044.8% for AGIs below $25k, 3650.0% for AGIs $25k-50k, 6205.3% for AGIs $50k-75k, 8557.0% for AGIs $75k-100k, 13381.5% for AGIs $100k-200k)
Taxable interest for individuals: $1,126 (reported on 34.7% of returns)
This zip code:
$1,126
Tennessee:
$1,945
(% of AGI for various income ranges: 14.1% for AGIs below $25k, 43.9% for AGIs $25k-50k, 64.0% for AGIs $50k-75k, 29.0% for AGIs $75k-100k, 57.7% for AGIs $100k-200k)
Ordinary dividends: $4,582 (reported on 13.7% of returns)
Here:
$4,582
State:
$8,105
(% of AGI for various income ranges: 13.0% for AGIs below $25k, 44.8% for AGIs $25k-50k, 26.7% for AGIs $50k-75k, 38.0% for AGIs $75k-100k, 103.8% for AGIs $100k-200k)
Net capital gain/loss in AGI: +$10,550 (reported on 14.5% of returns)
Here:
+$10,550
State:
+$33,664
(% of AGI for various income ranges: 31.1% for AGIs below $25k, 40.0% for AGIs $25k-50k, 182.7% for AGIs $50k-75k, 288.5% for AGIs $100k-200k)
Profit/loss from business: +$22,784 (reported on 20.2% of returns)
Here:
+$22,784
State:
+$18,991
(% of AGI for various income ranges: 235.2% for AGIs below $25k, 413.0% for AGIs $25k-50k, 623.3% for AGIs $50k-75k, 671.0% for AGIs $75k-100k, 1926.9% for AGIs $100k-200k)
Taxable individual retirement arrangement distribution: $16,173 (reported on 8.9% of returns)
37149:
$16,173
Tennessee:
$20,036
(% of AGI for various income ranges: 172.6% for AGIs below $25k, 357.3% for AGIs $50k-75k, 597.7% for AGIs $100k-200k)
Total itemized deductions: $46,125 (reported on 3.2% of returns)
Here:
$46,125
State:
$40,136
(% of AGI for various income ranges: 1419.2% for AGIs $100k-200k)
Charity contributions: $26,967 (reported on 2.4% of returns)
Here:
$26,967
State:
$19,852
(% of AGI for various income ranges: 622.3% for AGIs $100k-200k)
Taxes paid: $5,675 (reported on 3.2% of returns)
37149:
$5,675
State:
$6,038
(% of AGI for various income ranges: 174.6% for AGIs $100k-200k)
Earned income credit: $2,088 (reported on 13.7% of returns)
Here:
$2,088
State:
$2,391
(% of AGI for various income ranges: 81.5% for AGIs below $25k, 58.7% for AGIs $25k-50k)
Percentage of individuals using paid preparers for their 2020 taxes: 94.4%
Here:
94%
State:
93%
(% for various income ranges: 92.1% for AGIs below $25k, 93.5% for AGIs $25k-50k, 95.0% for AGIs $50k-75k, 100.0% for AGIs $75k-100k, 94.4% for AGIs $100k-200k, 100.0% for AGIs over 200k)
Averages for the 2012 tax year for zip code 37149, filed in 2013:
Average Adjusted Gross Income (AGI) in 2012: $49,405 (Individual Income Tax Returns)
Here:
$49,405
State:
$53,767
Salary/wage: $42,668 (reported on 83.3% of returns)
Here:
$42,668
State:
$45,421
(% of AGI for various income ranges: 67.4% for AGIs below $25k, 80.3% for AGIs $25k-50k, 75.8% for AGIs $50k-75k, 80.3% for AGIs $75k-100k, 61.8% for AGIs $100k-200k)
Taxable interest for individuals: $1,064 (reported on 35.3% of returns)
This zip code:
$1,064
Tennessee:
$1,732
(% of AGI for various income ranges: 2.1% for AGIs below $25k, 0.6% for AGIs $25k-50k, 0.5% for AGIs $50k-75k, 0.8% for AGIs $75k-100k, 0.6% for AGIs $100k-200k)
Ordinary dividends: $6,100 (reported on 11.8% of returns)
Here:
$6,100
State:
$6,739
(% of AGI for various income ranges: 0.1% for AGIs below $25k, 0.3% for AGIs $25k-50k, 0.9% for AGIs $50k-75k, 3.5% for AGIs $100k-200k)
Net capital gain/loss in AGI: +$8,056 (reported on 8.8% of returns)
Here:
+$8,056
State:
+$19,082
(% of AGI for various income ranges: 2.2% for AGIs $50k-75k, 2.9% for AGIs $100k-200k)
Profit/loss from business: +$9,238 (reported on 20.6% of returns)
Here:
+$9,238
State:
+$15,240
(% of AGI for various income ranges: 12.9% for AGIs below $25k, 5.5% for AGIs $25k-50k, 4.1% for AGIs $50k-75k, 1.6% for AGIs $75k-100k, 1.5% for AGIs $100k-200k)
Taxable individual retirement arrangement distribution: $12,630 (reported on 9.8% of returns)
37149:
$12,630
Tennessee:
$15,505
(% of AGI for various income ranges: 3.8% for AGIs below $25k, 2.9% for AGIs $25k-50k, 2.2% for AGIs $50k-75k, 6.8% for AGIs $75k-100k)
Total itemized deductions: $17,052 (18% of AGI, reported on 20.6% of returns)
Here:
$17,052
State:
$21,976
Here:
18.4% of AGI
State:
17.8% of AGI
(% of AGI for various income ranges: 8.1% for AGIs $25k-50k, 7.9% for AGIs $50k-75k, 8.3% for AGIs $75k-100k, 7.3% for AGIs $100k-200k)
Charity contributions: $4,312 (reported on 15.7% of returns)
Here:
$4,312
State:
$6,709
(% of AGI for various income ranges: 1.2% for AGIs $25k-50k, 1.5% for AGIs $50k-75k, 1.3% for AGIs $75k-100k, 1.8% for AGIs $100k-200k)
Taxes paid: $3,414 (reported on 20.6% of returns)
37149:
$3,414
State:
$4,829
(% of AGI for various income ranges: 1.4% for AGIs $25k-50k, 1.4% for AGIs $50k-75k, 1.5% for AGIs $75k-100k, 1.8% for AGIs $100k-200k)
Earned income credit: $1,884 (reported on 18.6% of returns)
Here:
$1,884
State:
$2,404
(% of AGI for various income ranges: 5.7% for AGIs below $25k, 1.1% for AGIs $25k-50k)
Percentage of individuals using paid preparers for their 2012 taxes: 62.7%
Here:
63%
State:
52%
(% for various income ranges: 55.3% for AGIs below $25k, 64.3% for AGIs $25k-50k, 68.8% for AGIs $50k-75k, 70.0% for AGIs $75k-100k, 70.0% for AGIs $100k-200k)
Averages for the 2004 tax year for zip code 37149, filed in 2005:
Average Adjusted Gross Income (AGI) in 2004: $42,472 (Individual Income Tax Returns)
Here:
$42,472
State:
$44,088
Salary/wage: $40,530 (reported on 84.5% of returns)
Here:
$40,530
State:
$38,825
(% of AGI for various income ranges: 106.8% for AGIs below $10k, 74.4% for AGIs $10k-25k, 82.7% for AGIs $25k-50k, 84.6% for AGIs $50k-75k, 89.8% for AGIs $75k-100k, 68.4% for AGIs over 100k)
Taxable interest for individuals: $982 (reported on 43.2% of returns)
This zip code:
$982
Tennessee:
$1,802
(% of AGI for various income ranges: 7.8% for AGIs below $10k, 2.7% for AGIs $10k-25k, 1.0% for AGIs $25k-50k, 0.8% for AGIs $50k-75k, 0.1% for AGIs $75k-100k, 0.7% for AGIs over 100k)
Taxable dividends: $1,790 (reported on 15.9% of returns)
Here:
$1,790
State:
$3,727
(% of AGI for various income ranges: 2.9% for AGIs below $10k, 0.3% for AGIs $10k-25k, 0.6% for AGIs $25k-50k, 0.3% for AGIs $50k-75k, 1.5% for AGIs over 100k)
Net capital gain/loss: +$4,992 (reported on 14.2% of returns)
Here:
+$4,992
State:
+$15,776
(% of AGI for various income ranges: 0.0% for AGIs $10k-25k, 0.8% for AGIs $25k-50k, 0.4% for AGIs $50k-75k, 0.1% for AGIs $75k-100k, 5.6% for AGIs over 100k)
Profit/loss from business: +$10,005 (reported on 21.8% of returns)
Here:
+$10,005
State:
+$12,882
(% of AGI for various income ranges: 15.1% for AGIs below $10k, 13.0% for AGIs $10k-25k, 4.4% for AGIs $25k-50k, 6.3% for AGIs $50k-75k, 0.1% for AGIs $75k-100k, 4.7% for AGIs over 100k)
IRA payment deduction: $3,190 (reported on 2.3% of returns)
37149:
$3,190
Tennessee:
$2,934
Total itemized deductions: $15,420 (19% of AGI, reported on 24.8% of returns)
Here:
$15,420
State:
$18,035
Here:
19.2% of AGI
State:
19.9% of AGI
(% of AGI for various income ranges: 11.7% for AGIs $10k-25k, 8.1% for AGIs $25k-50k, 8.8% for AGIs $50k-75k, 11.0% for AGIs $75k-100k, 8.5% for AGIs over 100k)
Charity contributions deductions: $4,538 (6% of AGI, reported on 20.4% of returns)
Here:
$4,538
State:
$5,167
Here:
5.6% of AGI
State:
5.3% of AGI
(% of AGI for various income ranges: 1.8% for AGIs $10k-25k, 1.3% for AGIs $25k-50k, 2.2% for AGIs $50k-75k, 2.3% for AGIs $75k-100k, 3.3% for AGIs over 100k)
Total tax: $6,143 (reported on 76.8% of returns)
37149:
$6,143
State:
$7,482
(% of AGI for various income ranges: 4.2% for AGIs below $10k, 5.6% for AGIs $10k-25k, 6.9% for AGIs $25k-50k, 9.4% for AGIs $50k-75k, 10.4% for AGIs $75k-100k, 20.0% for AGIs over 100k)
Earned income credit: $1,522 (reported on 15.3% of returns)
Here:
$1,522
State:
$1,826
Percentage of individuals using paid preparers for their 2004 taxes: 67.1%
Here:
67%
State:
60%
(% for various income ranges: 62.8% for AGIs below $10k, 70.7% for AGIs $10k-25k, 72.2% for AGIs $25k-50k, 66.2% for AGIs $50k-75k, 55.6% for AGIs $75k-100k, 61.7% for AGIs over 100k)
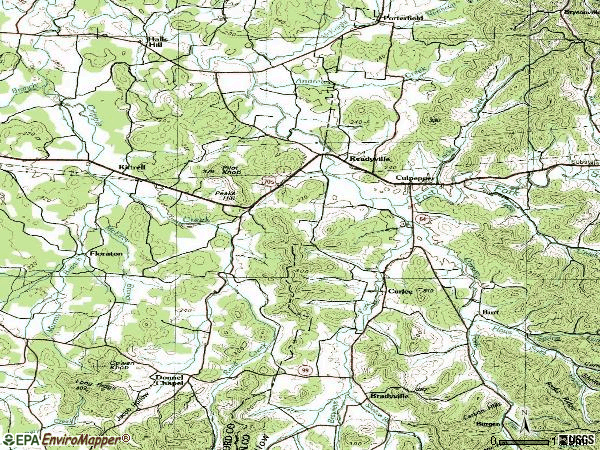
Notable locations in zip code 37149: Adams Poultry Farm (A), Readyville Mill (B), The Corners (C), Kittrell Volunteer Fire Department (D), West Side Volunteer Fire Department (E). Display/hide their locations on the map
Churches in zip code 37149 include: Curlee Church of Christ (A), Rock Hill Church (B), Cripple Creek Church (C), Thyatira Church (D), Wilson Hill Church (E), Science Hill Church (F), Hickory Grove Church (G), New Hope Church (H). Display/hide their locations on the map
Cemeteries: Youree Cemetery (1), Wilson Cemetery (2), Smith Cemetery (3), Sagely Cemetery (4), Ring Cemetery (5), Richardson Cemetery (6), Ready Cemetery (7). Display/hide their locations on the map
Streams, rivers, and creeks: Locke Creek (A), Andrews Creek (B), Carson Fork (C), Brawleys Fork (D), Northcutt Branch (E), Murray Branch (F), Reed Creek (G). Display/hide their locations on the map
Size of family households: 262 2-persons, 274 3-persons, 80 4-persons, 13 5-persons
Size of nonfamily households: 281 1-person, 43 2-persons
271 married couples with children.
0 single-parent households ().
98.9% of residents of 37149 zip code speak English at home.
1.1% of residents speak Spanish at home (61% very well, 39% well).
Foreign born population: 18 (0.9%) (49.6% of them are naturalized citizens)
This zip code:
0.9%
Whole state:
5.6%
44%Denmark
44%Honduras
33%American
32%English
10%German
10%European
1%Swedish
0%Finnish
Year of entry for the foreign-born population
02010 or later
92000 to 2009
01990 to 1999
12Before 1990
Housing units lacking complete plumbing facilities: 2.6% Housing units lacking complete kitchen facilities: 2.6%
70.4%Electricity
18.5%Utility gas
7.8%Bottled, tank, or LP gas
2.0%Wood
1.5%Fuel oil, kerosene, etc.
Population in 1990: 4,572.
Place of birth for U.S.-born residents:
This state: 1,388
Northeast: 72
Midwest: 297
South: 334
West: 37
69% of the 37149 zip code residents lived in the same house 5 years ago. Out of people who lived in different houses, 52% lived in this county. Out of people who lived in different counties, 50% lived in Tennessee.
95% of the 37149 zip code residents lived in the same house 1 year ago. Out of people who lived in different houses, 100% moved from different county within same state. Out of people who lived in different houses, 12% moved from different state.
Private vs. public school enrollment:
Students in private schools in grades 1 to 8 (elementary and middle school): 57
Here:
44.2%
Tennessee:
15.0%
Students in private schools in grades 9 to 12 (high school): 25
Here:
32.6%
Tennessee:
16.2%
Students in private undergraduate colleges:
Here:
0.0%
Tennessee:
23.5%
Occupation by median earnings in the past 12 months ($)
103,433Architecture and engineering occupations
85,048Production occupations
61,274Computer and mathematical occupations
60,502Business and financial operations occupations
58,986Management occupations
46,402Office and administrative support occupations
Top industries in this zip code by the number of employees in 2005:
Administrative and Support and Waste Management and Remediation Services: All Other Support Services (20-49 employees: 1 establishment)
Construction: Site Preparation Contractors (10-19: 1)
Mining: Crushed and Broken Limestone Mining and Quarrying (10-19: 1)
Health Care and Social Assistance: Other Individual and Family Services (5-9: 1)
Wholesale Trade: Farm and Garden Machinery and Equipment Merchant Wholesalers (5-9: 1)
Construction: Masonry Contractors (5-9: 1)
Construction: Electrical Contractors (1-4: 2)
Construction: Painting and Wall Covering Contractors (1-4: 2)
Other Services (except Public Administration): Commercial and Industrial Machinery and Equipment (except Automotive and Electronic) Repair and Maintenance (1-4: 1)
Fatal accident statistics in 2012:
Fatal accident count: 2
Vehicles involved in fatal accidents: 4
Fatal accidents caused by drunken drivers: 0
Fatalities: 2
Persons involved in fatal accidents: 4
Pedestrians involved in fatal accidents: 0
Fatal accident statistics in 2010:
Fatal accident count: 1
Vehicles involved in fatal accidents: 1
Fatal accidents caused by drunken drivers: 0
Fatalities: 1
Persons involved in fatal accidents: 2
Pedestrians involved in fatal accidents: 0
Home Mortgage Disclosure Act Aggregated Statistics For Year 2009 (Based on 2 partial tracts)
A) FHA, FSA/RHS & VA Home Purchase Loans
B) Conventional Home Purchase Loans
C) Refinancings
D) Home Improvement Loans
F) Non-occupant Loans on < 5 Family Dwellings (A B C & D)
G) Loans On Manufactured Home Dwelling (A B C & D)
Number
Average Value
Number
Average Value
Number
Average Value
Number
Average Value
Number
Average Value
Number
Average Value
LOANS ORIGINATED
12
$162,217
12
$132,859
72
$159,864
8
$47,302
4
$69,228
4
$94,048
APPLICATIONS APPROVED, NOT ACCEPTED
0
$0
1
$45,530
7
$147,574
2
$36,575
0
$0
1
$45,530
APPLICATIONS DENIED
1
$113,450
4
$184,920
27
$165,480
1
$63,440
1
$73,150
4
$69,042
APPLICATIONS WITHDRAWN
2
$108,230
6
$125,520
19
$163,029
0
$0
1
$138,080
1
$179,880
FILES CLOSED FOR INCOMPLETENESS
0
$0
0
$0
6
$175,155
0
$0
0
$0
0
$0
Aggregated Statistics For Year 2008 (Based on 2 partial tracts)
A) FHA, FSA/RHS & VA Home Purchase Loans
B) Conventional Home Purchase Loans
C) Refinancings
D) Home Improvement Loans
F) Non-occupant Loans on < 5 Family Dwellings (A B C & D)
G) Loans On Manufactured Home Dwelling (A B C & D)
Number
Average Value
Number
Average Value
Number
Average Value
Number
Average Value
Number
Average Value
Number
Average Value
LOANS ORIGINATED
8
$149,374
23
$143,049
57
$162,990
7
$74,533
9
$86,333
9
$82,104
APPLICATIONS APPROVED, NOT ACCEPTED
1
$16,420
2
$194,065
8
$151,146
6
$36,573
1
$89,570
1
$16,420
APPLICATIONS DENIED
0
$0
4
$229,145
28
$190,065
11
$34,470
0
$0
5
$127,486
APPLICATIONS WITHDRAWN
1
$273,180
1
$101,510
22
$162,647
1
$16,420
1
$90,310
0
$0
FILES CLOSED FOR INCOMPLETENESS
0
$0
0
$0
1
$207,500
0
$0
0
$0
0
$0
Aggregated Statistics For Year 2007 (Based on 2 partial tracts)
A) FHA, FSA/RHS & VA Home Purchase Loans
B) Conventional Home Purchase Loans
C) Refinancings
D) Home Improvement Loans
F) Non-occupant Loans on < 5 Family Dwellings (A B C & D)
G) Loans On Manufactured Home Dwelling (A B C & D)
Number
Average Value
Number
Average Value
Number
Average Value
Number
Average Value
Number
Average Value
Number
Average Value
LOANS ORIGINATED
10
$125,992
50
$158,162
50
$145,682
8
$27,990
7
$217,309
11
$90,043
APPLICATIONS APPROVED, NOT ACCEPTED
0
$0
8
$143,122
11
$102,732
4
$18,848
1
$151,520
7
$76,453
APPLICATIONS DENIED
1
$213,470
12
$108,539
40
$172,362
12
$62,698
3
$743,663
7
$103,323
APPLICATIONS WITHDRAWN
1
$97,030
15
$149,031
18
$127,634
2
$51,500
3
$126,390
1
$76,130
FILES CLOSED FOR INCOMPLETENESS
0
$0
2
$172,420
5
$152,564
0
$0
0
$0
0
$0
Aggregated Statistics For Year 2006 (Based on 2 partial tracts)
A) FHA, FSA/RHS & VA Home Purchase Loans
B) Conventional Home Purchase Loans
C) Refinancings
D) Home Improvement Loans
F) Non-occupant Loans on < 5 Family Dwellings (A B C & D)
G) Loans On Manufactured Home Dwelling (A B C & D)
Number
Average Value
Number
Average Value
Number
Average Value
Number
Average Value
Number
Average Value
Number
Average Value
LOANS ORIGINATED
7
$131,580
71
$122,735
49
$121,282
13
$66,085
10
$130,396
8
$77,066
APPLICATIONS APPROVED, NOT ACCEPTED
1
$95,540
7
$95,646
8
$106,269
2
$52,250
2
$83,970
3
$47,273
APPLICATIONS DENIED
0
$0
18
$128,837
44
$93,673
7
$47,876
4
$75,945
7
$86,369
APPLICATIONS WITHDRAWN
1
$194,060
6
$118,055
28
$125,449
3
$95,540
2
$163,090
1
$76,880
FILES CLOSED FOR INCOMPLETENESS
0
$0
2
$116,065
11
$146,498
0
$0
0
$0
0
$0
Aggregated Statistics For Year 2005 (Based on 2 partial tracts)
A) FHA, FSA/RHS & VA Home Purchase Loans
B) Conventional Home Purchase Loans
C) Refinancings
D) Home Improvement Loans
F) Non-occupant Loans on < 5 Family Dwellings (A B C & D)
G) Loans On Manufactured Home Dwelling (A B C & D)
Number
Average Value
Number
Average Value
Number
Average Value
Number
Average Value
Number
Average Value
Number
Average Value
LOANS ORIGINATED
5
$136,292
40
$145,958
70
$116,278
11
$25,717
6
$139,825
11
$77,151
APPLICATIONS APPROVED, NOT ACCEPTED
0
$0
12
$77,439
9
$109,058
2
$24,630
1
$173,910
2
$59,710
APPLICATIONS DENIED
1
$69,420
12
$73,396
71
$115,566
6
$33,962
1
$123,900
13
$67,578
APPLICATIONS WITHDRAWN
2
$114,200
7
$108,229
44
$126,006
3
$168,687
0
$0
4
$72,960
FILES CLOSED FOR INCOMPLETENESS
0
$0
1
$190,330
3
$179,633
1
$101,510
0
$0
1
$76,130
Aggregated Statistics For Year 2004 (Based on 2 partial tracts)
A) FHA, FSA/RHS & VA Home Purchase Loans
B) Conventional Home Purchase Loans
C) Refinancings
D) Home Improvement Loans
F) Non-occupant Loans on < 5 Family Dwellings (A B C & D)
G) Loans On Manufactured Home Dwelling (A B C & D)
Number
Average Value
Number
Average Value
Number
Average Value
Number
Average Value
Number
Average Value
Number
Average Value
LOANS ORIGINATED
9
$120,917
40
$119,779
71
$105,999
10
$47,620
11
$69,008
8
$65,404
APPLICATIONS APPROVED, NOT ACCEPTED
0
$0
7
$75,280
25
$97,122
3
$50,257
2
$95,910
7
$54,380
APPLICATIONS DENIED
3
$96,287
16
$72,261
57
$102,244
5
$33,438
1
$69,420
14
$72,028
APPLICATIONS WITHDRAWN
0
$0
9
$118,512
30
$134,850
1
$2,240
1
$130,620
0
$0
FILES CLOSED FOR INCOMPLETENESS
0
$0
2
$193,320
5
$174,060
1
$74,640
0
$0
0
$0
Aggregated Statistics For Year 2003 (Based on 2 partial tracts)
A) FHA, FSA/RHS & VA Home Purchase Loans
B) Conventional Home Purchase Loans
C) Refinancings
D) Home Improvement Loans
F) Non-occupant Loans on < 5 Family Dwellings (A B C & D)
Number
Average Value
Number
Average Value
Number
Average Value
Number
Average Value
Number
Average Value
LOANS ORIGINATED
10
$130,247
32
$87,072
121
$114,341
9
$17,084
8
$71,095
APPLICATIONS APPROVED, NOT ACCEPTED
0
$0
1
$66,430
19
$102,217
1
$7,460
0
$0
APPLICATIONS DENIED
4
$110,280
10
$55,010
55
$94,196
6
$18,412
4
$42,358
APPLICATIONS WITHDRAWN
1
$78,370
6
$208,495
37
$112,444
0
$0
1
$162,720
FILES CLOSED FOR INCOMPLETENESS
0
$0
4
$112,332
4
$139,578
0
$0
0
$0
Aggregated Statistics For Year 2002 (Based on 2 partial tracts)
A) FHA, FSA/RHS & VA Home Purchase Loans
B) Conventional Home Purchase Loans
C) Refinancings
D) Home Improvement Loans
F) Non-occupant Loans on < 5 Family Dwellings (A B C & D)
Number
Average Value
Number
Average Value
Number
Average Value
Number
Average Value
Number
Average Value
LOANS ORIGINATED
11
$110,806
25
$123,276
102
$105,272
7
$42,864
6
$59,712
APPLICATIONS APPROVED, NOT ACCEPTED
0
$0
4
$94,605
19
$93,339
1
$105,240
1
$39,560
APPLICATIONS DENIED
1
$195,560
16
$72,774
49
$91,228
9
$18,992
0
$0
APPLICATIONS WITHDRAWN
1
$141,070
5
$117,484
19
$106,735
0
$0
1
$53,740
FILES CLOSED FOR INCOMPLETENESS
0
$0
2
$161,595
3
$91,560
1
$44,780
0
$0
Aggregated Statistics For Year 2001 (Based on 2 partial tracts)
A) FHA, FSA/RHS & VA Home Purchase Loans
B) Conventional Home Purchase Loans
C) Refinancings
D) Home Improvement Loans
F) Non-occupant Loans on < 5 Family Dwellings (A B C & D)
Number
Average Value
Number
Average Value
Number
Average Value
Number
Average Value
Number
Average Value
LOANS ORIGINATED
16
$91,528
24
$77,439
87
$94,801
10
$17,018
8
$59,712
APPLICATIONS APPROVED, NOT ACCEPTED
1
$79,120
8
$68,575
14
$83,117
1
$12,690
1
$9,700
APPLICATIONS DENIED
1
$146,290
24
$63,164
57
$83,492
10
$8,360
1
$4,480
APPLICATIONS WITHDRAWN
1
$14,930
4
$67,550
26
$85,692
1
$5,970
2
$56,725
FILES CLOSED FOR INCOMPLETENESS
0
$0
1
$8,210
6
$90,065
0
$0
0
$0
Aggregated Statistics For Year 2000 (Based on 2 partial tracts)
A) FHA, FSA/RHS & VA Home Purchase Loans
B) Conventional Home Purchase Loans
C) Refinancings
D) Home Improvement Loans
F) Non-occupant Loans on < 5 Family Dwellings (A B C & D)
Number
Average Value
Number
Average Value
Number
Average Value
Number
Average Value
Number
Average Value
LOANS ORIGINATED
5
$116,588
32
$77,836
31
$88,797
13
$17,512
4
$57,845
APPLICATIONS APPROVED, NOT ACCEPTED
0
$0
12
$63,071
17
$91,236
4
$11,195
1
$70,910
APPLICATIONS DENIED
1
$97,780
30
$74,391
32
$102,980
8
$17,540
3
$130,370
APPLICATIONS WITHDRAWN
1
$96,290
4
$95,912
19
$82,418
1
$26,870
0
$0
FILES CLOSED FOR INCOMPLETENESS
0
$0
0
$0
7
$115,586
0
$0
0
$0
Aggregated Statistics For Year 1999 (Based on 1 partial tract)
A) FHA, FSA/RHS & VA Home Purchase Loans
B) Conventional Home Purchase Loans
C) Refinancings
D) Home Improvement Loans
F) Non-occupant Loans on < 5 Family Dwellings (A B C & D)
Detailed PMIC statistics for the following Tracts:0406.00
2002 - 2018 National Fire Incident Reporting System (NFIRS) incidents
According to the data from the years 2002 - 2018 the average number of fire incidents per year is 14. The highest number of reported fires - 36 took place in 2014, and the least - 0 in 2003. The data has an increasing trend.
When looking into fire subcategories, the most reports belonged to: Outside Fires (51.7%), and Structure Fires (23.7%).
Fire incident types reported to NFIRS in Zip Code 37149


 Nearest zip codes: 37118, 37127, 37026, 37130, 37190, 37018.


 According to the data from the years 2002 - 2018 the average number of fire incidents per year is 14. The highest number of reported fires - 36 took place in 2014, and the least - 0 in 2003. The data has an increasing trend.
 When looking into fire subcategories, the most reports belonged to: Outside Fires (51.7%), and Structure Fires (23.7%).