Races in Lakeside, Florida (FL) Detailed Stats
Data:
Races - White alone (%)
Races - White alone (% change since 2000)
Races - Black alone (%)
Races - Black alone (% change since 2000)
Races - American Indian alone (%)
Races - American Indian alone (% change since 2000)
Races - Asian alone (%)
Races - Asian alone (% change since 2000)
Races - Hispanic (%)
Races - Hispanic (% change since 2000)
Races - Native Hawaiian and Other Pacific Islander alone (%)
Races - Native Hawaiian and Other Pacific Islander alone (% change since 2000)
Races - Two or more races(%)
Races - Two or more races(% change since 2000)
Races - Other race alone (%)
Races - Other race alone (% change since 2000)
Racial diversity
Place of birth - Born in state of residence (%)
Place of birth - Born in state of residence (%) - White
Place of birth - Born in state of residence (%) - Black or African American
Place of birth - Born in state of residence (%) - Asian
Place of birth - Born in state of residence (%) - Hispanic or Latino
Place of birth - Born in state of residence (%) - American Indian and Alaska Native
Place of birth - Born in state of residence (%) - Multirace
Place of birth - Born in state of residence (%) - Other Race
Place of birth - Born in other state (%)
Place of birth - Born in other state (%) - White
Place of birth - Born in other state (%) - Black or African American
Place of birth - Born in other state (%) - Asian
Place of birth - Born in other state (%) - Hispanic or Latino
Place of birth - Born in other state (%) - American Indian and Alaska Native
Place of birth - Born in other state (%) - Multirace
Place of birth - Born in other state (%) - Other Race
Place of birth - Native, outside of US (%)
Place of birth - Native, outside of US (%) - White
Place of birth - Native, outside of US (%) - Black or African American
Place of birth - Native, outside of US (%) - Asian
Place of birth - Native, outside of US (%) - Hispanic or Latino
Place of birth - Native, outside of US (%) - American Indian and Alaska Native
Place of birth - Native, outside of US (%) - Multirace
Place of birth - Native, outside of US (%) - Other Race
Place of birth - Foreign born (%)
Place of birth - Foreign born (%) - White
Place of birth - Foreign born (%) - Black or African American
Place of birth - Foreign born (%) - Asian
Place of birth - Foreign born (%) - Hispanic or Latino
Place of birth - Foreign born (%) - American Indian and Alaska Native
Place of birth - Foreign born (%) - Multirace
Place of birth - Foreign born (%) - Other Race
Residents speaking English at home (%)
Residents speaking English at home - Born in the United States (%)
Residents speaking English at home - Native, born elsewhere (%)
Residents speaking English at home - Foreign born (%)
Residents speaking Spanish at home (%)
Residents speaking Spanish at home - Born in the United States (%)
Residents speaking Spanish at home - Native, born elsewhere (%)
Residents speaking Spanish at home - Foreign born (%)
Residents speaking other language at home (%)
Residents speaking other language at home - Born in the United States (%)
Residents speaking other language at home - Native, born elsewhere (%)
Residents speaking other language at home - Foreign born (%)
Marital status - Never married (%)
Marital status - Now married (%)
Marital status - Separated (%)
Marital status - Widowed (%)
Marital status - Divorced (%)
Ancestries Reported - Arab (%)
Ancestries Reported - Czech (%)
Ancestries Reported - Danish (%)
Ancestries Reported - Dutch (%)
Ancestries Reported - English (%)
Ancestries Reported - French (%)
Ancestries Reported - French Canadian (%)
Ancestries Reported - German (%)
Ancestries Reported - Greek (%)
Ancestries Reported - Hungarian (%)
Ancestries Reported - Irish (%)
Ancestries Reported - Italian (%)
Ancestries Reported - Lithuanian (%)
Ancestries Reported - Norwegian (%)
Ancestries Reported - Polish (%)
Ancestries Reported - Portuguese (%)
Ancestries Reported - Russian (%)
Ancestries Reported - Scotch-Irish (%)
Ancestries Reported - Scottish (%)
Ancestries Reported - Slovak (%)
Ancestries Reported - Subsaharan African (%)
Ancestries Reported - Swedish (%)
Ancestries Reported - Swiss (%)
Ancestries Reported - Ukrainian (%)
Ancestries Reported - United States (%)
Ancestries Reported - Welsh (%)
Ancestries Reported - West Indian (%)
Ancestries Reported - Other (%)
Geographical mobility - Same house 1 year ago (%)
Geographical mobility - Same house 1 year ago (%) - White
Geographical mobility - Same house 1 year ago (%) - Black or African American
Geographical mobility - Same house 1 year ago (%) - Asian
Geographical mobility - Same house 1 year ago (%) - Hispanic or Latino
Geographical mobility - Same house 1 year ago (%) - American Indian and Alaska Native
Geographical mobility - Same house 1 year ago (%) - Multirace
Geographical mobility - Same house 1 year ago (%) - Other Race
Geographical mobility - Moved within same county (%)
Geographical mobility - Moved within same county (%) - White
Geographical mobility - Moved within same county (%) - Black or African American
Geographical mobility - Moved within same county (%) - Asian
Geographical mobility - Moved within same county (%) - Hispanic or Latino
Geographical mobility - Moved within same county (%) - American Indian and Alaska Native
Geographical mobility - Moved within same county (%) - Multirace
Geographical mobility - Moved within same county (%) - Other Race
Geographical mobility - Moved from different county within same state (%)
Geographical mobility - Moved from different county within same state (%) - White
Geographical mobility - Moved from different county within same state (%) - Black or African American
Geographical mobility - Moved from different county within same state (%) - Asian
Geographical mobility - Moved from different county within same state (%) - Hispanic or Latino
Geographical mobility - Moved from different county within same state (%) - American Indian and Alaska Native
Geographical mobility - Moved from different county within same state (%) - Multirace
Geographical mobility - Moved from different county within same state (%) - Other Race
Geographical mobility - Moved from different state (%)
Geographical mobility - Moved from different state (%) - White
Geographical mobility - Moved from different state (%) - Black or African American
Geographical mobility - Moved from different state (%) - Asian
Geographical mobility - Moved from different state (%) - Hispanic or Latino
Geographical mobility - Moved from different state (%) - American Indian and Alaska Native
Geographical mobility - Moved from different state (%) - Multirace
Geographical mobility - Moved from different state (%) - Other Race
Geographical mobility - Moved from abroad (%)
Geographical mobility - Moved from abroad (%) - White
Geographical mobility - Moved from abroad (%) - Black or African American
Geographical mobility - Moved from abroad (%) - Asian
Geographical mobility - Moved from abroad (%) - Hispanic or Latino
Geographical mobility - Moved from abroad (%) - American Indian and Alaska Native
Geographical mobility - Moved from abroad (%) - Multirace
Geographical mobility - Moved from abroad (%) - Other Race
Place of birth for the foreign-born population - Ireland (%)
Place of birth for the foreign-born population - Denmark (%)
Place of birth for the foreign-born population - Norway (%)
Place of birth for the foreign-born population - Sweden (%)
Place of birth for the foreign-born population - United Kingdom (%)
Place of birth for the foreign-born population - England (%)
Place of birth for the foreign-born population - Scotland (%)
Place of birth for the foreign-born population - Other Northern Europe (%)
Place of birth for the foreign-born population - Austria (%)
Place of birth for the foreign-born population - Belgium (%)
Place of birth for the foreign-born population - France (%)
Place of birth for the foreign-born population - Germany (%)
Place of birth for the foreign-born population - Netherlands (%)
Place of birth for the foreign-born population - Switzerland (%)
Place of birth for the foreign-born population - Other Western Europe (%)
Place of birth for the foreign-born population - Greece (%)
Place of birth for the foreign-born population - Italy (%)
Place of birth for the foreign-born population - Portugal (%)
Place of birth for the foreign-born population - Spain (%)
Place of birth for the foreign-born population - Other Southern Europe (%)
Place of birth for the foreign-born population - Albania (%)
Place of birth for the foreign-born population - Belarus (%)
Place of birth for the foreign-born population - Bosnia and Herzegovina (%)
Place of birth for the foreign-born population - Bulgaria (%)
Place of birth for the foreign-born population - Croatia (%)
Place of birth for the foreign-born population - Czechoslovakia (%)
Place of birth for the foreign-born population - Hungary (%)
Place of birth for the foreign-born population - Latvia (%)
Place of birth for the foreign-born population - Lithuania (%)
Place of birth for the foreign-born population - North Macedonia (Macedonia) (%)
Place of birth for the foreign-born population - Moldova (%)
Place of birth for the foreign-born population - Poland (%)
Place of birth for the foreign-born population - Romania (%)
Place of birth for the foreign-born population - Russia (%)
Place of birth for the foreign-born population - Serbia (%)
Place of birth for the foreign-born population - Ukraine (%)
Place of birth for the foreign-born population - Other Eastern Europe (%)
Place of birth for the foreign-born population - China (%)
Place of birth for the foreign-born population - Hong Kong (%)
Place of birth for the foreign-born population - Taiwan (%)
Place of birth for the foreign-born population - Japan (%)
Place of birth for the foreign-born population - Korea (%)
Place of birth for the foreign-born population - Other Eastern Asia (%)
Place of birth for the foreign-born population - Afghanistan (%)
Place of birth for the foreign-born population - Bangladesh (%)
Place of birth for the foreign-born population - India (%)
Place of birth for the foreign-born population - Iran (%)
Place of birth for the foreign-born population - Kazakhstan (%)
Place of birth for the foreign-born population - Nepal (%)
Place of birth for the foreign-born population - Pakistan (%)
Place of birth for the foreign-born population - Sri Lanka (%)
Place of birth for the foreign-born population - Uzbekistan (%)
Place of birth for the foreign-born population - Other South Central Asia (%)
Place of birth for the foreign-born population - Burma (%)
Place of birth for the foreign-born population - Cambodia (%)
Place of birth for the foreign-born population - Indonesia (%)
Place of birth for the foreign-born population - Laos (%)
Place of birth for the foreign-born population - Malaysia (%)
Place of birth for the foreign-born population - Philippines (%)
Place of birth for the foreign-born population - Singapore (%)
Place of birth for the foreign-born population - Thailand (%)
Place of birth for the foreign-born population - Vietnam (%)
Place of birth for the foreign-born population - Other South Eastern Asia (%)
Place of birth for the foreign-born population - Armenia (%)
Place of birth for the foreign-born population - Iraq (%)
Place of birth for the foreign-born population - Israel (%)
Place of birth for the foreign-born population - Jordan (%)
Place of birth for the foreign-born population - Kuwait (%)
Place of birth for the foreign-born population - Lebanon (%)
Place of birth for the foreign-born population - Saudi Arabia (%)
Place of birth for the foreign-born population - Syria (%)
Place of birth for the foreign-born population - Turkey (%)
Place of birth for the foreign-born population - Yemen (%)
Place of birth for the foreign-born population - Other Western Asia (%)
Place of birth for the foreign-born population - Eritrea (%)
Place of birth for the foreign-born population - Ethiopia (%)
Place of birth for the foreign-born population - Kenya (%)
Place of birth for the foreign-born population - Somalia (%)
Place of birth for the foreign-born population - Uganda (%)
Place of birth for the foreign-born population - Zimbabwe (%)
Place of birth for the foreign-born population - Other Eastern Africa (%)
Place of birth for the foreign-born population - Cameroon (%)
Place of birth for the foreign-born population - Congo (%)
Place of birth for the foreign-born population - Democratic Republic of Congo (Zaire) (%)
Place of birth for the foreign-born population - Other Middle Africa (%)
Place of birth for the foreign-born population - Egypt (%)
Place of birth for the foreign-born population - Morocco (%)
Place of birth for the foreign-born population - Sudan (%)
Place of birth for the foreign-born population - Other Northern Africa (%)
Place of birth for the foreign-born population - South Africa (%)
Place of birth for the foreign-born population - Other Southern Africa (%)
Place of birth for the foreign-born population - Cabo Verde (%)
Place of birth for the foreign-born population - Ghana (%)
Place of birth for the foreign-born population - Liberia (%)
Place of birth for the foreign-born population - Nigeria (%)
Place of birth for the foreign-born population - Senegal (%)
Place of birth for the foreign-born population - Sierra Leone (%)
Place of birth for the foreign-born population - Other Western Africa (%)
Place of birth for the foreign-born population - Australia (%)
Place of birth for the foreign-born population - New Zealand (%)
Place of birth for the foreign-born population - Fiji (%)
Place of birth for the foreign-born population - Micronesia (%)
Place of birth for the foreign-born population - Bahamas (%)
Place of birth for the foreign-born population - Barbados (%)
Place of birth for the foreign-born population - Cuba (%)
Place of birth for the foreign-born population - Dominica (%)
Place of birth for the foreign-born population - Dominican Republic (%)
Place of birth for the foreign-born population - Grenada (%)
Place of birth for the foreign-born population - Haiti (%)
Place of birth for the foreign-born population - Jamaica (%)
Place of birth for the foreign-born population - St. Vincent and the Grenadines (%)
Place of birth for the foreign-born population - Trinidad and Tobago (%)
Place of birth for the foreign-born population - West Indies (%)
Place of birth for the foreign-born population - Other Caribbean (%)
Place of birth for the foreign-born population - Belize (%)
Place of birth for the foreign-born population - Costa Rica (%)
Place of birth for the foreign-born population - El Salvador (%)
Place of birth for the foreign-born population - Guatemala (%)
Place of birth for the foreign-born population - Honduras (%)
Place of birth for the foreign-born population - Mexico (%)
Place of birth for the foreign-born population - Nicaragua (%)
Place of birth for the foreign-born population - Panama (%)
Place of birth for the foreign-born population - Other Central America (%)
Place of birth for the foreign-born population - Argentina (%)
Place of birth for the foreign-born population - Bolivia (%)
Place of birth for the foreign-born population - Brazil (%)
Place of birth for the foreign-born population - Chile (%)
Place of birth for the foreign-born population - Colombia (%)
Place of birth for the foreign-born population - Ecuador (%)
Place of birth for the foreign-born population - Guyana (%)
Place of birth for the foreign-born population - Peru (%)
Place of birth for the foreign-born population - Uruguay (%)
Place of birth for the foreign-born population - Venezuela (%)
Place of birth for the foreign-born population - Other South America (%)
Place of birth for the foreign-born population - Canada (%)
Place of birth for the foreign-born population - Other Northern America (%)
Place of birth for the foreign-born population - Other (%)
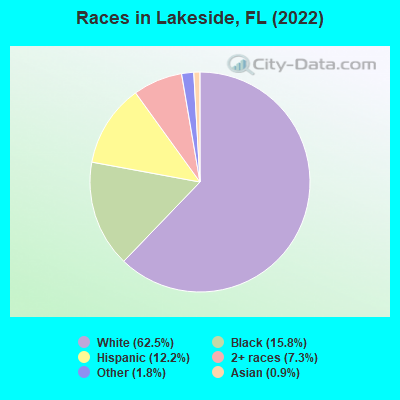
According to 2022 data, the most numerous races in Lakeside, FL are White alone (19,964 residents), Hispanic (3,890 residents), and Black alone (5,060 residents). 91.3% of Lakeside residents speak English at home. 6.0% of Lakeside, FL residents are foreign-born (3.7% born in Latin America, 1.0% born in Asia, 0.9% born in Europe), which is 250.4% less than the foreign-born rate of 21.0% across the entire state of Florida.
Race distribution in Lakeside
2000 2022
10,458,509 65.4% White alone 2,682,715 16.8% Hispanic 2,264,268 14.2% Black alone 261,693 1.6% Asian alone 236,954 1.5% Two or more races 42,358 0.3% American Indian alone 28,994 0.2% Other race alone 6,887 0.04% Native Hawaiian and Other
11,309,403 50.8% White alone 6,025,039 27.1% Hispanic 3,241,015 14.6% Black alone 861,630 3.9% Two or more races 623,692 2.8% Asian alone 152,054 0.7% Other race alone 22,504 0.1% American Indian alone 9,486 0.04% Native Hawaiian and Other
Income and house value in Lakeside Median household income in 2022 $83,899 White non-Hispanic householders$93,463 Black householders$132,243 Asian householders$136,764 Some other race householders$61,648 Two or more races householders$91,455 Hispanic or Latino race householdersMedian 2022 house value $277,273 White Non-Hispanic householders$262,306 Black or African American householders$221,871 American Indian or Alaska Native householders $245,239 Asian householders$384,401 Some other race householders$256,792 Two or more races householders$251,541 Hispanic or Latino householders
Median age by race in Lakeside
43.2 Median age for White residents40.3 45.2 32.7 Median age for Black or African American residents29.4 35.9 -665,028,664.4 Median age for American Indian / Alaska Native residents-673,283,704.9 -594,925,633.7 45.6 Median age for Asian residents38.5 55.5 -679,849,340.2 Median age for Native Hawaiian / Pacific Islander residents-666,666,666.0 -666,666,666.0 50.9 Median age for Other race residents41.3 53.8 26.9 Median age for Two or more races residents28.5 30.2 44.1 Median age for White alone residents40.2 46.1 33.4 Median age for Hispanic or Latino residents34.8 29.4
Owner/renter occupied households by race in Lakeside
House owners and renters - White residents 6,532 75.7% Owner occupied2,095 24.3% Renter occupiedHouse owners and renters - Black or African American residents 1,128 62.9% Owner occupied666 37.1% Renter occupiedHouse owners and renters - Asian residents 144 90.7% Owner occupied15 9.3% Renter occupiedHouse owners and renters - Other race residents 358 66.1% Owner occupied184 33.9% Renter occupiedHouse owners and renters - Two or more races residents 594 47.7% Owner occupied652 52.3% Renter occupiedHouse owners and renters - White alone residents 6,450 77.4% Owner occupied1,887 22.6% Renter occupiedHouse owners and renters - Hispanic or Latino residents 619 48.8% Owner occupied648 51.2% Renter occupied
Language usage in Lakeside
English speakers - Total 91.3% of residents of Lakeside speak English at home.
6.1% of residents speak Spanish at home 1,217 66.1% Speak English very well623 33.9% Speak English less than very well2.6% of residents speak other language at home 496 62.5% Speak English very well297 37.5% Speak English less than very well
English speakers - Born in the United States 97.6% of residents of Lakeside speak English at home.
2.0% of residents speak Spanish at home 255 82.3% Speak English very well55 17.7% Speak English less than very well0.5% of residents speak other language at home 57 78.1% Speak English very well16 21.9% Speak English less than very well
English speakers - Native, born elsewhere 69.6% of residents of Lakeside speak English at home.
30.0% of residents speak Spanish at home 258 64.7% Speak English very well141 35.3% Speak English less than very well5.1% of residents speak other language at home 37 54.4% Speak English very well31 45.6% Speak English less than very well
English speakers - Foreign-born 23.8% of residents of Lakeside speak English at home.
39.3% of residents speak Spanish at home 398 53.9% Speak English very well340 46.1% Speak English less than very well29.7% of residents speak other language at home 315 56.6% Speak English very well242 43.4% Speak English less than very well
White (Caucasian) - Speak only English Native:
98.8% (18,966)Foreign-born:
28.6% (135)
White (Caucasian) - Speak another language Native:
1.6% (313)Foreign-born:
71.1% (336)
Black or African American - Speak only English Native:
98.1% (4,812)Foreign-born:
46.1% (108)
Black or African American - Speak another language Native:
1.8% (86)Foreign-born:
53.6% (125)
Asian - Speak only English Native:
60.3% (57)Foreign-born:
21.3% (36)
Asian - Speak another language Native:
34.3% (32)Foreign-born:
76.3% (129)
Other race - Speak only English Native:
61.3% (458)Foreign-born:
5.3% (42)
Other race - Speak another language Native:
37.3% (279)Foreign-born:
81.5% (639)
Two or more races - Speak only English Native:
81.8% (2,770)Foreign-born:
7.8% (33)
Two or more races - Speak another language Native:
18.3% (619)Foreign-born:
69.4% (294)
White alone - Speak only English Native:
98.4% (18,381)Foreign-born:
26.1% (107)
White alone - Speak another language Native:
1.6% (293)Foreign-born:
76.0% (311)
Hispanic or Latino - Speak only English Native:
69.1% (1,767)Foreign-born:
5.2% (44)
Hispanic or Latino - Speak another language Native:
32.5% (832)Foreign-born:
91.9% (770)
Foreign-born residents in Lakeside 1,915 residents are foreign born (3.7% Latin America , 1.0% Asia , 0.9% Europe ).
This city:
6.0%Florida:
21.1%
Marital status for residents in Lakeside Marital status - White (Caucasian) population 15 years and over
Males 32.1% Never married54.3% Now married0.5% Separated4.6% Widowed8.5% DivorcedFemales 23.8% Never married47.7% Now married2.4% Separated9.5% Widowed16.6% DivorcedWomen who gave birth in the past 12 months Now married:
87.8% (277)Unmarried:
12.2% (39)
Women who did not give birth in the past 12 months Now married:
46.8% (2,052)Unmarried:
53.2% (2,332)
Marital status - Black or African American population 15 years and over
Males 47.3% Never married43.3% Now married0.0% Separated1.5% Widowed7.9% DivorcedFemales 47.1% Never married33.2% Now married3.2% Separated2.1% Widowed14.4% DivorcedWomen who gave birth in the past 12 months Now married:
42.2% (56)Unmarried:
57.8% (77)
Women who did not give birth in the past 12 months Now married:
20.0% (292)Unmarried:
80.0% (1,171)
Marital status - Asian population 15 years and over
Males 30.7% Never married64.3% Now married5.0% Separated0.0% Widowed0.0% DivorcedFemales 9.5% Never married72.5% Now married0.0% Separated7.4% Widowed10.6% DivorcedWomen who did not give birth in the past 12 months Now married:
63.1% (44)Unmarried:
36.9% (26)
Marital status - Other race population 15 years and over
Males 26.6% Never married51.5% Now married0.0% Separated0.0% Widowed21.9% DivorcedFemales 26.8% Never married65.1% Now married0.0% Separated6.9% Widowed1.2% DivorcedWomen who did not give birth in the past 12 months Now married:
52.7% (179)Unmarried:
47.3% (160)
Marital status - Two or more races population 15 years and over
Males 46.4% Never married38.8% Now married2.3% Separated0.0% Widowed12.4% DivorcedFemales 39.9% Never married51.9% Now married0.0% Separated2.6% Widowed5.7% DivorcedWomen who gave birth in the past 12 months Now married:
0.0% (0)Unmarried:
100.0% (10)
Women who did not give birth in the past 12 months Now married:
46.7% (452)Unmarried:
53.3% (516)
Marital status - White alone, not Hispanic / Latino population 15 years and over
Males 31.8% Never married54.8% Now married0.5% Separated4.6% Widowed8.3% DivorcedFemales 22.8% Never married48.0% Now married2.4% Separated9.9% Widowed16.9% DivorcedWomen who gave birth in the past 12 months Now married:
85.8% (235)Unmarried:
14.2% (39)
Women who did not give birth in the past 12 months Now married:
47.7% (2,019)Unmarried:
52.3% (2,212)
Marital status - Hispanic or Latino population 15 years and over
Males 28.2% Never married53.2% Now married0.0% Separated1.4% Widowed17.2% DivorcedFemales 38.7% Never married57.2% Now married0.0% Separated1.1% Widowed3.0% DivorcedWomen who gave birth in the past 12 months Now married:
88.2% (46)Unmarried:
11.8% (6)
Women who did not give birth in the past 12 months Now married:
48.4% (439)Unmarried:
51.6% (469)
Ancestries in Lakeside
1,654 11.9% American1,389 10.0% English1,359 9.8% German739 5.3% Irish351 2.5% European320 2.3% Italian254 1.8% Haitian252 1.8% Scottish232 1.7% French198 1.4% Polish154 1.1% Palestinian103 0.7% British100 0.7% West Indian92 0.7% U.S. Virgin Islander82 0.6% Scotch-Irish79 0.6% Turkish75 0.5% Trinidadian and Tobagonian74 0.5% Greek67 0.5% African66 0.5% Brazilian43 0.3% Portuguese42 0.3% Norwegian39 0.3% Arab39 0.3% Northern European39 0.3% Scandinavian34 0.2% Swedish32 0.2% Czech29 0.2% Lebanese29 0.2% Cajun23 0.2% Ukrainian20 0.1% French Canadian18 0.1% Jamaican15 0.1% Moroccan15 0.1% Austrian8 0.06% Russian6 0.04% Dutch
Geographical mobility in Lakeside Same house 1 year ago 19,019 94.0% White (Caucasian)4,621 88.7% Black or African American357 98.9% Asian10 100.0% Native Hawaiian / Pacific Islander1,318 74.2% Other race4,119 91.9% Two or more races18,678 95.0% White alone, not Hispanic / Latino3,175 81.3% Hispanic or LatinoMoved within same county 512 2.5% White / Caucasian79 1.5% Black or African American257 14.5% Other race98 2.2% Two or more races499 2.5% White alone, not Hispanic / Latino89 2.3% Hispanic or LatinoMoved within same state 496 2.5% White / Caucasian272 5.2% Black or African American8 2.2% Asian14 0.8% Other race259 5.8% Two or more races403 2.0% White alone, not Hispanic / Latino374 9.6% Hispanic or LatinoMoved from different state 248 1.2% White / Caucasian55 1.1% Black or African American75 4.2% Other race71 1.6% Two or more races556 2.8% White alone, not Hispanic / Latino168 4.3% Hispanic or LatinoMoved from abroad 227 1.1% White99 5.6% Other race304 1.5% White alone, not Hispanic / Latino57 1.5% Hispanic or Latino
Children Nativity (place of birth) in Lakeside
Children under 6 years - Living with two parents Both parents native 1,114 100.0% NativeBoth parents foreign-born 307 100.0% NativeOne native, one foreign-born parent 9 100.0% NativeChildren under 6 years - Living with one parent Native parent 801 100.0% NativeForeign-born parent 13 100.0% NativeChildren 6 to 17 years - Living with two parents Both parents native 2,128 100.0% NativeBoth parents foreign-born 62 100.0% NativeOne native, one foreign-born parent 92 100.0% NativeChildren 6 to 17 years - Living with one parent Native parent 1,307 100.0% NativeForeign-born parent 51 50.6% Native50 49.4% Foreign-born
Grandparents responsible for own grandchildren in Lakeside
Grandparents (30 to 59 years) White / Caucasian 81 35.1% Responsible for grandchildren150 64.9% Not responsible for grandchildrenBlack or African American 59 41.0% Responsible for grandchildren85 59.0% Not responsible for grandchildrenTwo or more races 70 100.0% Responsible for grandchildrenWhite alone, not Hispanic / Latino 90 31.7% Responsible for grandchildren193 68.3% Not responsible for grandchildrenHispanic or Latino 8 100.0% Responsible for grandchildrenGrandparents (60 years and over) White / Caucasian 173 34.9% Responsible for grandchildren322 65.1% Not responsible for grandchildrenBlack or African American 69 100.0% Not responsible for grandchildrenWhite alone, not Hispanic / Latino 173 35.8% Responsible for grandchildren310 64.2% Not responsible for grandchildrenHispanic or Latino 56 100.0% Not responsible for grandchildren