Races in Laurinburg, North Carolina (NC) Detailed Stats
Data:
Races - White alone (%)
Races - White alone (% change since 2000)
Races - Black alone (%)
Races - Black alone (% change since 2000)
Races - American Indian alone (%)
Races - American Indian alone (% change since 2000)
Races - Asian alone (%)
Races - Asian alone (% change since 2000)
Races - Hispanic (%)
Races - Hispanic (% change since 2000)
Races - Native Hawaiian and Other Pacific Islander alone (%)
Races - Native Hawaiian and Other Pacific Islander alone (% change since 2000)
Races - Two or more races(%)
Races - Two or more races(% change since 2000)
Races - Other race alone (%)
Races - Other race alone (% change since 2000)
Racial diversity
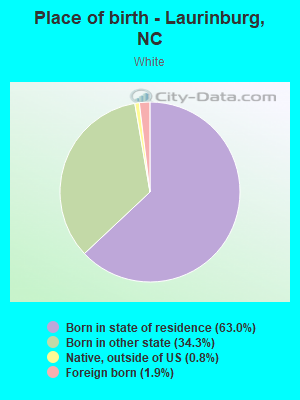
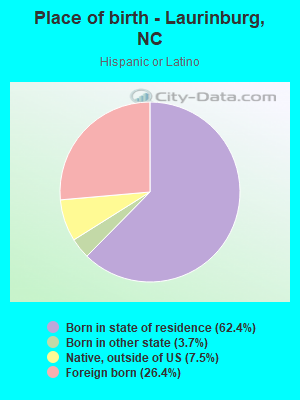
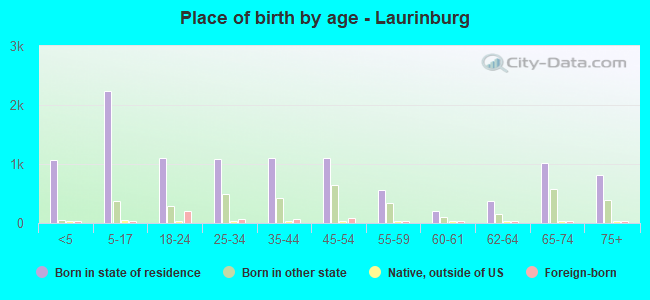
Place of birth - Born in state of residence (%)
Place of birth - Born in state of residence (%) - White
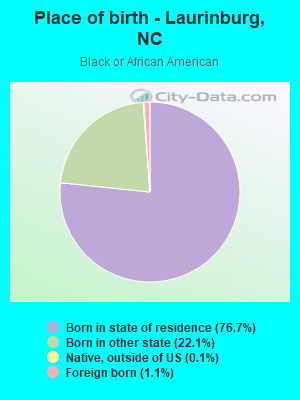
Place of birth - Born in state of residence (%) - Black or African American
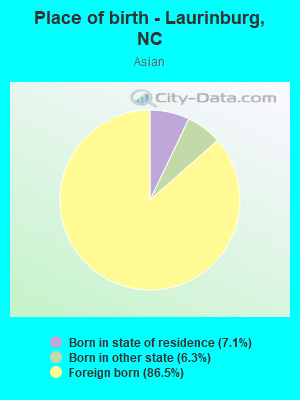
Place of birth - Born in state of residence (%) - Asian
Place of birth - Born in state of residence (%) - Hispanic or Latino
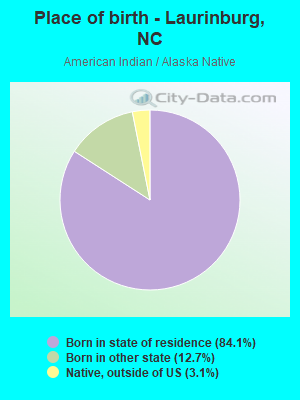
Place of birth - Born in state of residence (%) - American Indian and Alaska Native
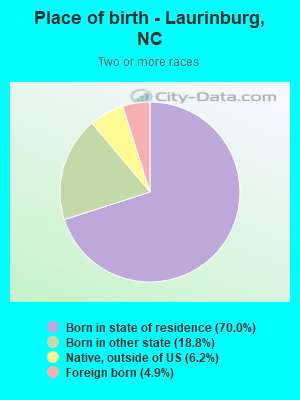
Place of birth - Born in state of residence (%) - Multirace
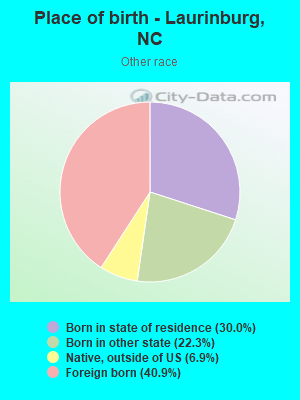
Place of birth - Born in state of residence (%) - Other Race
Place of birth - Born in other state (%)
Place of birth - Born in other state (%) - White
Place of birth - Born in other state (%) - Black or African American
Place of birth - Born in other state (%) - Asian
Place of birth - Born in other state (%) - Hispanic or Latino
Place of birth - Born in other state (%) - American Indian and Alaska Native
Place of birth - Born in other state (%) - Multirace
Place of birth - Born in other state (%) - Other Race
Place of birth - Native, outside of US (%)
Place of birth - Native, outside of US (%) - White
Place of birth - Native, outside of US (%) - Black or African American
Place of birth - Native, outside of US (%) - Asian
Place of birth - Native, outside of US (%) - Hispanic or Latino
Place of birth - Native, outside of US (%) - American Indian and Alaska Native
Place of birth - Native, outside of US (%) - Multirace
Place of birth - Native, outside of US (%) - Other Race
Place of birth - Foreign born (%)
Place of birth - Foreign born (%) - White
Place of birth - Foreign born (%) - Black or African American
Place of birth - Foreign born (%) - Asian
Place of birth - Foreign born (%) - Hispanic or Latino
Place of birth - Foreign born (%) - American Indian and Alaska Native
Place of birth - Foreign born (%) - Multirace
Place of birth - Foreign born (%) - Other Race
Residents speaking English at home (%)
Residents speaking English at home - Born in the United States (%)
Residents speaking English at home - Native, born elsewhere (%)
Residents speaking English at home - Foreign born (%)
Residents speaking Spanish at home (%)
Residents speaking Spanish at home - Born in the United States (%)
Residents speaking Spanish at home - Native, born elsewhere (%)
Residents speaking Spanish at home - Foreign born (%)
Residents speaking other language at home (%)
Residents speaking other language at home - Born in the United States (%)
Residents speaking other language at home - Native, born elsewhere (%)
Residents speaking other language at home - Foreign born (%)
Marital status - Never married (%)
Marital status - Now married (%)
Marital status - Separated (%)
Marital status - Widowed (%)
Marital status - Divorced (%)
Ancestries Reported - Arab (%)
Ancestries Reported - Czech (%)
Ancestries Reported - Danish (%)
Ancestries Reported - Dutch (%)
Ancestries Reported - English (%)
Ancestries Reported - French (%)
Ancestries Reported - French Canadian (%)
Ancestries Reported - German (%)
Ancestries Reported - Greek (%)
Ancestries Reported - Hungarian (%)
Ancestries Reported - Irish (%)
Ancestries Reported - Italian (%)
Ancestries Reported - Lithuanian (%)
Ancestries Reported - Norwegian (%)
Ancestries Reported - Polish (%)
Ancestries Reported - Portuguese (%)
Ancestries Reported - Russian (%)
Ancestries Reported - Scotch-Irish (%)
Ancestries Reported - Scottish (%)
Ancestries Reported - Slovak (%)
Ancestries Reported - Subsaharan African (%)
Ancestries Reported - Swedish (%)
Ancestries Reported - Swiss (%)
Ancestries Reported - Ukrainian (%)
Ancestries Reported - United States (%)
Ancestries Reported - Welsh (%)
Ancestries Reported - West Indian (%)
Ancestries Reported - Other (%)
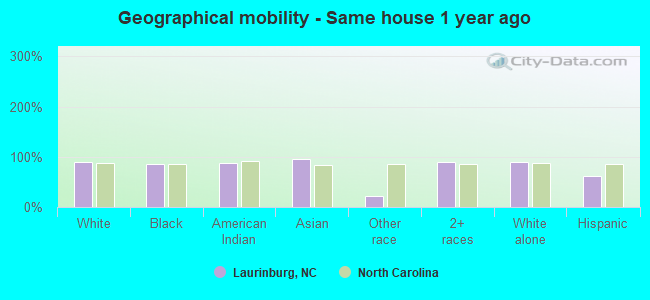
Geographical mobility - Same house 1 year ago (%)
Geographical mobility - Same house 1 year ago (%) - White
Geographical mobility - Same house 1 year ago (%) - Black or African American
Geographical mobility - Same house 1 year ago (%) - Asian
Geographical mobility - Same house 1 year ago (%) - Hispanic or Latino
Geographical mobility - Same house 1 year ago (%) - American Indian and Alaska Native
Geographical mobility - Same house 1 year ago (%) - Multirace
Geographical mobility - Same house 1 year ago (%) - Other Race
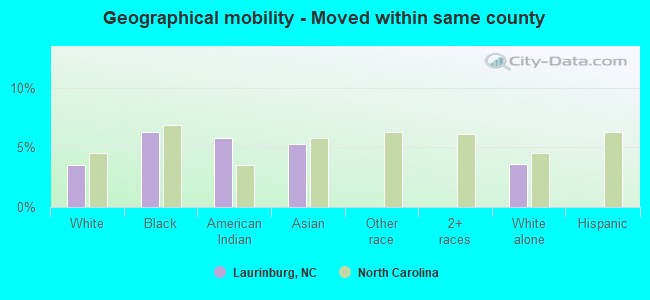
Geographical mobility - Moved within same county (%)
Geographical mobility - Moved within same county (%) - White
Geographical mobility - Moved within same county (%) - Black or African American
Geographical mobility - Moved within same county (%) - Asian
Geographical mobility - Moved within same county (%) - Hispanic or Latino
Geographical mobility - Moved within same county (%) - American Indian and Alaska Native
Geographical mobility - Moved within same county (%) - Multirace
Geographical mobility - Moved within same county (%) - Other Race
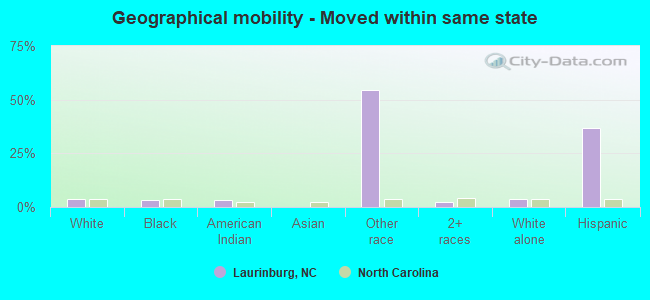
Geographical mobility - Moved from different county within same state (%)
Geographical mobility - Moved from different county within same state (%) - White
Geographical mobility - Moved from different county within same state (%) - Black or African American
Geographical mobility - Moved from different county within same state (%) - Asian
Geographical mobility - Moved from different county within same state (%) - Hispanic or Latino
Geographical mobility - Moved from different county within same state (%) - American Indian and Alaska Native
Geographical mobility - Moved from different county within same state (%) - Multirace
Geographical mobility - Moved from different county within same state (%) - Other Race
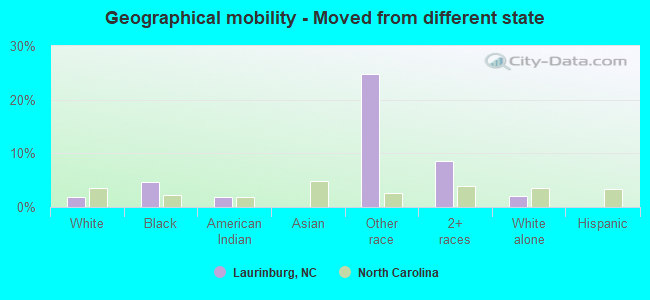
Geographical mobility - Moved from different state (%)
Geographical mobility - Moved from different state (%) - White
Geographical mobility - Moved from different state (%) - Black or African American
Geographical mobility - Moved from different state (%) - Asian
Geographical mobility - Moved from different state (%) - Hispanic or Latino
Geographical mobility - Moved from different state (%) - American Indian and Alaska Native
Geographical mobility - Moved from different state (%) - Multirace
Geographical mobility - Moved from different state (%) - Other Race
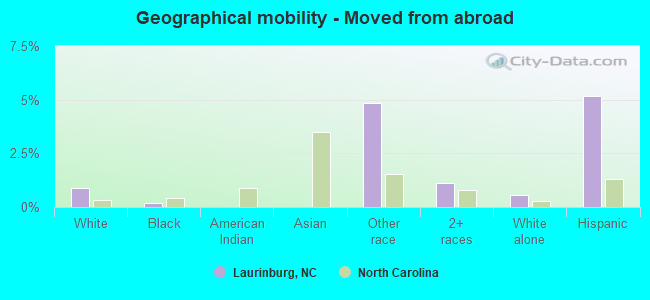
Geographical mobility - Moved from abroad (%)
Geographical mobility - Moved from abroad (%) - White
Geographical mobility - Moved from abroad (%) - Black or African American
Geographical mobility - Moved from abroad (%) - Asian
Geographical mobility - Moved from abroad (%) - Hispanic or Latino
Geographical mobility - Moved from abroad (%) - American Indian and Alaska Native
Geographical mobility - Moved from abroad (%) - Multirace
Geographical mobility - Moved from abroad (%) - Other Race
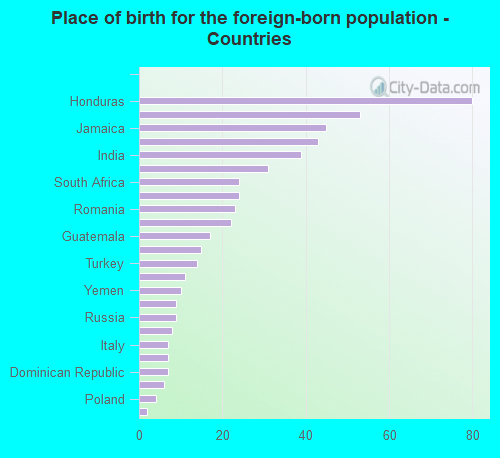
Place of birth for the foreign-born population - Ireland (%)
Place of birth for the foreign-born population - Denmark (%)
Place of birth for the foreign-born population - Norway (%)
Place of birth for the foreign-born population - Sweden (%)
Place of birth for the foreign-born population - United Kingdom (%)
Place of birth for the foreign-born population - England (%)
Place of birth for the foreign-born population - Scotland (%)
Place of birth for the foreign-born population - Other Northern Europe (%)
Place of birth for the foreign-born population - Austria (%)
Place of birth for the foreign-born population - Belgium (%)
Place of birth for the foreign-born population - France (%)
Place of birth for the foreign-born population - Germany (%)
Place of birth for the foreign-born population - Netherlands (%)
Place of birth for the foreign-born population - Switzerland (%)
Place of birth for the foreign-born population - Other Western Europe (%)
Place of birth for the foreign-born population - Greece (%)
Place of birth for the foreign-born population - Italy (%)
Place of birth for the foreign-born population - Portugal (%)
Place of birth for the foreign-born population - Spain (%)
Place of birth for the foreign-born population - Other Southern Europe (%)
Place of birth for the foreign-born population - Albania (%)
Place of birth for the foreign-born population - Belarus (%)
Place of birth for the foreign-born population - Bosnia and Herzegovina (%)
Place of birth for the foreign-born population - Bulgaria (%)
Place of birth for the foreign-born population - Croatia (%)
Place of birth for the foreign-born population - Czechoslovakia (%)
Place of birth for the foreign-born population - Hungary (%)
Place of birth for the foreign-born population - Latvia (%)
Place of birth for the foreign-born population - Lithuania (%)
Place of birth for the foreign-born population - North Macedonia (Macedonia) (%)
Place of birth for the foreign-born population - Moldova (%)
Place of birth for the foreign-born population - Poland (%)
Place of birth for the foreign-born population - Romania (%)
Place of birth for the foreign-born population - Russia (%)
Place of birth for the foreign-born population - Serbia (%)
Place of birth for the foreign-born population - Ukraine (%)
Place of birth for the foreign-born population - Other Eastern Europe (%)
Place of birth for the foreign-born population - China (%)
Place of birth for the foreign-born population - Hong Kong (%)
Place of birth for the foreign-born population - Taiwan (%)
Place of birth for the foreign-born population - Japan (%)
Place of birth for the foreign-born population - Korea (%)
Place of birth for the foreign-born population - Other Eastern Asia (%)
Place of birth for the foreign-born population - Afghanistan (%)
Place of birth for the foreign-born population - Bangladesh (%)
Place of birth for the foreign-born population - India (%)
Place of birth for the foreign-born population - Iran (%)
Place of birth for the foreign-born population - Kazakhstan (%)
Place of birth for the foreign-born population - Nepal (%)
Place of birth for the foreign-born population - Pakistan (%)
Place of birth for the foreign-born population - Sri Lanka (%)
Place of birth for the foreign-born population - Uzbekistan (%)
Place of birth for the foreign-born population - Other South Central Asia (%)
Place of birth for the foreign-born population - Burma (%)
Place of birth for the foreign-born population - Cambodia (%)
Place of birth for the foreign-born population - Indonesia (%)
Place of birth for the foreign-born population - Laos (%)
Place of birth for the foreign-born population - Malaysia (%)
Place of birth for the foreign-born population - Philippines (%)
Place of birth for the foreign-born population - Singapore (%)
Place of birth for the foreign-born population - Thailand (%)
Place of birth for the foreign-born population - Vietnam (%)
Place of birth for the foreign-born population - Other South Eastern Asia (%)
Place of birth for the foreign-born population - Armenia (%)
Place of birth for the foreign-born population - Iraq (%)
Place of birth for the foreign-born population - Israel (%)
Place of birth for the foreign-born population - Jordan (%)
Place of birth for the foreign-born population - Kuwait (%)
Place of birth for the foreign-born population - Lebanon (%)
Place of birth for the foreign-born population - Saudi Arabia (%)
Place of birth for the foreign-born population - Syria (%)
Place of birth for the foreign-born population - Turkey (%)
Place of birth for the foreign-born population - Yemen (%)
Place of birth for the foreign-born population - Other Western Asia (%)
Place of birth for the foreign-born population - Eritrea (%)
Place of birth for the foreign-born population - Ethiopia (%)
Place of birth for the foreign-born population - Kenya (%)
Place of birth for the foreign-born population - Somalia (%)
Place of birth for the foreign-born population - Uganda (%)
Place of birth for the foreign-born population - Zimbabwe (%)
Place of birth for the foreign-born population - Other Eastern Africa (%)
Place of birth for the foreign-born population - Cameroon (%)
Place of birth for the foreign-born population - Congo (%)
Place of birth for the foreign-born population - Democratic Republic of Congo (Zaire) (%)
Place of birth for the foreign-born population - Other Middle Africa (%)
Place of birth for the foreign-born population - Egypt (%)
Place of birth for the foreign-born population - Morocco (%)
Place of birth for the foreign-born population - Sudan (%)
Place of birth for the foreign-born population - Other Northern Africa (%)
Place of birth for the foreign-born population - South Africa (%)
Place of birth for the foreign-born population - Other Southern Africa (%)
Place of birth for the foreign-born population - Cabo Verde (%)
Place of birth for the foreign-born population - Ghana (%)
Place of birth for the foreign-born population - Liberia (%)
Place of birth for the foreign-born population - Nigeria (%)
Place of birth for the foreign-born population - Senegal (%)
Place of birth for the foreign-born population - Sierra Leone (%)
Place of birth for the foreign-born population - Other Western Africa (%)
Place of birth for the foreign-born population - Australia (%)
Place of birth for the foreign-born population - New Zealand (%)
Place of birth for the foreign-born population - Fiji (%)
Place of birth for the foreign-born population - Micronesia (%)
Place of birth for the foreign-born population - Bahamas (%)
Place of birth for the foreign-born population - Barbados (%)
Place of birth for the foreign-born population - Cuba (%)
Place of birth for the foreign-born population - Dominica (%)
Place of birth for the foreign-born population - Dominican Republic (%)
Place of birth for the foreign-born population - Grenada (%)
Place of birth for the foreign-born population - Haiti (%)
Place of birth for the foreign-born population - Jamaica (%)
Place of birth for the foreign-born population - St. Vincent and the Grenadines (%)
Place of birth for the foreign-born population - Trinidad and Tobago (%)
Place of birth for the foreign-born population - West Indies (%)
Place of birth for the foreign-born population - Other Caribbean (%)
Place of birth for the foreign-born population - Belize (%)
Place of birth for the foreign-born population - Costa Rica (%)
Place of birth for the foreign-born population - El Salvador (%)
Place of birth for the foreign-born population - Guatemala (%)
Place of birth for the foreign-born population - Honduras (%)
Place of birth for the foreign-born population - Mexico (%)
Place of birth for the foreign-born population - Nicaragua (%)
Place of birth for the foreign-born population - Panama (%)
Place of birth for the foreign-born population - Other Central America (%)
Place of birth for the foreign-born population - Argentina (%)
Place of birth for the foreign-born population - Bolivia (%)
Place of birth for the foreign-born population - Brazil (%)
Place of birth for the foreign-born population - Chile (%)
Place of birth for the foreign-born population - Colombia (%)
Place of birth for the foreign-born population - Ecuador (%)
Place of birth for the foreign-born population - Guyana (%)
Place of birth for the foreign-born population - Peru (%)
Place of birth for the foreign-born population - Uruguay (%)
Place of birth for the foreign-born population - Venezuela (%)
Place of birth for the foreign-born population - Other South America (%)
Place of birth for the foreign-born population - Canada (%)
Place of birth for the foreign-born population - Other Northern America (%)
Place of birth for the foreign-born population - Other (%)
Latest news about races in Laurinburg, NC collected exclusively by city-data.com from local newspapers, TV, and radio stations
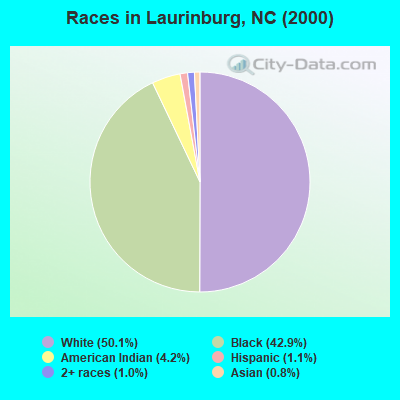
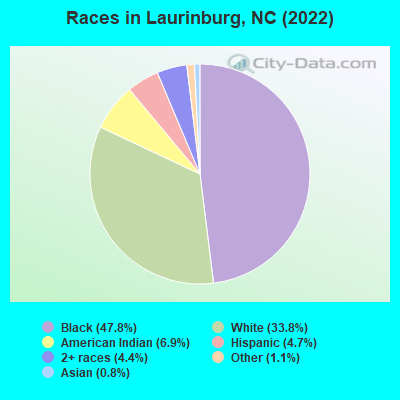
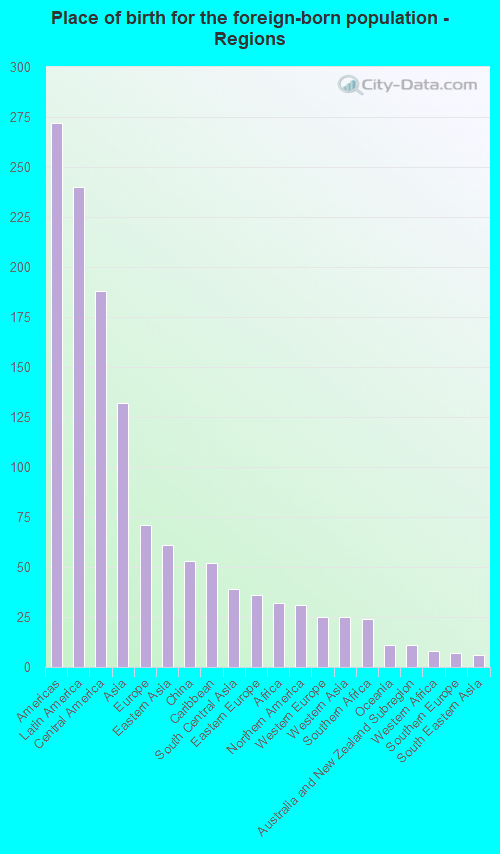
According to 2022 data, the most numerous races in Laurinburg, NC are White alone (5,175 residents), Black alone (7,305 residents), and Hispanic (714 residents). 94.6% of Laurinburg residents speak English at home. 3.4% of Laurinburg, NC residents are foreign-born (1.5% born in Latin America, 0.8% born in Asia, 0.5% born in Europe), which is 135.4% less than the foreign-born rate of 8.0% across the entire state of North Carolina.
Race distribution in Laurinburg
2000 2022
5,647,155 70.2% White alone 1,723,301 21.4% Black alone 378,963 4.7% Hispanic 112,416 1.4% Asian alone 95,333 1.2% American Indian alone 79,965 1.0% Two or more races 9,015 0.1% Other race alone 3,165 0.04% Native Hawaiian and Other
6,497,519 60.7% White alone 2,155,650 20.1% Black alone 1,114,799 10.4% Hispanic 438,061 4.1% Two or more races 341,052 3.2% Asian alone 91,758 0.9% American Indian alone 50,180 0.5% Other race alone 9,954 0.09% Native Hawaiian and Other
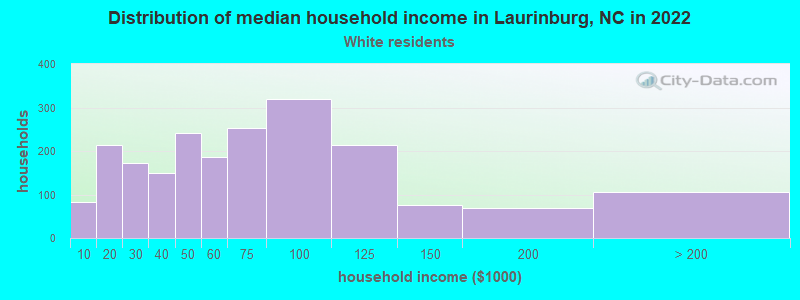
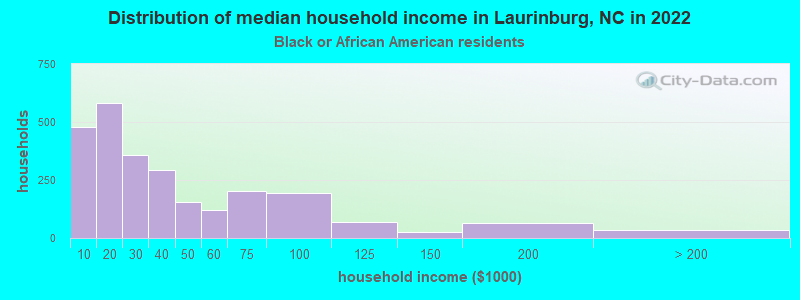
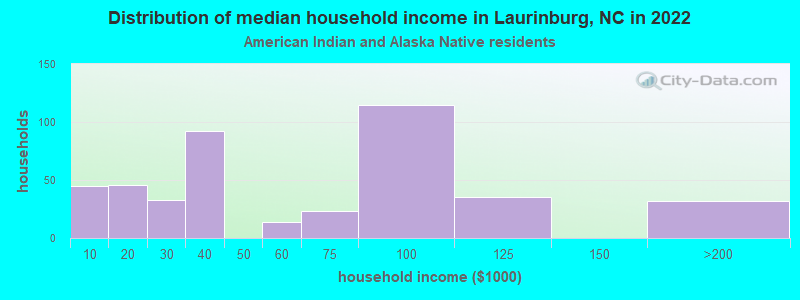
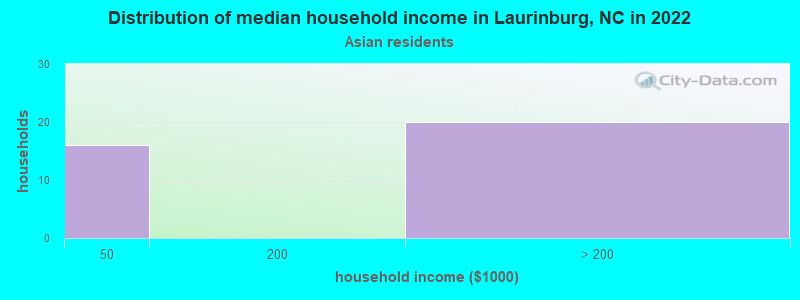
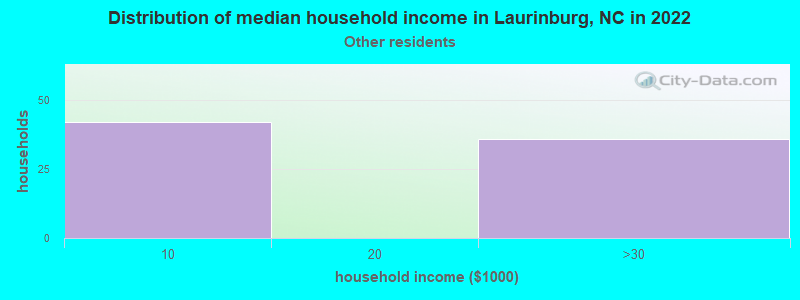
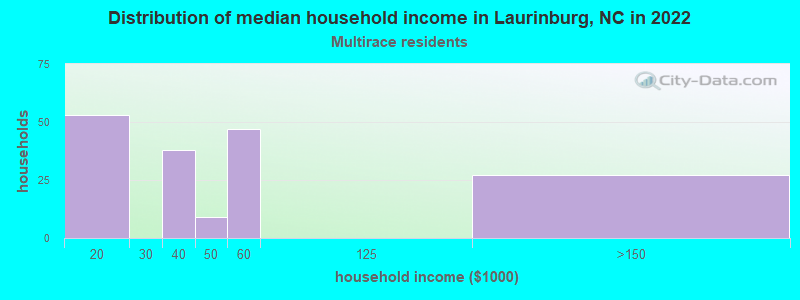
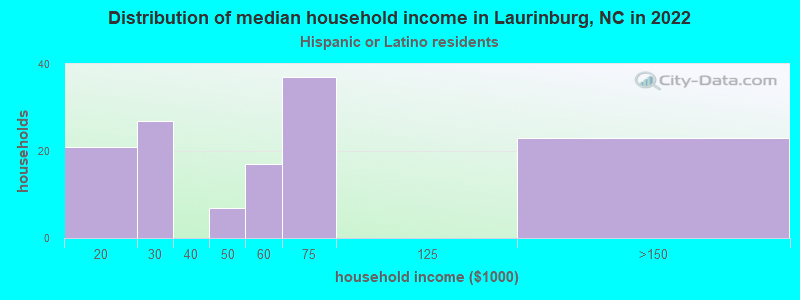
Income and house value in Laurinburg Median household income in 2022 $57,247 White non-Hispanic householders$25,586 Black householders$51,115 American Indian and Alaska Native householders$37,590 Two or more races householders$52,544 Hispanic or Latino race householdersMedian 2022 house value $167,844 White Non-Hispanic householders$100,016 Black or African American householders$117,069 American Indian or Alaska Native householders $338,370 Asian householders$526,907 Native Hawaiian and other Pacific Islander householders$162,862 Some other race householders$161,521 Two or more races householders$263,453 Hispanic or Latino householders
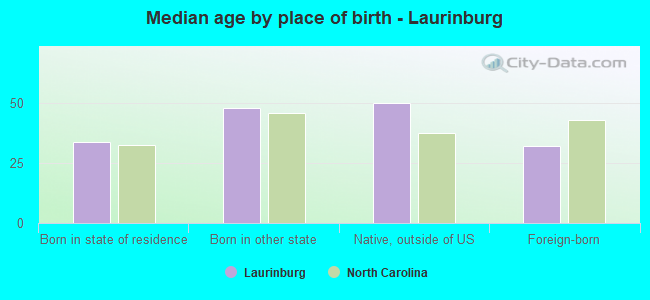
Median age by race in Laurinburg
51.0 Median age for White residents51.5 50.4 34.8 Median age for Black or African American residents32.3 38.2 38.2 Median age for American Indian / Alaska Native residents35.2 39.6 32.6 Median age for Asian residents32.6 30.7 -609,884,331.7 Median age for Native Hawaiian / Pacific Islander residents-611,708,482.1 -612,403,100.2 20.8 Median age for Other race residents21.2 19.5 12.6 Median age for Two or more races residents17.0 9.5 50.3 Median age for White alone residents50.7 50.1 19.7 Median age for Hispanic or Latino residents21.2 4.2
Owner/renter occupied households by race in Laurinburg
House owners and renters - White residents 1,445 69.0% Owner occupied649 31.0% Renter occupiedHouse owners and renters - Black or African American residents 775 29.5% Owner occupied1,856 70.5% Renter occupiedHouse owners and renters - American Indian / Alaska Native residents 176 41.1% Owner occupied252 58.9% Renter occupiedHouse owners and renters - Asian residents 20 63.0% Owner occupied12 37.0% Renter occupiedHouse owners and renters - Other race residents 78 100.0% Renter occupiedHouse owners and renters - Two or more races residents 102 58.6% Owner occupied72 41.4% Renter occupiedHouse owners and renters - White alone residents 1,446 69.4% Owner occupied639 30.6% Renter occupiedHouse owners and renters - Hispanic or Latino residents 41 30.9% Owner occupied92 69.1% Renter occupied
Language usage in Laurinburg
English speakers - Total 94.6% of residents of Laurinburg speak English at home.
3.1% of residents speak Spanish at home 167 37.9% Speak English very well274 62.1% Speak English less than very well2.0% of residents speak other language at home 133 47.0% Speak English very well150 53.0% Speak English less than very well
English speakers - Born in the United States 97.3% of residents of Laurinburg speak English at home.
0.7% of residents speak Spanish at home 18 64.3% Speak English very well10 35.7% Speak English less than very well2.2% of residents speak other language at home 32 38.6% Speak English very well51 61.4% Speak English less than very well
English speakers - Native, born elsewhere 61.2% of residents of Laurinburg speak English at home.
32.7% of residents speak Spanish at home 25 46.3% Speak English very well29 53.7% Speak English less than very well7.3% of residents speak other language at home 12 100.0% Speak English very well
English speakers - Foreign-born 35.6% of residents of Laurinburg speak English at home.
31.9% of residents speak Spanish at home 24 14.5% Speak English very well142 85.5% Speak English less than very well32.5% of residents speak other language at home 64 37.9% Speak English very well105 62.1% Speak English less than very well
White (Caucasian) - Speak only English Native:
98.3% (4,799)Foreign-born:
88.6% (85)
White (Caucasian) - Speak another language Native:
1.9% (93)Foreign-born:
31.4% (30)
Black or African American - Speak only English Native:
100.0% (6,691)Foreign-born:
72.7% (57)
Black or African American - Speak another language Native:
0.2% (10)Foreign-born:
27.9% (22)
Asian - Speak only English Native:
99.5% (16)Foreign-born:
23.4% (25)
Other race - Speak only English Native:
14.8% (30)Foreign-born:
8.6% (16)
Other race - Speak another language Native:
84.9% (174)Foreign-born:
91.0% (169)
Two or more races - Speak another language Native:
17.5% (127)Foreign-born:
100.0% (60)
White alone - Speak only English Native:
97.2% (4,758)Foreign-born:
55.4% (66)
White alone - Speak another language Native:
2.8% (138)Foreign-born:
44.6% (53)
Hispanic or Latino - Speak only English Native:
37.7% (98)Foreign-born:
11.6% (22)
Hispanic or Latino - Speak another language Native:
62.1% (161)Foreign-born:
88.5% (168)
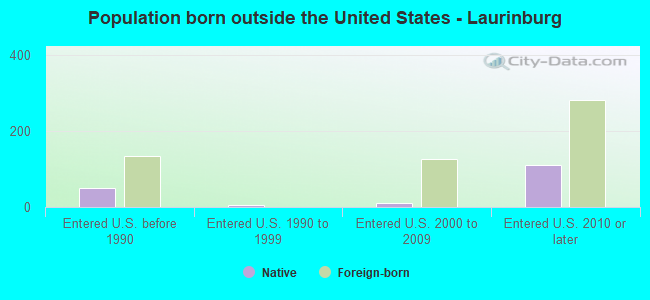
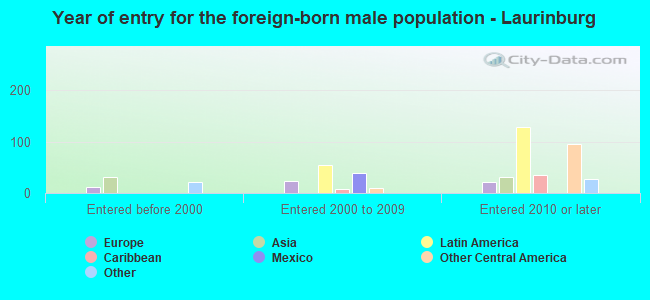
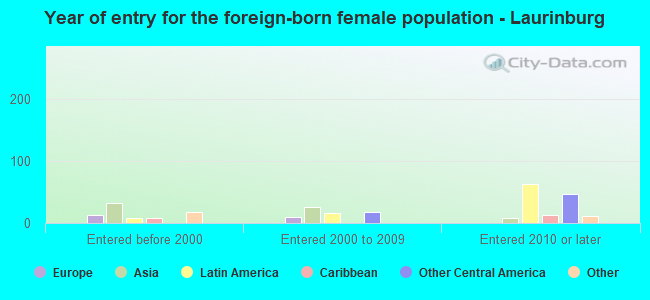
Foreign-born residents in Laurinburg 520 residents are foreign born (1.5% Latin America , 0.8% Asia , 0.5% Europe ).
This city:
3.4%North Carolina:
8.3%
Marital status for residents in Laurinburg Marital status - White (Caucasian) population 15 years and over
Males 25.8% Never married56.0% Now married2.2% Separated5.6% Widowed10.4% DivorcedFemales 23.5% Never married51.2% Now married1.4% Separated14.9% Widowed8.9% DivorcedWomen who gave birth in the past 12 months Now married:
89.3% (72)Unmarried:
10.7% (9)
Women who did not give birth in the past 12 months Now married:
45.7% (450)Unmarried:
54.3% (535)
Marital status - Black or African American population 15 years and over
Males 53.6% Never married22.6% Now married6.0% Separated5.1% Widowed12.7% DivorcedFemales 54.8% Never married15.5% Now married4.3% Separated9.9% Widowed15.5% DivorcedWomen who gave birth in the past 12 months Now married:
15.6% (12)Unmarried:
84.4% (65)
Women who did not give birth in the past 12 months Now married:
13.5% (221)Unmarried:
86.5% (1,417)
Marital status - American Indian / Alaska Native population 15 years and over
Males 46.7% Never married34.9% Now married5.3% Separated0.0% Widowed13.1% DivorcedFemales 47.9% Never married29.1% Now married5.2% Separated15.8% Widowed2.0% DivorcedWomen who gave birth in the past 12 months Now married:
33.3% (16)Unmarried:
66.7% (32)
Women who did not give birth in the past 12 months Now married:
33.6% (115)Unmarried:
66.4% (228)
Marital status - Asian population 15 years and over
Males 19.7% Never married80.3% Now married0.0% Separated0.0% Widowed0.0% DivorcedFemales 31.1% Never married68.9% Now married0.0% Separated0.0% Widowed0.0% DivorcedWomen who did not give birth in the past 12 months Now married:
48.1% (14)Unmarried:
51.9% (15)
Marital status - Other race population 15 years and over
Males 78.1% Never married12.5% Now married0.0% Separated0.0% Widowed9.4% DivorcedFemales 43.0% Never married25.8% Now married0.0% Separated0.0% Widowed31.2% DivorcedWomen who did not give birth in the past 12 months Now married:
29.6% (33)Unmarried:
70.4% (78)
Marital status - Two or more races population 15 years and over
Males 56.2% Never married35.5% Now married0.0% Separated0.0% Widowed8.3% DivorcedFemales 63.8% Never married20.5% Now married5.9% Separated9.7% Widowed0.0% DivorcedWomen who gave birth in the past 12 months Now married:
0.0% (0)Unmarried:
100.0% (8)
Women who did not give birth in the past 12 months Now married:
27.7% (52)Unmarried:
72.3% (135)
Marital status - White alone, not Hispanic / Latino population 15 years and over
Males 25.9% Never married55.7% Now married2.3% Separated5.6% Widowed10.5% DivorcedFemales 24.2% Never married49.9% Now married1.5% Separated15.3% Widowed9.2% DivorcedWomen who gave birth in the past 12 months Now married:
82.7% (43)Unmarried:
17.3% (9)
Women who did not give birth in the past 12 months Now married:
44.6% (445)Unmarried:
55.4% (554)
Marital status - Hispanic or Latino population 15 years and over
Males 56.1% Never married28.6% Now married0.0% Separated0.0% Widowed15.3% DivorcedFemales 38.5% Never married45.5% Now married0.0% Separated4.2% Widowed11.9% DivorcedWomen who gave birth in the past 12 months Now married:
100.0% (35)Unmarried:
0.0% (0)
Women who did not give birth in the past 12 months Now married:
22.6% (23)Unmarried:
77.4% (78)
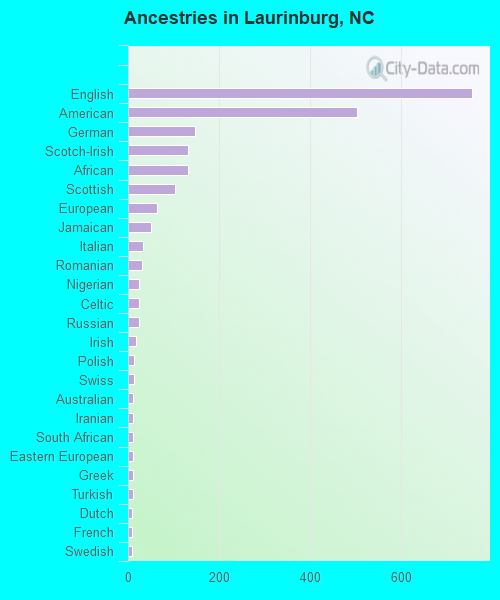
Ancestries in Laurinburg
755 6.5% English503 4.3% American147 1.3% German132 1.1% Scotch-Irish132 1.1% African103 0.9% Scottish64 0.6% European50 0.4% Jamaican32 0.3% Italian31 0.3% Romanian25 0.2% Nigerian24 0.2% Celtic24 0.2% Russian18 0.2% Irish14 0.1% Polish14 0.1% Swiss12 0.1% Australian12 0.1% Iranian12 0.1% South African11 0.09% Eastern European10 0.09% Greek10 0.09% Turkish9 0.08% Dutch9 0.08% French8 0.07% Swedish6 0.05% Hungarian
Children Nativity (place of birth) in Laurinburg
Children under 6 years - Living with two parents Both parents native 402 100.0% NativeOne native, one foreign-born parent 88 100.0% NativeChildren under 6 years - Living with one parent Native parent 809 100.0% NativeForeign-born parent 36 100.0% NativeChildren 6 to 17 years - Living with two parents Both parents native 525 98.2% Native9 1.8% Foreign-bornBoth parents foreign-born 6 100.0% NativeOne native, one foreign-born parent 104 100.0% NativeChildren 6 to 17 years - Living with one parent Native parent 1,462 100.0% NativeForeign-born parent 33 51.0% Native32 49.0% Foreign-born
Grandparents responsible for own grandchildren in Laurinburg
Grandparents (30 to 59 years) White / Caucasian 36 91.3% Responsible for grandchildren3 8.7% Not responsible for grandchildrenBlack or African American 46 74.0% Responsible for grandchildren16 26.0% Not responsible for grandchildrenTwo or more races 19 100.0% Responsible for grandchildrenWhite alone, not Hispanic / Latino 38 91.6% Responsible for grandchildren4 8.4% Not responsible for grandchildrenGrandparents (60 years and over) White / Caucasian 58 63.9% Responsible for grandchildren33 36.1% Not responsible for grandchildrenBlack or African American 27 22.4% Responsible for grandchildren92 77.6% Not responsible for grandchildrenWhite alone, not Hispanic / Latino 31 48.3% Responsible for grandchildren34 51.7% Not responsible for grandchildren