Races in Lawrence, Wisconsin (WI) Detailed Stats
Ancestries, Foreign-born residents, place of birth

Recent posts about races in Lawrence, Wisconsin on our local forum with over 2,400,000 registered users:
 | Does there happen to be any asian areas here? (12 replies) |
| Any parts of Milwaukee that remind you of Chicago? (92 replies) |
| Relocating from Charlotte, NC to Menasha, WI (21 replies) |
| Hospitals in Madison (10 replies) |
| Would you recommend Appleton? (87 replies) |
| Being Black in Wisconsin (Appleton)......... (177 replies) |
0.8% of Lawrence, WI residents are foreign-born , which is 495.4% less than the foreign-born rate of 5.0% across the entire state of Wisconsin.
Race distribution in Lawrence

- 1,51998.1%White alone
- 90.6%American Indian alone
- 70.5%Hispanic
- 50.3%Black alone
- 50.3%Asian alone
- 30.2%Two or more races

2000
2022
-
- 4,681,63087.3%White alone
- 300,2455.6%Black alone
- 192,9213.6%Hispanic
- 87,9951.6%Asian alone
- 51,9211.0%Two or more races
- 43,9800.8%American Indian alone
- 3,6370.07%Other race alone
- 1,3460.03%Native Hawaiian and Other
Pacific Islander alone

-
- 4,654,03179.0%White alone
- 447,0227.6%Hispanic
- 345,6785.9%Black alone
- 217,5323.7%Two or more races
- 172,2422.9%Asian alone
- 33,7620.6%American Indian alone
- 19,6800.3%Other race alone
- 2,5920.04%Native Hawaiian and Other
Pacific Islander alone

Income and house value in Lawrence
- Median household income in 2022
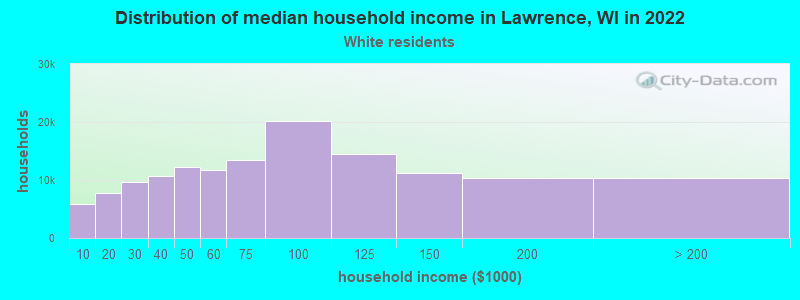
- $103,215White non-Hispanic householders
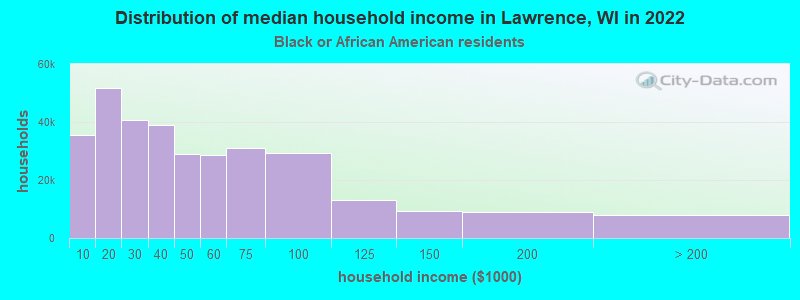
- $42,434Black householders
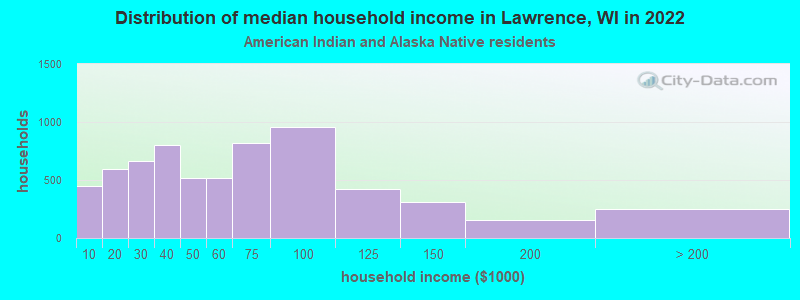
- $46,391American Indian and Alaska Native householders
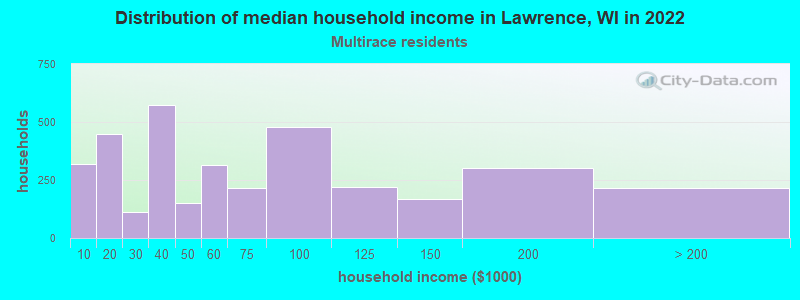
- $31,801Two or more races householders
- $55,835Hispanic or Latino race householders
- Median 2022 house value
- $355,393White Non-Hispanic householders
- $141,029Black or African American householders
Household income for White non-Hispanic householders
Household income for Black householders
Household income for American Indian and Alaska Native householders
Household income for Two or more races householders
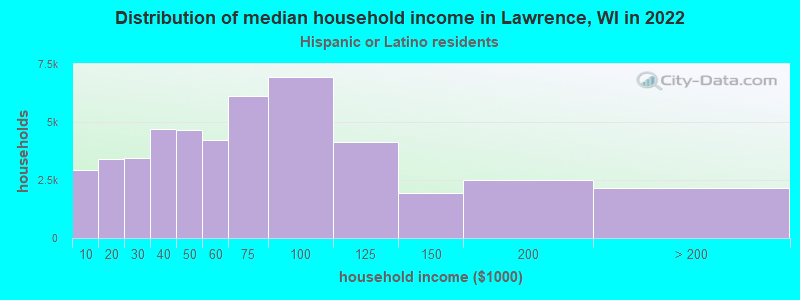
Household income for Hispanic or Latino race householders
Foreign-born residents in Lawrence
13 residents are foreign born
| This city: | 0.8% |
| Wisconsin: | 3.6% |
Ancestries in Lawrence

- 66132.6%German
- 33016.3%Dutch
- 23711.7%Other
- 1989.8%Irish
- 1527.5%Polish
- 1055.2%French
- 703.5%English
- 613.0%Norwegian
- 482.4%United States
- 321.6%French Canadian
- 261.3%Czech
- 231.1%Swedish
- 211.0%Italian
- 190.9%Welsh
- 160.8%Danish
- 110.5%Scottish
- 60.3%Subsaharan African
- 30.1%Russian
- 30.1%Swiss
- 20.10%Scotch-Irish
- 20.10%Slovak
