Races in Lima, Ohio (OH) Detailed Stats
Data:
Races - White alone (%)
Races - White alone (% change since 2000)
Races - Black alone (%)
Races - Black alone (% change since 2000)
Races - American Indian alone (%)
Races - American Indian alone (% change since 2000)
Races - Asian alone (%)
Races - Asian alone (% change since 2000)
Races - Hispanic (%)
Races - Hispanic (% change since 2000)
Races - Native Hawaiian and Other Pacific Islander alone (%)
Races - Native Hawaiian and Other Pacific Islander alone (% change since 2000)
Races - Two or more races(%)
Races - Two or more races(% change since 2000)
Races - Other race alone (%)
Races - Other race alone (% change since 2000)
Racial diversity
Place of birth - Born in state of residence (%)
Place of birth - Born in state of residence (%) - White
Place of birth - Born in state of residence (%) - Black or African American
Place of birth - Born in state of residence (%) - Asian
Place of birth - Born in state of residence (%) - Hispanic or Latino
Place of birth - Born in state of residence (%) - American Indian and Alaska Native
Place of birth - Born in state of residence (%) - Multirace
Place of birth - Born in state of residence (%) - Other Race
Place of birth - Born in other state (%)
Place of birth - Born in other state (%) - White
Place of birth - Born in other state (%) - Black or African American
Place of birth - Born in other state (%) - Asian
Place of birth - Born in other state (%) - Hispanic or Latino
Place of birth - Born in other state (%) - American Indian and Alaska Native
Place of birth - Born in other state (%) - Multirace
Place of birth - Born in other state (%) - Other Race
Place of birth - Native, outside of US (%)
Place of birth - Native, outside of US (%) - White
Place of birth - Native, outside of US (%) - Black or African American
Place of birth - Native, outside of US (%) - Asian
Place of birth - Native, outside of US (%) - Hispanic or Latino
Place of birth - Native, outside of US (%) - American Indian and Alaska Native
Place of birth - Native, outside of US (%) - Multirace
Place of birth - Native, outside of US (%) - Other Race
Place of birth - Foreign born (%)
Place of birth - Foreign born (%) - White
Place of birth - Foreign born (%) - Black or African American
Place of birth - Foreign born (%) - Asian
Place of birth - Foreign born (%) - Hispanic or Latino
Place of birth - Foreign born (%) - American Indian and Alaska Native
Place of birth - Foreign born (%) - Multirace
Place of birth - Foreign born (%) - Other Race
Residents speaking English at home (%)
Residents speaking English at home - Born in the United States (%)
Residents speaking English at home - Native, born elsewhere (%)
Residents speaking English at home - Foreign born (%)
Residents speaking Spanish at home (%)
Residents speaking Spanish at home - Born in the United States (%)
Residents speaking Spanish at home - Native, born elsewhere (%)
Residents speaking Spanish at home - Foreign born (%)
Residents speaking other language at home (%)
Residents speaking other language at home - Born in the United States (%)
Residents speaking other language at home - Native, born elsewhere (%)
Residents speaking other language at home - Foreign born (%)
Marital status - Never married (%)
Marital status - Now married (%)
Marital status - Separated (%)
Marital status - Widowed (%)
Marital status - Divorced (%)
Ancestries Reported - Arab (%)
Ancestries Reported - Czech (%)
Ancestries Reported - Danish (%)
Ancestries Reported - Dutch (%)
Ancestries Reported - English (%)
Ancestries Reported - French (%)
Ancestries Reported - French Canadian (%)
Ancestries Reported - German (%)
Ancestries Reported - Greek (%)
Ancestries Reported - Hungarian (%)
Ancestries Reported - Irish (%)
Ancestries Reported - Italian (%)
Ancestries Reported - Lithuanian (%)
Ancestries Reported - Norwegian (%)
Ancestries Reported - Polish (%)
Ancestries Reported - Portuguese (%)
Ancestries Reported - Russian (%)
Ancestries Reported - Scotch-Irish (%)
Ancestries Reported - Scottish (%)
Ancestries Reported - Slovak (%)
Ancestries Reported - Subsaharan African (%)
Ancestries Reported - Swedish (%)
Ancestries Reported - Swiss (%)
Ancestries Reported - Ukrainian (%)
Ancestries Reported - United States (%)
Ancestries Reported - Welsh (%)
Ancestries Reported - West Indian (%)
Ancestries Reported - Other (%)
Geographical mobility - Same house 1 year ago (%)
Geographical mobility - Same house 1 year ago (%) - White
Geographical mobility - Same house 1 year ago (%) - Black or African American
Geographical mobility - Same house 1 year ago (%) - Asian
Geographical mobility - Same house 1 year ago (%) - Hispanic or Latino
Geographical mobility - Same house 1 year ago (%) - American Indian and Alaska Native
Geographical mobility - Same house 1 year ago (%) - Multirace
Geographical mobility - Same house 1 year ago (%) - Other Race
Geographical mobility - Moved within same county (%)
Geographical mobility - Moved within same county (%) - White
Geographical mobility - Moved within same county (%) - Black or African American
Geographical mobility - Moved within same county (%) - Asian
Geographical mobility - Moved within same county (%) - Hispanic or Latino
Geographical mobility - Moved within same county (%) - American Indian and Alaska Native
Geographical mobility - Moved within same county (%) - Multirace
Geographical mobility - Moved within same county (%) - Other Race
Geographical mobility - Moved from different county within same state (%)
Geographical mobility - Moved from different county within same state (%) - White
Geographical mobility - Moved from different county within same state (%) - Black or African American
Geographical mobility - Moved from different county within same state (%) - Asian
Geographical mobility - Moved from different county within same state (%) - Hispanic or Latino
Geographical mobility - Moved from different county within same state (%) - American Indian and Alaska Native
Geographical mobility - Moved from different county within same state (%) - Multirace
Geographical mobility - Moved from different county within same state (%) - Other Race
Geographical mobility - Moved from different state (%)
Geographical mobility - Moved from different state (%) - White
Geographical mobility - Moved from different state (%) - Black or African American
Geographical mobility - Moved from different state (%) - Asian
Geographical mobility - Moved from different state (%) - Hispanic or Latino
Geographical mobility - Moved from different state (%) - American Indian and Alaska Native
Geographical mobility - Moved from different state (%) - Multirace
Geographical mobility - Moved from different state (%) - Other Race
Geographical mobility - Moved from abroad (%)
Geographical mobility - Moved from abroad (%) - White
Geographical mobility - Moved from abroad (%) - Black or African American
Geographical mobility - Moved from abroad (%) - Asian
Geographical mobility - Moved from abroad (%) - Hispanic or Latino
Geographical mobility - Moved from abroad (%) - American Indian and Alaska Native
Geographical mobility - Moved from abroad (%) - Multirace
Geographical mobility - Moved from abroad (%) - Other Race
Place of birth for the foreign-born population - Ireland (%)
Place of birth for the foreign-born population - Denmark (%)
Place of birth for the foreign-born population - Norway (%)
Place of birth for the foreign-born population - Sweden (%)
Place of birth for the foreign-born population - United Kingdom (%)
Place of birth for the foreign-born population - England (%)
Place of birth for the foreign-born population - Scotland (%)
Place of birth for the foreign-born population - Other Northern Europe (%)
Place of birth for the foreign-born population - Austria (%)
Place of birth for the foreign-born population - Belgium (%)
Place of birth for the foreign-born population - France (%)
Place of birth for the foreign-born population - Germany (%)
Place of birth for the foreign-born population - Netherlands (%)
Place of birth for the foreign-born population - Switzerland (%)
Place of birth for the foreign-born population - Other Western Europe (%)
Place of birth for the foreign-born population - Greece (%)
Place of birth for the foreign-born population - Italy (%)
Place of birth for the foreign-born population - Portugal (%)
Place of birth for the foreign-born population - Spain (%)
Place of birth for the foreign-born population - Other Southern Europe (%)
Place of birth for the foreign-born population - Albania (%)
Place of birth for the foreign-born population - Belarus (%)
Place of birth for the foreign-born population - Bosnia and Herzegovina (%)
Place of birth for the foreign-born population - Bulgaria (%)
Place of birth for the foreign-born population - Croatia (%)
Place of birth for the foreign-born population - Czechoslovakia (%)
Place of birth for the foreign-born population - Hungary (%)
Place of birth for the foreign-born population - Latvia (%)
Place of birth for the foreign-born population - Lithuania (%)
Place of birth for the foreign-born population - North Macedonia (Macedonia) (%)
Place of birth for the foreign-born population - Moldova (%)
Place of birth for the foreign-born population - Poland (%)
Place of birth for the foreign-born population - Romania (%)
Place of birth for the foreign-born population - Russia (%)
Place of birth for the foreign-born population - Serbia (%)
Place of birth for the foreign-born population - Ukraine (%)
Place of birth for the foreign-born population - Other Eastern Europe (%)
Place of birth for the foreign-born population - China (%)
Place of birth for the foreign-born population - Hong Kong (%)
Place of birth for the foreign-born population - Taiwan (%)
Place of birth for the foreign-born population - Japan (%)
Place of birth for the foreign-born population - Korea (%)
Place of birth for the foreign-born population - Other Eastern Asia (%)
Place of birth for the foreign-born population - Afghanistan (%)
Place of birth for the foreign-born population - Bangladesh (%)
Place of birth for the foreign-born population - India (%)
Place of birth for the foreign-born population - Iran (%)
Place of birth for the foreign-born population - Kazakhstan (%)
Place of birth for the foreign-born population - Nepal (%)
Place of birth for the foreign-born population - Pakistan (%)
Place of birth for the foreign-born population - Sri Lanka (%)
Place of birth for the foreign-born population - Uzbekistan (%)
Place of birth for the foreign-born population - Other South Central Asia (%)
Place of birth for the foreign-born population - Burma (%)
Place of birth for the foreign-born population - Cambodia (%)
Place of birth for the foreign-born population - Indonesia (%)
Place of birth for the foreign-born population - Laos (%)
Place of birth for the foreign-born population - Malaysia (%)
Place of birth for the foreign-born population - Philippines (%)
Place of birth for the foreign-born population - Singapore (%)
Place of birth for the foreign-born population - Thailand (%)
Place of birth for the foreign-born population - Vietnam (%)
Place of birth for the foreign-born population - Other South Eastern Asia (%)
Place of birth for the foreign-born population - Armenia (%)
Place of birth for the foreign-born population - Iraq (%)
Place of birth for the foreign-born population - Israel (%)
Place of birth for the foreign-born population - Jordan (%)
Place of birth for the foreign-born population - Kuwait (%)
Place of birth for the foreign-born population - Lebanon (%)
Place of birth for the foreign-born population - Saudi Arabia (%)
Place of birth for the foreign-born population - Syria (%)
Place of birth for the foreign-born population - Turkey (%)
Place of birth for the foreign-born population - Yemen (%)
Place of birth for the foreign-born population - Other Western Asia (%)
Place of birth for the foreign-born population - Eritrea (%)
Place of birth for the foreign-born population - Ethiopia (%)
Place of birth for the foreign-born population - Kenya (%)
Place of birth for the foreign-born population - Somalia (%)
Place of birth for the foreign-born population - Uganda (%)
Place of birth for the foreign-born population - Zimbabwe (%)
Place of birth for the foreign-born population - Other Eastern Africa (%)
Place of birth for the foreign-born population - Cameroon (%)
Place of birth for the foreign-born population - Congo (%)
Place of birth for the foreign-born population - Democratic Republic of Congo (Zaire) (%)
Place of birth for the foreign-born population - Other Middle Africa (%)
Place of birth for the foreign-born population - Egypt (%)
Place of birth for the foreign-born population - Morocco (%)
Place of birth for the foreign-born population - Sudan (%)
Place of birth for the foreign-born population - Other Northern Africa (%)
Place of birth for the foreign-born population - South Africa (%)
Place of birth for the foreign-born population - Other Southern Africa (%)
Place of birth for the foreign-born population - Cabo Verde (%)
Place of birth for the foreign-born population - Ghana (%)
Place of birth for the foreign-born population - Liberia (%)
Place of birth for the foreign-born population - Nigeria (%)
Place of birth for the foreign-born population - Senegal (%)
Place of birth for the foreign-born population - Sierra Leone (%)
Place of birth for the foreign-born population - Other Western Africa (%)
Place of birth for the foreign-born population - Australia (%)
Place of birth for the foreign-born population - New Zealand (%)
Place of birth for the foreign-born population - Fiji (%)
Place of birth for the foreign-born population - Micronesia (%)
Place of birth for the foreign-born population - Bahamas (%)
Place of birth for the foreign-born population - Barbados (%)
Place of birth for the foreign-born population - Cuba (%)
Place of birth for the foreign-born population - Dominica (%)
Place of birth for the foreign-born population - Dominican Republic (%)
Place of birth for the foreign-born population - Grenada (%)
Place of birth for the foreign-born population - Haiti (%)
Place of birth for the foreign-born population - Jamaica (%)
Place of birth for the foreign-born population - St. Vincent and the Grenadines (%)
Place of birth for the foreign-born population - Trinidad and Tobago (%)
Place of birth for the foreign-born population - West Indies (%)
Place of birth for the foreign-born population - Other Caribbean (%)
Place of birth for the foreign-born population - Belize (%)
Place of birth for the foreign-born population - Costa Rica (%)
Place of birth for the foreign-born population - El Salvador (%)
Place of birth for the foreign-born population - Guatemala (%)
Place of birth for the foreign-born population - Honduras (%)
Place of birth for the foreign-born population - Mexico (%)
Place of birth for the foreign-born population - Nicaragua (%)
Place of birth for the foreign-born population - Panama (%)
Place of birth for the foreign-born population - Other Central America (%)
Place of birth for the foreign-born population - Argentina (%)
Place of birth for the foreign-born population - Bolivia (%)
Place of birth for the foreign-born population - Brazil (%)
Place of birth for the foreign-born population - Chile (%)
Place of birth for the foreign-born population - Colombia (%)
Place of birth for the foreign-born population - Ecuador (%)
Place of birth for the foreign-born population - Guyana (%)
Place of birth for the foreign-born population - Peru (%)
Place of birth for the foreign-born population - Uruguay (%)
Place of birth for the foreign-born population - Venezuela (%)
Place of birth for the foreign-born population - Other South America (%)
Place of birth for the foreign-born population - Canada (%)
Place of birth for the foreign-born population - Other Northern America (%)
Place of birth for the foreign-born population - Other (%)
Latest news about races in Lima, OH collected exclusively by city-data.com from local newspapers, TV, and radio stations
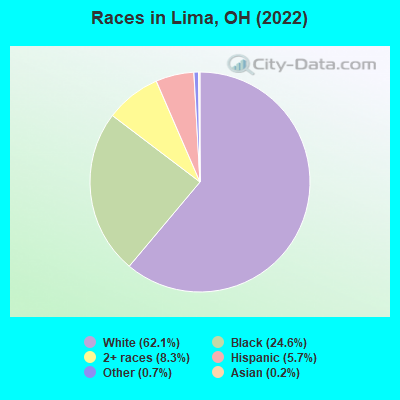
According to 2022 data, the most numerous races in Lima, OH are White alone (21,875 residents), Black alone (8,650 residents), and Two or more races (2,911 residents). 96.4% of Lima residents speak English at home. 1.3% of Lima, OH residents are foreign-born , which is 213.7% less than the foreign-born rate of 4.0% across the entire state of Ohio.
Race distribution in Lima
2000 2022
9,538,111 84.0% White alone 1,290,662 11.4% Black alone 217,123 1.9% Hispanic 137,770 1.2% Two or more races 131,670 1.2% Asian alone 21,985 0.2% American Indian alone 13,483 0.1% Other race alone 2,336 0.02% Native Hawaiian and Other
8,948,793 76.1% White alone 1,401,403 11.9% Black alone 529,291 4.5% Two or more races 517,232 4.4% Hispanic 293,387 2.5% Asian alone 52,805 0.4% Other race alone 9,785 0.08% American Indian alone 3,362 0.03% Native Hawaiian and Other
Income and house value in Lima Median household income in 2022 $43,481 White non-Hispanic householders$47,325 Black householders$41,625 American Indian and Alaska Native householders$34,572 Some other race householders$61,237 Two or more races householders$37,839 Hispanic or Latino race householdersMedian 2022 house value $100,104 White Non-Hispanic householders$75,726 Black or African American householders$44,952 American Indian or Alaska Native householders $102,352 Asian householders$115,838 Some other race householders$142,290 Two or more races householders$102,698 Hispanic or Latino householders
Median age by race in Lima
38.8 Median age for White residents35.4 41.6 38.7 Median age for Black or African American residents31.5 39.8 12.3 Median age for American Indian / Alaska Native residents11.5 62.6 57.4 Median age for Asian residents43.1 56.9 -666,666,666.0 Median age for Native Hawaiian / Pacific Islander residents-666,666,666.0 -666,666,666.0 21.4 Median age for Other race residents37.2 13.7 19.5 Median age for Two or more races residents19.5 18.0 39.8 Median age for White alone residents37.1 41.5 22.6 Median age for Hispanic or Latino residents21.5 43.9
Owner/renter occupied households by race in Lima
House owners and renters - White residents 5,158 53.4% Owner occupied4,507 46.6% Renter occupiedHouse owners and renters - Black or African American residents 1,321 34.5% Owner occupied2,502 65.5% Renter occupiedHouse owners and renters - American Indian / Alaska Native residents 12 68.5% Owner occupied6 31.5% Renter occupiedHouse owners and renters - Asian residents 29 100.0% Owner occupiedHouse owners and renters - Other race residents 79 20.6% Owner occupied306 79.4% Renter occupiedHouse owners and renters - Two or more races residents 267 53.6% Owner occupied231 46.4% Renter occupiedHouse owners and renters - White alone residents 5,162 55.7% Owner occupied4,105 44.3% Renter occupiedHouse owners and renters - Hispanic or Latino residents 73 9.9% Owner occupied662 90.1% Renter occupied
Language usage in Lima
English speakers - Total 96.4% of residents of Lima speak English at home.
2.3% of residents speak Spanish at home 557 72.6% Speak English very well210 27.4% Speak English less than very well1.1% of residents speak other language at home 302 83.9% Speak English very well58 16.1% Speak English less than very well
English speakers - Born in the United States 94.9% of residents of Lima speak English at home.
4.2% of residents speak Spanish at home 255 91.7% Speak English very well23 8.3% Speak English less than very well0.9% of residents speak other language at home 61 100.0% Speak English very well
English speakers - Native, born elsewhere 42.5% of residents of Lima speak English at home.
50.4% of residents speak Spanish at home 25 43.9% Speak English very well32 56.1% Speak English less than very well5.3% of residents speak other language at home 6 100.0% Speak English very well
English speakers - Foreign-born 38.8% of residents of Lima speak English at home.
37.2% of residents speak Spanish at home 106 63.5% Speak English very well61 36.5% Speak English less than very well23.4% of residents speak other language at home 66 62.9% Speak English very well39 37.1% Speak English less than very well
White (Caucasian) - Speak only English Native:
97.8% (21,004)Foreign-born:
100.0% (24)
White (Caucasian) - Speak another language Native:
2.3% (484)Foreign-born:
6.8% (2)
Black or African American - Speak only English Native:
99.2% (7,200)Foreign-born:
64.0% (115)
Black or African American - Speak another language Native:
0.7% (52)Foreign-born:
39.6% (71)
Asian - Speak only English Native:
83.9% (24)Foreign-born:
23.1% (9)
Asian - Speak another language Native:
17.9% (5)Foreign-born:
76.0% (28)
Other race - Speak another language Native:
24.7% (212)Foreign-born:
100.0% (204)
Two or more races - Speak only English Native:
96.1% (3,510)Foreign-born:
84.8% (48)
White alone - Speak only English Native:
97.9% (20,456)Foreign-born:
94.4% (25)
White alone - Speak another language Native:
2.0% (428)Foreign-born:
7.1% (2)
Hispanic or Latino - Speak only English Native:
79.0% (1,296)Foreign-born:
4.5% (8)
Hispanic or Latino - Speak another language Native:
20.1% (330)Foreign-born:
95.8% (172)
Foreign-born residents in Lima 449 residents are foreign born
Marital status for residents in Lima Marital status - White (Caucasian) population 15 years and over
Males 45.5% Never married33.7% Now married2.3% Separated3.6% Widowed14.9% DivorcedFemales 32.9% Never married35.2% Now married3.8% Separated12.1% Widowed16.0% DivorcedWomen who gave birth in the past 12 months Now married:
44.1% (135)Unmarried:
55.9% (171)
Women who did not give birth in the past 12 months Now married:
37.1% (1,839)Unmarried:
62.9% (3,123)
Marital status - Black or African American population 15 years and over
Males 61.6% Never married18.6% Now married1.5% Separated2.9% Widowed15.3% DivorcedFemales 56.2% Never married13.5% Now married2.3% Separated6.4% Widowed21.6% DivorcedWomen who gave birth in the past 12 months Now married:
0.0% (0)Unmarried:
100.0% (161)
Women who did not give birth in the past 12 months Now married:
10.6% (190)Unmarried:
89.4% (1,599)
Marital status - American Indian / Alaska Native population 15 years and over
Males 73.7% Never married26.3% Now married0.0% Separated0.0% Widowed0.0% DivorcedFemales 9.1% Never married0.0% Now married0.0% Separated0.0% Widowed90.9% DivorcedWomen who did not give birth in the past 12 months Now married:
0.0% (0)Unmarried:
100.0% (1)
Marital status - Asian population 15 years and over
Males 0.0% Never married100.0% Now married0.0% Separated0.0% Widowed0.0% DivorcedFemales 0.0% Never married50.0% Now married0.0% Separated0.0% Widowed50.0% DivorcedWomen who did not give birth in the past 12 months Now married:
100.0% (5)Unmarried:
0.0% (0)
Marital status - Other race population 15 years and over
Males 43.1% Never married48.0% Now married5.7% Separated0.0% Widowed3.2% DivorcedFemales 47.9% Never married52.1% Now married0.0% Separated0.0% Widowed0.0% DivorcedWomen who gave birth in the past 12 months Now married:
12.5% (12)Unmarried:
87.5% (83)
Women who did not give birth in the past 12 months Now married:
53.7% (38)Unmarried:
46.3% (33)
Marital status - Two or more races population 15 years and over
Males 70.3% Never married10.2% Now married4.1% Separated4.1% Widowed11.4% DivorcedFemales 68.3% Never married11.9% Now married2.9% Separated5.6% Widowed11.3% DivorcedWomen who gave birth in the past 12 months Now married:
0.0% (0)Unmarried:
100.0% (32)
Women who did not give birth in the past 12 months Now married:
6.9% (61)Unmarried:
93.1% (828)
Marital status - White alone, not Hispanic / Latino population 15 years and over
Males 44.9% Never married34.3% Now married2.2% Separated3.6% Widowed15.0% DivorcedFemales 31.3% Never married35.9% Now married3.9% Separated12.5% Widowed16.4% DivorcedWomen who gave birth in the past 12 months Now married:
44.4% (136)Unmarried:
55.6% (170)
Women who did not give birth in the past 12 months Now married:
38.2% (1,801)Unmarried:
61.8% (2,911)
Marital status - Hispanic or Latino population 15 years and over
Males 58.0% Never married28.6% Now married5.7% Separated1.9% Widowed5.8% DivorcedFemales 60.4% Never married21.8% Now married0.5% Separated6.3% Widowed10.9% DivorcedWomen who gave birth in the past 12 months Now married:
12.2% (10)Unmarried:
87.8% (69)
Women who did not give birth in the past 12 months Now married:
19.8% (87)Unmarried:
80.2% (352)
Ancestries in Lima
2,875 18.5% German1,939 12.5% English1,350 8.7% American1,052 6.8% Irish788 5.1% African409 2.6% Italian273 1.8% European211 1.4% Polish104 0.7% Jamaican89 0.6% Pennsylvania German51 0.3% Scottish50 0.3% Czechoslovakian42 0.3% French37 0.2% Norwegian37 0.2% Romanian36 0.2% Scotch-Irish32 0.2% Russian31 0.2% Welsh29 0.2% Greek23 0.1% Finnish22 0.1% British22 0.1% Nigerian19 0.1% Dutch16 0.1% Czech16 0.1% Swiss14 0.09% Lithuanian12 0.08% Northern European10 0.06% Slovak8 0.05% Egyptian7 0.05% West Indian6 0.04% Serbian5 0.03% Scandinavian4 0.03% Trinidadian and Tobagonian1 0.01% Brazilian
Geographical mobility in Lima Same house 1 year ago 19,173 85.0% White (Caucasian)6,900 79.9% Black or African American49 83.7% American Indian / Alaska Native67 100.0% Asian896 82.0% Other race3,680 93.1% Two or more races18,529 85.5% White alone, not Hispanic / Latino1,479 77.3% Hispanic or LatinoMoved within same county 2,124 9.4% White / Caucasian923 10.7% Black or African American7 12.3% American Indian / Alaska Native146 13.4% Other race257 6.5% Two or more races1,972 9.1% White alone, not Hispanic / Latino279 14.6% Hispanic or LatinoMoved within same state 681 3.0% White / Caucasian316 3.7% Black or African American13 1.2% Other race18 0.5% Two or more races672 3.1% White alone, not Hispanic / Latino41 2.2% Hispanic or LatinoMoved from different state 455 2.0% White / Caucasian62 0.7% Black or African American9 0.8% Other race36 0.9% Two or more races371 1.7% White alone, not Hispanic / Latino71 3.7% Hispanic or LatinoMoved from abroad 46 0.2% White11 0.1% Black or African American46 0.2% White alone, not Hispanic / Latino
Children Nativity (place of birth) in Lima
Children under 6 years - Living with two parents Both parents native 820 100.0% NativeBoth parents foreign-born 12 65.5% Native6 34.5% Foreign-bornChildren under 6 years - Living with one parent Native parent 1,559 100.0% NativeChildren 6 to 17 years - Living with two parents Both parents native 1,643 100.0% NativeBoth parents foreign-born 6 42.5% Native8 57.5% Foreign-bornOne native, one foreign-born parent 179 100.0% NativeChildren 6 to 17 years - Living with one parent Native parent 3,436 100.0% NativeForeign-born parent 9 50.4% Native9 49.6% Foreign-born
Grandparents responsible for own grandchildren in Lima
Grandparents (30 to 59 years) White / Caucasian 65 27.5% Responsible for grandchildren172 72.5% Not responsible for grandchildrenBlack or African American 50 53.7% Responsible for grandchildren43 46.3% Not responsible for grandchildrenWhite alone, not Hispanic / Latino 51 29.5% Responsible for grandchildren122 70.5% Not responsible for grandchildrenHispanic or Latino 10 39.7% Responsible for grandchildren15 60.3% Not responsible for grandchildrenGrandparents (60 years and over) White / Caucasian 89 56.0% Responsible for grandchildren70 44.0% Not responsible for grandchildrenBlack or African American 39 67.3% Responsible for grandchildren19 32.7% Not responsible for grandchildrenWhite alone, not Hispanic / Latino 89 56.0% Responsible for grandchildren70 44.0% Not responsible for grandchildrenHispanic or Latino 1 15.1% Responsible for grandchildren4 84.9% Not responsible for grandchildren