Races in Lowell, Indiana (IN) Detailed Stats
Data:
Races - White alone (%)
Races - White alone (% change since 2000)
Races - Black alone (%)
Races - Black alone (% change since 2000)
Races - American Indian alone (%)
Races - American Indian alone (% change since 2000)
Races - Asian alone (%)
Races - Asian alone (% change since 2000)
Races - Hispanic (%)
Races - Hispanic (% change since 2000)
Races - Native Hawaiian and Other Pacific Islander alone (%)
Races - Native Hawaiian and Other Pacific Islander alone (% change since 2000)
Races - Two or more races(%)
Races - Two or more races(% change since 2000)
Races - Other race alone (%)
Races - Other race alone (% change since 2000)
Racial diversity
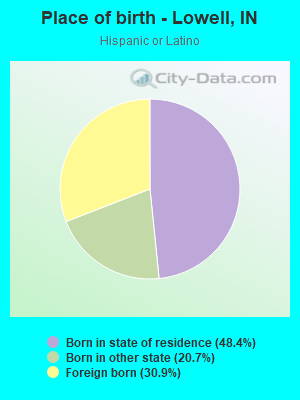
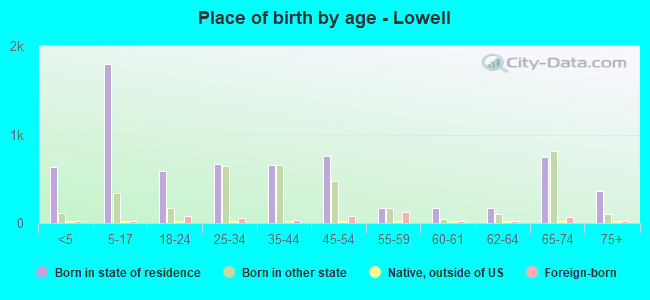
Place of birth - Born in state of residence (%)
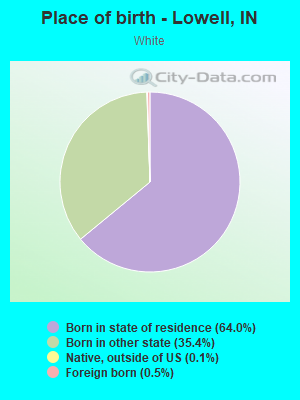
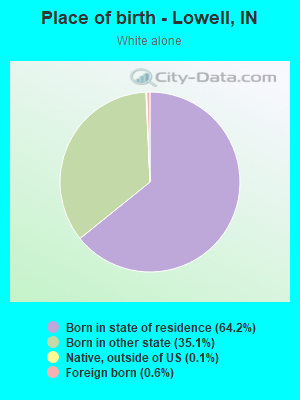
Place of birth - Born in state of residence (%) - White
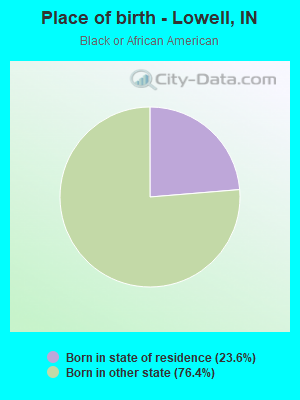
Place of birth - Born in state of residence (%) - Black or African American
Place of birth - Born in state of residence (%) - Asian
Place of birth - Born in state of residence (%) - Hispanic or Latino
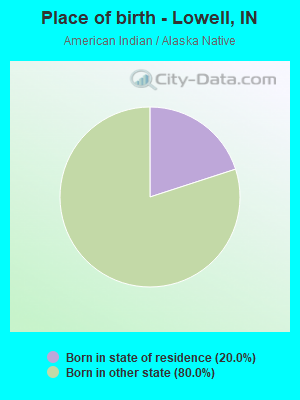
Place of birth - Born in state of residence (%) - American Indian and Alaska Native
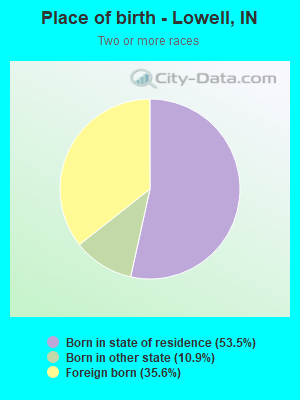
Place of birth - Born in state of residence (%) - Multirace
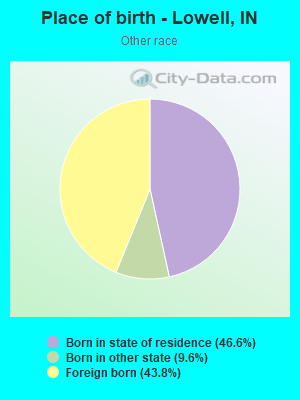
Place of birth - Born in state of residence (%) - Other Race
Place of birth - Born in other state (%)
Place of birth - Born in other state (%) - White
Place of birth - Born in other state (%) - Black or African American
Place of birth - Born in other state (%) - Asian
Place of birth - Born in other state (%) - Hispanic or Latino
Place of birth - Born in other state (%) - American Indian and Alaska Native
Place of birth - Born in other state (%) - Multirace
Place of birth - Born in other state (%) - Other Race
Place of birth - Native, outside of US (%)
Place of birth - Native, outside of US (%) - White
Place of birth - Native, outside of US (%) - Black or African American
Place of birth - Native, outside of US (%) - Asian
Place of birth - Native, outside of US (%) - Hispanic or Latino
Place of birth - Native, outside of US (%) - American Indian and Alaska Native
Place of birth - Native, outside of US (%) - Multirace
Place of birth - Native, outside of US (%) - Other Race
Place of birth - Foreign born (%)
Place of birth - Foreign born (%) - White
Place of birth - Foreign born (%) - Black or African American
Place of birth - Foreign born (%) - Asian
Place of birth - Foreign born (%) - Hispanic or Latino
Place of birth - Foreign born (%) - American Indian and Alaska Native
Place of birth - Foreign born (%) - Multirace
Place of birth - Foreign born (%) - Other Race
Residents speaking English at home (%)
Residents speaking English at home - Born in the United States (%)
Residents speaking English at home - Native, born elsewhere (%)
Residents speaking English at home - Foreign born (%)
Residents speaking Spanish at home (%)
Residents speaking Spanish at home - Born in the United States (%)
Residents speaking Spanish at home - Native, born elsewhere (%)
Residents speaking Spanish at home - Foreign born (%)
Residents speaking other language at home (%)
Residents speaking other language at home - Born in the United States (%)
Residents speaking other language at home - Native, born elsewhere (%)
Residents speaking other language at home - Foreign born (%)
Marital status - Never married (%)
Marital status - Now married (%)
Marital status - Separated (%)
Marital status - Widowed (%)
Marital status - Divorced (%)
Ancestries Reported - Arab (%)
Ancestries Reported - Czech (%)
Ancestries Reported - Danish (%)
Ancestries Reported - Dutch (%)
Ancestries Reported - English (%)
Ancestries Reported - French (%)
Ancestries Reported - French Canadian (%)
Ancestries Reported - German (%)
Ancestries Reported - Greek (%)
Ancestries Reported - Hungarian (%)
Ancestries Reported - Irish (%)
Ancestries Reported - Italian (%)
Ancestries Reported - Lithuanian (%)
Ancestries Reported - Norwegian (%)
Ancestries Reported - Polish (%)
Ancestries Reported - Portuguese (%)
Ancestries Reported - Russian (%)
Ancestries Reported - Scotch-Irish (%)
Ancestries Reported - Scottish (%)
Ancestries Reported - Slovak (%)
Ancestries Reported - Subsaharan African (%)
Ancestries Reported - Swedish (%)
Ancestries Reported - Swiss (%)
Ancestries Reported - Ukrainian (%)
Ancestries Reported - United States (%)
Ancestries Reported - Welsh (%)
Ancestries Reported - West Indian (%)
Ancestries Reported - Other (%)
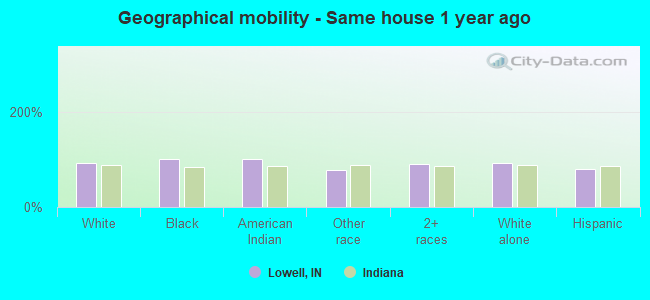
Geographical mobility - Same house 1 year ago (%)
Geographical mobility - Same house 1 year ago (%) - White
Geographical mobility - Same house 1 year ago (%) - Black or African American
Geographical mobility - Same house 1 year ago (%) - Asian
Geographical mobility - Same house 1 year ago (%) - Hispanic or Latino
Geographical mobility - Same house 1 year ago (%) - American Indian and Alaska Native
Geographical mobility - Same house 1 year ago (%) - Multirace
Geographical mobility - Same house 1 year ago (%) - Other Race
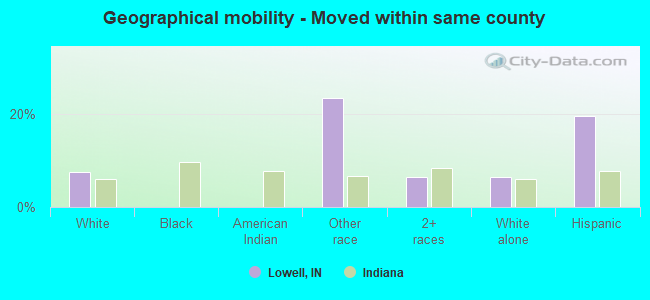
Geographical mobility - Moved within same county (%)
Geographical mobility - Moved within same county (%) - White
Geographical mobility - Moved within same county (%) - Black or African American
Geographical mobility - Moved within same county (%) - Asian
Geographical mobility - Moved within same county (%) - Hispanic or Latino
Geographical mobility - Moved within same county (%) - American Indian and Alaska Native
Geographical mobility - Moved within same county (%) - Multirace
Geographical mobility - Moved within same county (%) - Other Race
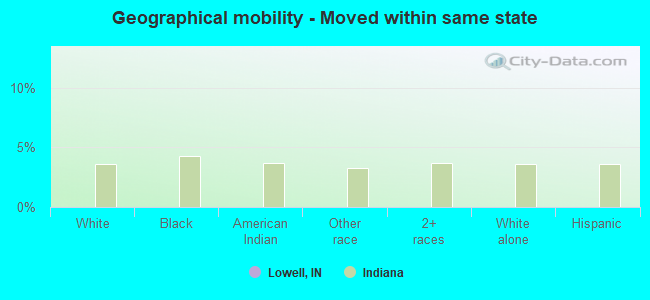
Geographical mobility - Moved from different county within same state (%)
Geographical mobility - Moved from different county within same state (%) - White
Geographical mobility - Moved from different county within same state (%) - Black or African American
Geographical mobility - Moved from different county within same state (%) - Asian
Geographical mobility - Moved from different county within same state (%) - Hispanic or Latino
Geographical mobility - Moved from different county within same state (%) - American Indian and Alaska Native
Geographical mobility - Moved from different county within same state (%) - Multirace
Geographical mobility - Moved from different county within same state (%) - Other Race
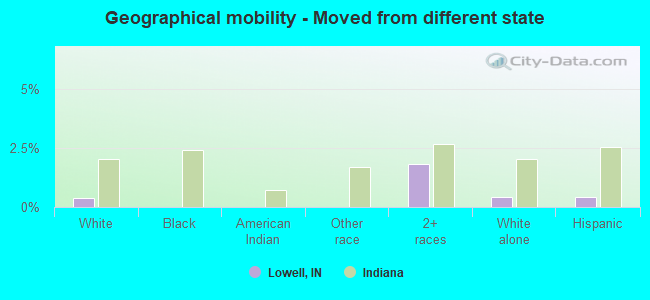
Geographical mobility - Moved from different state (%)
Geographical mobility - Moved from different state (%) - White
Geographical mobility - Moved from different state (%) - Black or African American
Geographical mobility - Moved from different state (%) - Asian
Geographical mobility - Moved from different state (%) - Hispanic or Latino
Geographical mobility - Moved from different state (%) - American Indian and Alaska Native
Geographical mobility - Moved from different state (%) - Multirace
Geographical mobility - Moved from different state (%) - Other Race
Geographical mobility - Moved from abroad (%)
Geographical mobility - Moved from abroad (%) - White
Geographical mobility - Moved from abroad (%) - Black or African American
Geographical mobility - Moved from abroad (%) - Asian
Geographical mobility - Moved from abroad (%) - Hispanic or Latino
Geographical mobility - Moved from abroad (%) - American Indian and Alaska Native
Geographical mobility - Moved from abroad (%) - Multirace
Geographical mobility - Moved from abroad (%) - Other Race
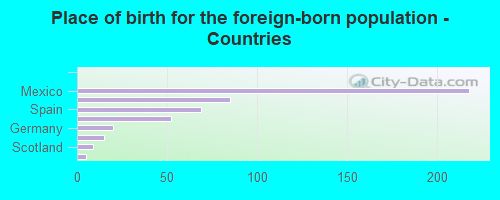
Place of birth for the foreign-born population - Ireland (%)
Place of birth for the foreign-born population - Denmark (%)
Place of birth for the foreign-born population - Norway (%)
Place of birth for the foreign-born population - Sweden (%)
Place of birth for the foreign-born population - United Kingdom (%)
Place of birth for the foreign-born population - England (%)
Place of birth for the foreign-born population - Scotland (%)
Place of birth for the foreign-born population - Other Northern Europe (%)
Place of birth for the foreign-born population - Austria (%)
Place of birth for the foreign-born population - Belgium (%)
Place of birth for the foreign-born population - France (%)
Place of birth for the foreign-born population - Germany (%)
Place of birth for the foreign-born population - Netherlands (%)
Place of birth for the foreign-born population - Switzerland (%)
Place of birth for the foreign-born population - Other Western Europe (%)
Place of birth for the foreign-born population - Greece (%)
Place of birth for the foreign-born population - Italy (%)
Place of birth for the foreign-born population - Portugal (%)
Place of birth for the foreign-born population - Spain (%)
Place of birth for the foreign-born population - Other Southern Europe (%)
Place of birth for the foreign-born population - Albania (%)
Place of birth for the foreign-born population - Belarus (%)
Place of birth for the foreign-born population - Bosnia and Herzegovina (%)
Place of birth for the foreign-born population - Bulgaria (%)
Place of birth for the foreign-born population - Croatia (%)
Place of birth for the foreign-born population - Czechoslovakia (%)
Place of birth for the foreign-born population - Hungary (%)
Place of birth for the foreign-born population - Latvia (%)
Place of birth for the foreign-born population - Lithuania (%)
Place of birth for the foreign-born population - North Macedonia (Macedonia) (%)
Place of birth for the foreign-born population - Moldova (%)
Place of birth for the foreign-born population - Poland (%)
Place of birth for the foreign-born population - Romania (%)
Place of birth for the foreign-born population - Russia (%)
Place of birth for the foreign-born population - Serbia (%)
Place of birth for the foreign-born population - Ukraine (%)
Place of birth for the foreign-born population - Other Eastern Europe (%)
Place of birth for the foreign-born population - China (%)
Place of birth for the foreign-born population - Hong Kong (%)
Place of birth for the foreign-born population - Taiwan (%)
Place of birth for the foreign-born population - Japan (%)
Place of birth for the foreign-born population - Korea (%)
Place of birth for the foreign-born population - Other Eastern Asia (%)
Place of birth for the foreign-born population - Afghanistan (%)
Place of birth for the foreign-born population - Bangladesh (%)
Place of birth for the foreign-born population - India (%)
Place of birth for the foreign-born population - Iran (%)
Place of birth for the foreign-born population - Kazakhstan (%)
Place of birth for the foreign-born population - Nepal (%)
Place of birth for the foreign-born population - Pakistan (%)
Place of birth for the foreign-born population - Sri Lanka (%)
Place of birth for the foreign-born population - Uzbekistan (%)
Place of birth for the foreign-born population - Other South Central Asia (%)
Place of birth for the foreign-born population - Burma (%)
Place of birth for the foreign-born population - Cambodia (%)
Place of birth for the foreign-born population - Indonesia (%)
Place of birth for the foreign-born population - Laos (%)
Place of birth for the foreign-born population - Malaysia (%)
Place of birth for the foreign-born population - Philippines (%)
Place of birth for the foreign-born population - Singapore (%)
Place of birth for the foreign-born population - Thailand (%)
Place of birth for the foreign-born population - Vietnam (%)
Place of birth for the foreign-born population - Other South Eastern Asia (%)
Place of birth for the foreign-born population - Armenia (%)
Place of birth for the foreign-born population - Iraq (%)
Place of birth for the foreign-born population - Israel (%)
Place of birth for the foreign-born population - Jordan (%)
Place of birth for the foreign-born population - Kuwait (%)
Place of birth for the foreign-born population - Lebanon (%)
Place of birth for the foreign-born population - Saudi Arabia (%)
Place of birth for the foreign-born population - Syria (%)
Place of birth for the foreign-born population - Turkey (%)
Place of birth for the foreign-born population - Yemen (%)
Place of birth for the foreign-born population - Other Western Asia (%)
Place of birth for the foreign-born population - Eritrea (%)
Place of birth for the foreign-born population - Ethiopia (%)
Place of birth for the foreign-born population - Kenya (%)
Place of birth for the foreign-born population - Somalia (%)
Place of birth for the foreign-born population - Uganda (%)
Place of birth for the foreign-born population - Zimbabwe (%)
Place of birth for the foreign-born population - Other Eastern Africa (%)
Place of birth for the foreign-born population - Cameroon (%)
Place of birth for the foreign-born population - Congo (%)
Place of birth for the foreign-born population - Democratic Republic of Congo (Zaire) (%)
Place of birth for the foreign-born population - Other Middle Africa (%)
Place of birth for the foreign-born population - Egypt (%)
Place of birth for the foreign-born population - Morocco (%)
Place of birth for the foreign-born population - Sudan (%)
Place of birth for the foreign-born population - Other Northern Africa (%)
Place of birth for the foreign-born population - South Africa (%)
Place of birth for the foreign-born population - Other Southern Africa (%)
Place of birth for the foreign-born population - Cabo Verde (%)
Place of birth for the foreign-born population - Ghana (%)
Place of birth for the foreign-born population - Liberia (%)
Place of birth for the foreign-born population - Nigeria (%)
Place of birth for the foreign-born population - Senegal (%)
Place of birth for the foreign-born population - Sierra Leone (%)
Place of birth for the foreign-born population - Other Western Africa (%)
Place of birth for the foreign-born population - Australia (%)
Place of birth for the foreign-born population - New Zealand (%)
Place of birth for the foreign-born population - Fiji (%)
Place of birth for the foreign-born population - Micronesia (%)
Place of birth for the foreign-born population - Bahamas (%)
Place of birth for the foreign-born population - Barbados (%)
Place of birth for the foreign-born population - Cuba (%)
Place of birth for the foreign-born population - Dominica (%)
Place of birth for the foreign-born population - Dominican Republic (%)
Place of birth for the foreign-born population - Grenada (%)
Place of birth for the foreign-born population - Haiti (%)
Place of birth for the foreign-born population - Jamaica (%)
Place of birth for the foreign-born population - St. Vincent and the Grenadines (%)
Place of birth for the foreign-born population - Trinidad and Tobago (%)
Place of birth for the foreign-born population - West Indies (%)
Place of birth for the foreign-born population - Other Caribbean (%)
Place of birth for the foreign-born population - Belize (%)
Place of birth for the foreign-born population - Costa Rica (%)
Place of birth for the foreign-born population - El Salvador (%)
Place of birth for the foreign-born population - Guatemala (%)
Place of birth for the foreign-born population - Honduras (%)
Place of birth for the foreign-born population - Mexico (%)
Place of birth for the foreign-born population - Nicaragua (%)
Place of birth for the foreign-born population - Panama (%)
Place of birth for the foreign-born population - Other Central America (%)
Place of birth for the foreign-born population - Argentina (%)
Place of birth for the foreign-born population - Bolivia (%)
Place of birth for the foreign-born population - Brazil (%)
Place of birth for the foreign-born population - Chile (%)
Place of birth for the foreign-born population - Colombia (%)
Place of birth for the foreign-born population - Ecuador (%)
Place of birth for the foreign-born population - Guyana (%)
Place of birth for the foreign-born population - Peru (%)
Place of birth for the foreign-born population - Uruguay (%)
Place of birth for the foreign-born population - Venezuela (%)
Place of birth for the foreign-born population - Other South America (%)
Place of birth for the foreign-born population - Canada (%)
Place of birth for the foreign-born population - Other Northern America (%)
Place of birth for the foreign-born population - Other (%)
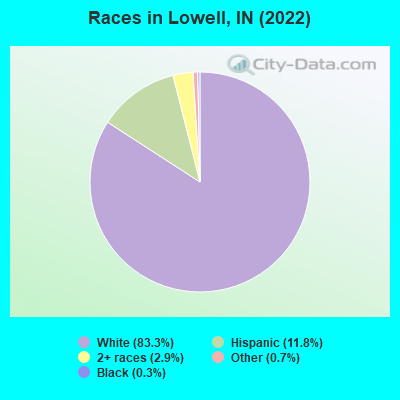
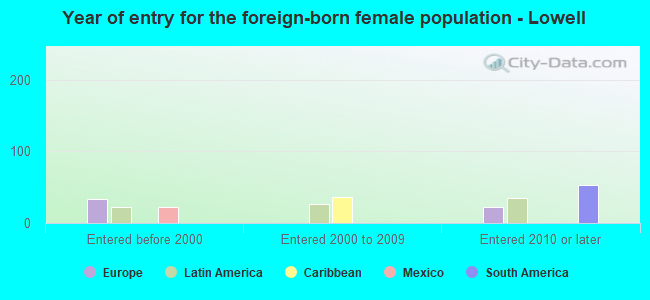
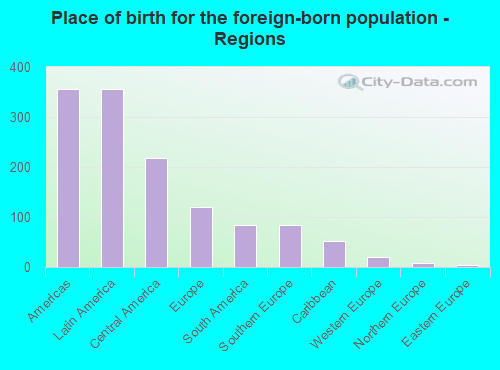
According to 2022 data, the most numerous races in Lowell, IN are White alone (8,963 residents), Black alone (28 residents), and Hispanic (1,275 residents). 93.0% of Lowell residents speak English at home. 4.4% of Lowell, IN residents are foreign-born (3.0% born in Latin America, 1.0% born in Europe), which is 35.4% less than the foreign-born rate of 6.0% across the entire state of Indiana.
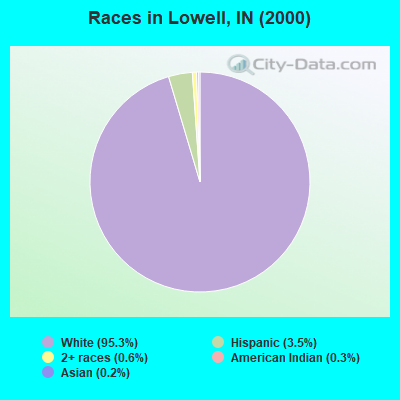
Race distribution in Lowell
2000 2022
5,219,373 85.8% White alone 505,462 8.3% Black alone 214,536 3.5% Hispanic 61,115 1.0% Two or more races 58,424 1.0% Asian alone 13,654 0.2% American Indian alone 6,348 0.1% Other race alone 1,573 0.03% Native Hawaiian and Other
5,192,455 76.0% White alone 628,054 9.2% Black alone 534,528 7.8% Hispanic 263,242 3.9% Two or more races 172,880 2.5% Asian alone 33,467 0.5% Other race alone 5,866 0.09% American Indian alone 2,545 0.04% Native Hawaiian and Other
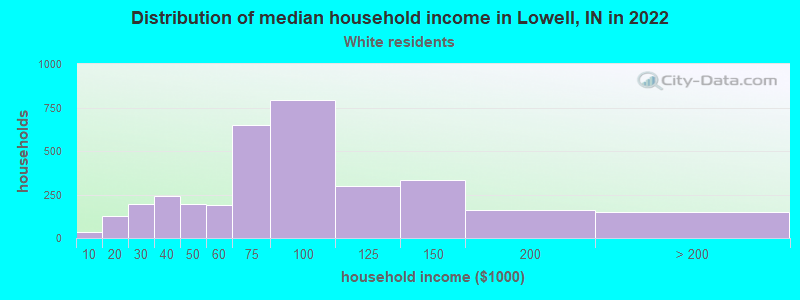
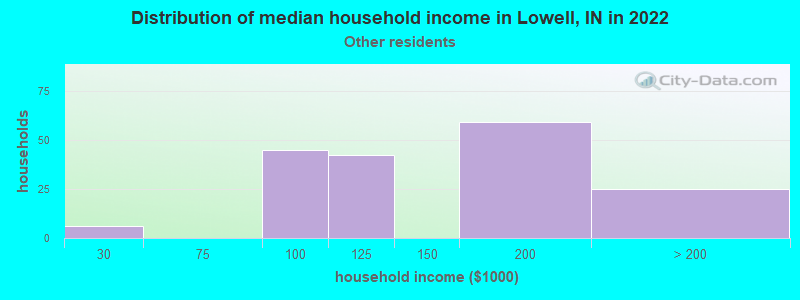
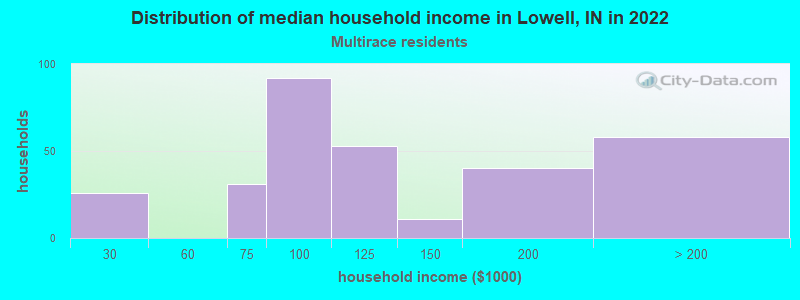
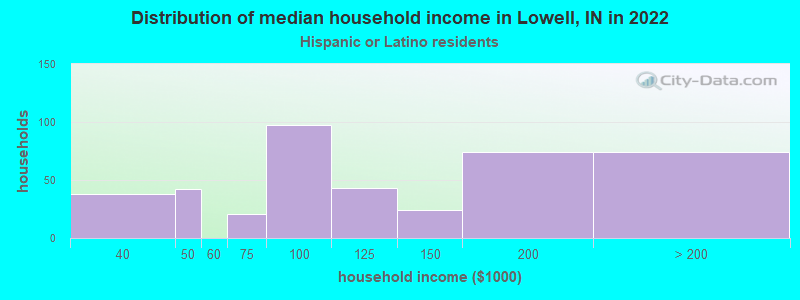
Income and house value in Lowell Median household income in 2022 $73,287 White non-Hispanic householders$113,097 Some other race householders$112,508 Hispanic or Latino race householdersMedian 2022 house value $239,666 White Non-Hispanic householders$179,802 American Indian or Alaska Native householders$62,825 Some other race householders$231,839 Hispanic or Latino householders
Median age by race in Lowell
39.0 Median age for White residents36.8 39.5 -649,669,498.9 Median age for Black or African American residents-639,751,552.2 -650,580,875.1 19.6 Median age for American Indian / Alaska Native residents-531,041,069.2 5.5 -758,738,277.2 Median age for Asian residents-689,473,683.5 -769,607,842.4 -664,335,663.7 Median age for Native Hawaiian / Pacific Islander residents-644,025,156.6 -664,437,011.6 61.9 Median age for Other race residents47.3 72.4 32.3 Median age for Two or more races residents36.9 30.2 38.3 Median age for White alone residents37.3 39.2 35.7 Median age for Hispanic or Latino residents36.1 33.1
Owner/renter occupied households by race in Lowell
House owners and renters - White residents 2,777 83.4% Owner occupied551 16.6% Renter occupiedHouse owners and renters - American Indian / Alaska Native residents 24 100.0% Owner occupiedHouse owners and renters - Other race residents 150 79.2% Owner occupied39 20.8% Renter occupiedHouse owners and renters - Two or more races residents 258 82.4% Owner occupied55 17.6% Renter occupiedHouse owners and renters - White alone residents 2,834 84.7% Owner occupied513 15.3% Renter occupiedHouse owners and renters - Hispanic or Latino residents 293 68.8% Owner occupied133 31.2% Renter occupied
Language usage in Lowell
English speakers - Total 93.0% of residents of Lowell speak English at home.
4.6% of residents speak Spanish at home 397 86.3% Speak English very well63 13.7% Speak English less than very well1.2% of residents speak other language at home 105 85.4% Speak English very well18 14.6% Speak English less than very well
English speakers - Born in the United States 96.3% of residents of Lowell speak English at home.
1.4% of residents speak Spanish at home 15 30.6% Speak English very well34 69.4% Speak English less than very well1.0% of residents speak other language at home 34 100.0% Speak English very well
English speakers - Native, born elsewhere 88.9% of residents of Lowell speak English at home.
English speakers - Foreign-born 10.6% of residents of Lowell speak English at home.
83.5% of residents speak Spanish at home 363 94.0% Speak English very well23 6.0% Speak English less than very well6.1% of residents speak other language at home 12 42.9% Speak English very well16 57.1% Speak English less than very well
White (Caucasian) - Speak only English Native:
98.8% (8,214)Foreign-born:
39.1% (16)
White (Caucasian) - Speak another language Native:
1.4% (120)Foreign-born:
55.6% (23)
Two or more races - Speak only English Native:
86.7% (640)Foreign-born:
8.2% (39)
White alone - Speak only English Native:
97.8% (8,110)Foreign-born:
30.2% (15)
White alone - Speak another language Native:
1.6% (130)Foreign-born:
61.2% (31)
Hispanic or Latino - Speak only English Native:
92.5% (736)Foreign-born:
6.2% (25)
Hispanic or Latino - Speak another language Native:
4.4% (35)Foreign-born:
93.8% (372)
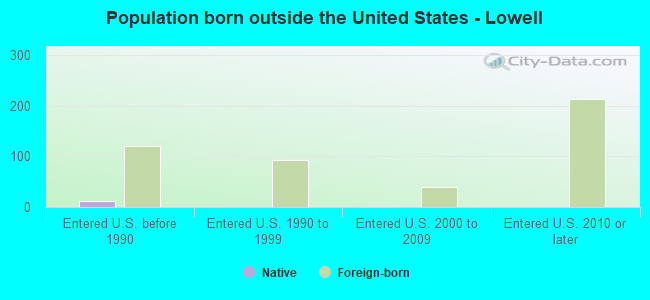
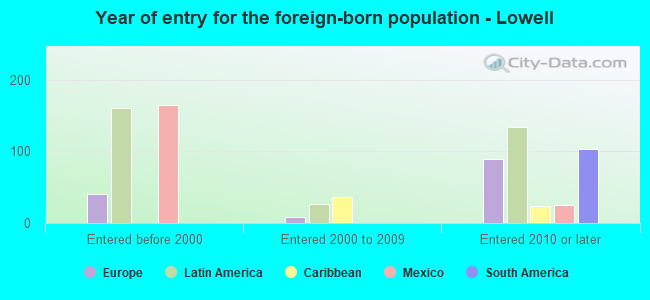
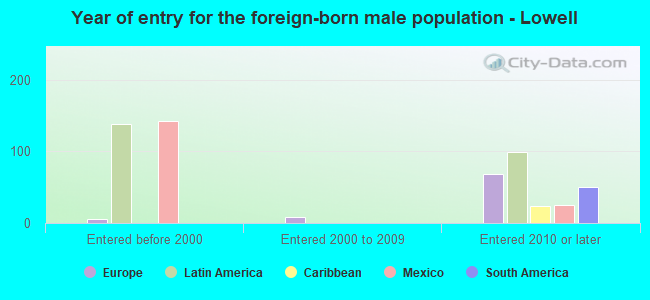
Foreign-born residents in Lowell 477 residents are foreign born (3.0% Latin America , 1.0% Europe ).
This city:
4.4%Indiana:
5.6%
Marital status for residents in Lowell Marital status - White (Caucasian) population 15 years and over
Males 34.0% Never married58.1% Now married0.0% Separated4.6% Widowed3.4% DivorcedFemales 21.7% Never married54.9% Now married1.5% Separated9.4% Widowed12.5% DivorcedWomen who gave birth in the past 12 months Now married:
81.9% (64)Unmarried:
18.1% (14)
Women who did not give birth in the past 12 months Now married:
56.5% (1,069)Unmarried:
43.5% (824)
Marital status - American Indian / Alaska Native population 15 years and over
Males 0.0% Never married100.0% Now married0.0% Separated0.0% Widowed0.0% DivorcedFemales 0.0% Never married100.0% Now married0.0% Separated0.0% Widowed0.0% DivorcedWomen who did not give birth in the past 12 months Now married:
100.0% (38)Unmarried:
0.0% (0)
Marital status - Other race population 15 years and over
Males 38.7% Never married55.9% Now married0.0% Separated5.4% Widowed0.0% DivorcedFemales 22.9% Never married54.8% Now married0.0% Separated0.0% Widowed22.3% DivorcedWomen who gave birth in the past 12 months Now married:
100.0% (6)Unmarried:
0.0% (0)
Women who did not give birth in the past 12 months Now married:
0.0% (0)Unmarried:
100.0% (20)
Marital status - Two or more races population 15 years and over
Males 39.8% Never married47.8% Now married0.0% Separated0.0% Widowed12.4% DivorcedFemales 47.2% Never married39.0% Now married0.0% Separated6.4% Widowed7.4% DivorcedWomen who gave birth in the past 12 months Now married:
0.0% (0)Unmarried:
100.0% (43)
Women who did not give birth in the past 12 months Now married:
38.3% (141)Unmarried:
61.7% (228)
Marital status - White alone, not Hispanic / Latino population 15 years and over
Males 33.4% Never married60.4% Now married0.0% Separated2.7% Widowed3.5% DivorcedFemales 19.9% Never married56.8% Now married1.5% Separated9.7% Widowed12.1% DivorcedWomen who gave birth in the past 12 months Now married:
81.9% (66)Unmarried:
18.1% (15)
Women who did not give birth in the past 12 months Now married:
60.3% (1,107)Unmarried:
39.7% (729)
Marital status - Hispanic or Latino population 15 years and over
Males 43.6% Never married36.4% Now married0.0% Separated12.2% Widowed7.7% DivorcedFemales 42.6% Never married38.1% Now married0.0% Separated0.0% Widowed19.4% DivorcedWomen who gave birth in the past 12 months Now married:
100.0% (6)Unmarried:
0.0% (0)
Women who did not give birth in the past 12 months Now married:
19.5% (65)Unmarried:
80.5% (269)
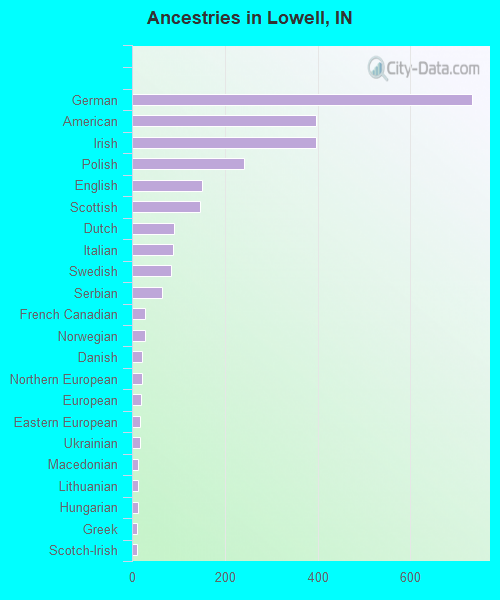
Ancestries in Lowell
733 22.3% German396 12.0% American396 12.0% Irish242 7.4% Polish151 4.6% English146 4.4% Scottish91 2.8% Dutch88 2.7% Italian84 2.6% Swedish64 1.9% Serbian29 0.9% French Canadian28 0.9% Norwegian22 0.7% Danish22 0.7% Northern European20 0.6% European18 0.5% Eastern European17 0.5% Ukrainian14 0.4% Macedonian13 0.4% Lithuanian12 0.4% Hungarian11 0.3% Greek11 0.3% Scotch-Irish
Children Nativity (place of birth) in Lowell
Children under 6 years - Living with two parents Both parents native 667 100.0% NativeChildren under 6 years - Living with one parent Native parent 106 100.0% NativeChildren 6 to 17 years - Living with two parents Both parents native 1,641 100.0% NativeChildren 6 to 17 years - Living with one parent Native parent 224 91.4% Native21 8.6% Foreign-bornForeign-born parent 20 100.0% Native
Grandparents responsible for own grandchildren in Lowell
Grandparents (30 to 59 years) White / Caucasian 56 54.6% Responsible for grandchildren46 45.4% Not responsible for grandchildrenOther race 63 89.3% Responsible for grandchildren8 10.7% Not responsible for grandchildrenWhite alone, not Hispanic / Latino 58 53.9% Responsible for grandchildren49 46.1% Not responsible for grandchildrenHispanic or Latino 70 100.0% Responsible for grandchildrenGrandparents (60 years and over) White / Caucasian 37 7.8% Responsible for grandchildren442 92.2% Not responsible for grandchildrenWhite alone, not Hispanic / Latino 40 8.5% Responsible for grandchildren432 91.5% Not responsible for grandchildren