Races in Lower Trinity, California (CA) Detailed Stats
Ancestries, Foreign-born residents, place of birth
Race distribution in Lower Trinity

- 1,76084.8%White alone
- 1487.1%American Indian alone
- 964.6%Two or more races
- 612.9%Hispanic
- 40.2%Asian alone
- 40.2%Native Hawaiian and Other
Pacific Islander alone - 30.1%Black alone

2000
2022
-
- 15,816,79046.7%White alone
- 10,966,55632.4%Hispanic
- 3,648,86010.8%Asian alone
- 2,181,9266.4%Black alone
- 903,1152.7%Two or more races
- 178,9840.5%American Indian alone
- 103,7360.3%Native Hawaiian and Other
Pacific Islander alone - 71,6810.2%Other race alone

-
- 15,732,18440.3%Hispanic
- 13,160,42633.7%White alone
- 5,957,86715.3%Asian alone
- 2,025,2185.2%Black alone
- 1,663,2224.3%Two or more races
- 251,6180.6%Other race alone
- 135,7770.3%Native Hawaiian and Other
Pacific Islander alone - 103,0300.3%American Indian alone

Income and house value in Lower Trinity
- Median household income in 2022
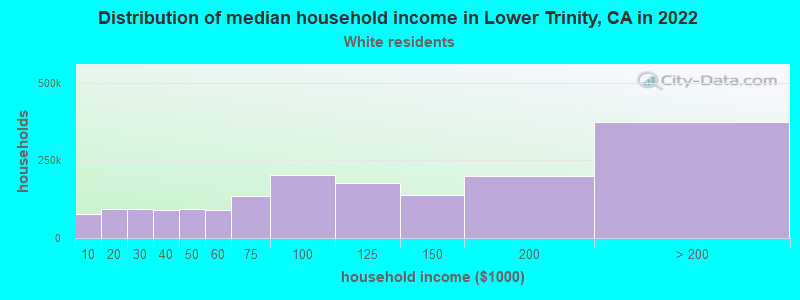
- $50,544White non-Hispanic householders
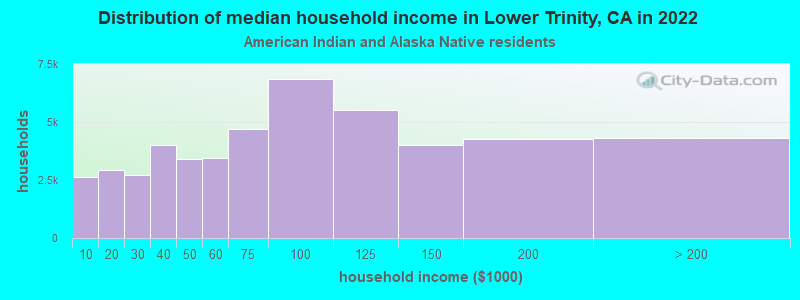
- $50,719American Indian and Alaska Native householders
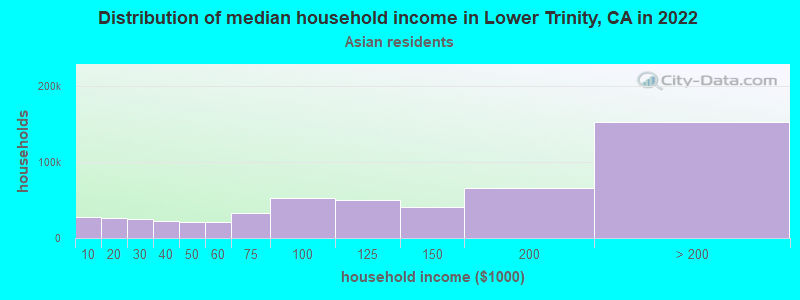
- $64,118Asian householders
- $47,915Some other race householders
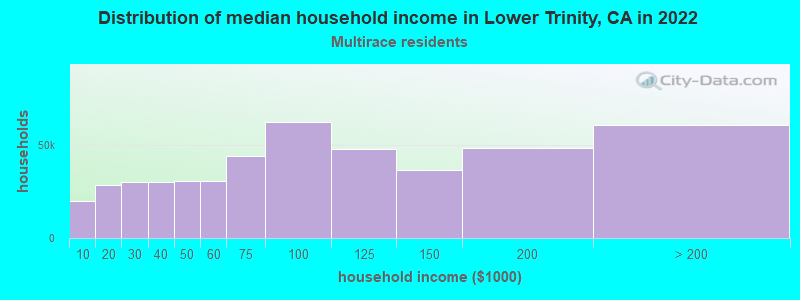
- $36,053Two or more races householders
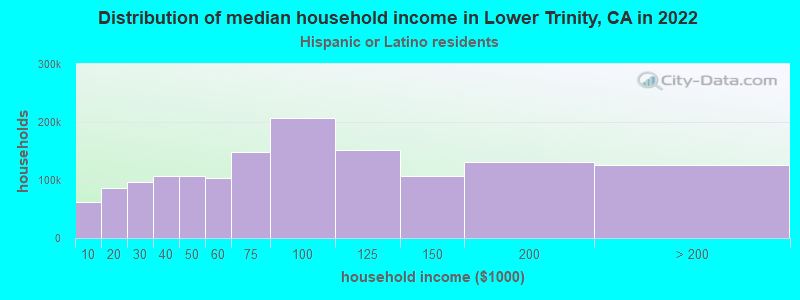
- $51,177Hispanic or Latino race householders
- Median 2022 house value
- $425,796White Non-Hispanic householders
- $566,889American Indian or Alaska Native householders
- $584,885Asian householders
- $644,993Two or more races householders
- $305,940Hispanic or Latino householders
Household income for White non-Hispanic householders
Household income for American Indian and Alaska Native householders
Household income for Asian householders
Household income for Two or more races householders
Household income for Hispanic or Latino race householders
Zip code: 96010