Races in Lynnfield, Massachusetts (MA) Detailed Stats
Data:
Races - White alone (%)
Races - White alone (% change since 2000)
Races - Black alone (%)
Races - Black alone (% change since 2000)
Races - American Indian alone (%)
Races - American Indian alone (% change since 2000)
Races - Asian alone (%)
Races - Asian alone (% change since 2000)
Races - Hispanic (%)
Races - Hispanic (% change since 2000)
Races - Native Hawaiian and Other Pacific Islander alone (%)
Races - Native Hawaiian and Other Pacific Islander alone (% change since 2000)
Races - Two or more races(%)
Races - Two or more races(% change since 2000)
Races - Other race alone (%)
Races - Other race alone (% change since 2000)
Racial diversity
Place of birth - Born in state of residence (%)
Place of birth - Born in state of residence (%) - White
Place of birth - Born in state of residence (%) - Black or African American
Place of birth - Born in state of residence (%) - Asian
Place of birth - Born in state of residence (%) - Hispanic or Latino
Place of birth - Born in state of residence (%) - American Indian and Alaska Native
Place of birth - Born in state of residence (%) - Multirace
Place of birth - Born in state of residence (%) - Other Race
Place of birth - Born in other state (%)
Place of birth - Born in other state (%) - White
Place of birth - Born in other state (%) - Black or African American
Place of birth - Born in other state (%) - Asian
Place of birth - Born in other state (%) - Hispanic or Latino
Place of birth - Born in other state (%) - American Indian and Alaska Native
Place of birth - Born in other state (%) - Multirace
Place of birth - Born in other state (%) - Other Race
Place of birth - Native, outside of US (%)
Place of birth - Native, outside of US (%) - White
Place of birth - Native, outside of US (%) - Black or African American
Place of birth - Native, outside of US (%) - Asian
Place of birth - Native, outside of US (%) - Hispanic or Latino
Place of birth - Native, outside of US (%) - American Indian and Alaska Native
Place of birth - Native, outside of US (%) - Multirace
Place of birth - Native, outside of US (%) - Other Race
Place of birth - Foreign born (%)
Place of birth - Foreign born (%) - White
Place of birth - Foreign born (%) - Black or African American
Place of birth - Foreign born (%) - Asian
Place of birth - Foreign born (%) - Hispanic or Latino
Place of birth - Foreign born (%) - American Indian and Alaska Native
Place of birth - Foreign born (%) - Multirace
Place of birth - Foreign born (%) - Other Race
Residents speaking English at home (%)
Residents speaking English at home - Born in the United States (%)
Residents speaking English at home - Native, born elsewhere (%)
Residents speaking English at home - Foreign born (%)
Residents speaking Spanish at home (%)
Residents speaking Spanish at home - Born in the United States (%)
Residents speaking Spanish at home - Native, born elsewhere (%)
Residents speaking Spanish at home - Foreign born (%)
Residents speaking other language at home (%)
Residents speaking other language at home - Born in the United States (%)
Residents speaking other language at home - Native, born elsewhere (%)
Residents speaking other language at home - Foreign born (%)
Marital status - Never married (%)
Marital status - Now married (%)
Marital status - Separated (%)
Marital status - Widowed (%)
Marital status - Divorced (%)
Ancestries Reported - Arab (%)
Ancestries Reported - Czech (%)
Ancestries Reported - Danish (%)
Ancestries Reported - Dutch (%)
Ancestries Reported - English (%)
Ancestries Reported - French (%)
Ancestries Reported - French Canadian (%)
Ancestries Reported - German (%)
Ancestries Reported - Greek (%)
Ancestries Reported - Hungarian (%)
Ancestries Reported - Irish (%)
Ancestries Reported - Italian (%)
Ancestries Reported - Lithuanian (%)
Ancestries Reported - Norwegian (%)
Ancestries Reported - Polish (%)
Ancestries Reported - Portuguese (%)
Ancestries Reported - Russian (%)
Ancestries Reported - Scotch-Irish (%)
Ancestries Reported - Scottish (%)
Ancestries Reported - Slovak (%)
Ancestries Reported - Subsaharan African (%)
Ancestries Reported - Swedish (%)
Ancestries Reported - Swiss (%)
Ancestries Reported - Ukrainian (%)
Ancestries Reported - United States (%)
Ancestries Reported - Welsh (%)
Ancestries Reported - West Indian (%)
Ancestries Reported - Other (%)
Geographical mobility - Same house 1 year ago (%)
Geographical mobility - Same house 1 year ago (%) - White
Geographical mobility - Same house 1 year ago (%) - Black or African American
Geographical mobility - Same house 1 year ago (%) - Asian
Geographical mobility - Same house 1 year ago (%) - Hispanic or Latino
Geographical mobility - Same house 1 year ago (%) - American Indian and Alaska Native
Geographical mobility - Same house 1 year ago (%) - Multirace
Geographical mobility - Same house 1 year ago (%) - Other Race
Geographical mobility - Moved within same county (%)
Geographical mobility - Moved within same county (%) - White
Geographical mobility - Moved within same county (%) - Black or African American
Geographical mobility - Moved within same county (%) - Asian
Geographical mobility - Moved within same county (%) - Hispanic or Latino
Geographical mobility - Moved within same county (%) - American Indian and Alaska Native
Geographical mobility - Moved within same county (%) - Multirace
Geographical mobility - Moved within same county (%) - Other Race
Geographical mobility - Moved from different county within same state (%)
Geographical mobility - Moved from different county within same state (%) - White
Geographical mobility - Moved from different county within same state (%) - Black or African American
Geographical mobility - Moved from different county within same state (%) - Asian
Geographical mobility - Moved from different county within same state (%) - Hispanic or Latino
Geographical mobility - Moved from different county within same state (%) - American Indian and Alaska Native
Geographical mobility - Moved from different county within same state (%) - Multirace
Geographical mobility - Moved from different county within same state (%) - Other Race
Geographical mobility - Moved from different state (%)
Geographical mobility - Moved from different state (%) - White
Geographical mobility - Moved from different state (%) - Black or African American
Geographical mobility - Moved from different state (%) - Asian
Geographical mobility - Moved from different state (%) - Hispanic or Latino
Geographical mobility - Moved from different state (%) - American Indian and Alaska Native
Geographical mobility - Moved from different state (%) - Multirace
Geographical mobility - Moved from different state (%) - Other Race
Geographical mobility - Moved from abroad (%)
Geographical mobility - Moved from abroad (%) - White
Geographical mobility - Moved from abroad (%) - Black or African American
Geographical mobility - Moved from abroad (%) - Asian
Geographical mobility - Moved from abroad (%) - Hispanic or Latino
Geographical mobility - Moved from abroad (%) - American Indian and Alaska Native
Geographical mobility - Moved from abroad (%) - Multirace
Geographical mobility - Moved from abroad (%) - Other Race
Place of birth for the foreign-born population - Ireland (%)
Place of birth for the foreign-born population - Denmark (%)
Place of birth for the foreign-born population - Norway (%)
Place of birth for the foreign-born population - Sweden (%)
Place of birth for the foreign-born population - United Kingdom (%)
Place of birth for the foreign-born population - England (%)
Place of birth for the foreign-born population - Scotland (%)
Place of birth for the foreign-born population - Other Northern Europe (%)
Place of birth for the foreign-born population - Austria (%)
Place of birth for the foreign-born population - Belgium (%)
Place of birth for the foreign-born population - France (%)
Place of birth for the foreign-born population - Germany (%)
Place of birth for the foreign-born population - Netherlands (%)
Place of birth for the foreign-born population - Switzerland (%)
Place of birth for the foreign-born population - Other Western Europe (%)
Place of birth for the foreign-born population - Greece (%)
Place of birth for the foreign-born population - Italy (%)
Place of birth for the foreign-born population - Portugal (%)
Place of birth for the foreign-born population - Spain (%)
Place of birth for the foreign-born population - Other Southern Europe (%)
Place of birth for the foreign-born population - Albania (%)
Place of birth for the foreign-born population - Belarus (%)
Place of birth for the foreign-born population - Bosnia and Herzegovina (%)
Place of birth for the foreign-born population - Bulgaria (%)
Place of birth for the foreign-born population - Croatia (%)
Place of birth for the foreign-born population - Czechoslovakia (%)
Place of birth for the foreign-born population - Hungary (%)
Place of birth for the foreign-born population - Latvia (%)
Place of birth for the foreign-born population - Lithuania (%)
Place of birth for the foreign-born population - North Macedonia (Macedonia) (%)
Place of birth for the foreign-born population - Moldova (%)
Place of birth for the foreign-born population - Poland (%)
Place of birth for the foreign-born population - Romania (%)
Place of birth for the foreign-born population - Russia (%)
Place of birth for the foreign-born population - Serbia (%)
Place of birth for the foreign-born population - Ukraine (%)
Place of birth for the foreign-born population - Other Eastern Europe (%)
Place of birth for the foreign-born population - China (%)
Place of birth for the foreign-born population - Hong Kong (%)
Place of birth for the foreign-born population - Taiwan (%)
Place of birth for the foreign-born population - Japan (%)
Place of birth for the foreign-born population - Korea (%)
Place of birth for the foreign-born population - Other Eastern Asia (%)
Place of birth for the foreign-born population - Afghanistan (%)
Place of birth for the foreign-born population - Bangladesh (%)
Place of birth for the foreign-born population - India (%)
Place of birth for the foreign-born population - Iran (%)
Place of birth for the foreign-born population - Kazakhstan (%)
Place of birth for the foreign-born population - Nepal (%)
Place of birth for the foreign-born population - Pakistan (%)
Place of birth for the foreign-born population - Sri Lanka (%)
Place of birth for the foreign-born population - Uzbekistan (%)
Place of birth for the foreign-born population - Other South Central Asia (%)
Place of birth for the foreign-born population - Burma (%)
Place of birth for the foreign-born population - Cambodia (%)
Place of birth for the foreign-born population - Indonesia (%)
Place of birth for the foreign-born population - Laos (%)
Place of birth for the foreign-born population - Malaysia (%)
Place of birth for the foreign-born population - Philippines (%)
Place of birth for the foreign-born population - Singapore (%)
Place of birth for the foreign-born population - Thailand (%)
Place of birth for the foreign-born population - Vietnam (%)
Place of birth for the foreign-born population - Other South Eastern Asia (%)
Place of birth for the foreign-born population - Armenia (%)
Place of birth for the foreign-born population - Iraq (%)
Place of birth for the foreign-born population - Israel (%)
Place of birth for the foreign-born population - Jordan (%)
Place of birth for the foreign-born population - Kuwait (%)
Place of birth for the foreign-born population - Lebanon (%)
Place of birth for the foreign-born population - Saudi Arabia (%)
Place of birth for the foreign-born population - Syria (%)
Place of birth for the foreign-born population - Turkey (%)
Place of birth for the foreign-born population - Yemen (%)
Place of birth for the foreign-born population - Other Western Asia (%)
Place of birth for the foreign-born population - Eritrea (%)
Place of birth for the foreign-born population - Ethiopia (%)
Place of birth for the foreign-born population - Kenya (%)
Place of birth for the foreign-born population - Somalia (%)
Place of birth for the foreign-born population - Uganda (%)
Place of birth for the foreign-born population - Zimbabwe (%)
Place of birth for the foreign-born population - Other Eastern Africa (%)
Place of birth for the foreign-born population - Cameroon (%)
Place of birth for the foreign-born population - Congo (%)
Place of birth for the foreign-born population - Democratic Republic of Congo (Zaire) (%)
Place of birth for the foreign-born population - Other Middle Africa (%)
Place of birth for the foreign-born population - Egypt (%)
Place of birth for the foreign-born population - Morocco (%)
Place of birth for the foreign-born population - Sudan (%)
Place of birth for the foreign-born population - Other Northern Africa (%)
Place of birth for the foreign-born population - South Africa (%)
Place of birth for the foreign-born population - Other Southern Africa (%)
Place of birth for the foreign-born population - Cabo Verde (%)
Place of birth for the foreign-born population - Ghana (%)
Place of birth for the foreign-born population - Liberia (%)
Place of birth for the foreign-born population - Nigeria (%)
Place of birth for the foreign-born population - Senegal (%)
Place of birth for the foreign-born population - Sierra Leone (%)
Place of birth for the foreign-born population - Other Western Africa (%)
Place of birth for the foreign-born population - Australia (%)
Place of birth for the foreign-born population - New Zealand (%)
Place of birth for the foreign-born population - Fiji (%)
Place of birth for the foreign-born population - Micronesia (%)
Place of birth for the foreign-born population - Bahamas (%)
Place of birth for the foreign-born population - Barbados (%)
Place of birth for the foreign-born population - Cuba (%)
Place of birth for the foreign-born population - Dominica (%)
Place of birth for the foreign-born population - Dominican Republic (%)
Place of birth for the foreign-born population - Grenada (%)
Place of birth for the foreign-born population - Haiti (%)
Place of birth for the foreign-born population - Jamaica (%)
Place of birth for the foreign-born population - St. Vincent and the Grenadines (%)
Place of birth for the foreign-born population - Trinidad and Tobago (%)
Place of birth for the foreign-born population - West Indies (%)
Place of birth for the foreign-born population - Other Caribbean (%)
Place of birth for the foreign-born population - Belize (%)
Place of birth for the foreign-born population - Costa Rica (%)
Place of birth for the foreign-born population - El Salvador (%)
Place of birth for the foreign-born population - Guatemala (%)
Place of birth for the foreign-born population - Honduras (%)
Place of birth for the foreign-born population - Mexico (%)
Place of birth for the foreign-born population - Nicaragua (%)
Place of birth for the foreign-born population - Panama (%)
Place of birth for the foreign-born population - Other Central America (%)
Place of birth for the foreign-born population - Argentina (%)
Place of birth for the foreign-born population - Bolivia (%)
Place of birth for the foreign-born population - Brazil (%)
Place of birth for the foreign-born population - Chile (%)
Place of birth for the foreign-born population - Colombia (%)
Place of birth for the foreign-born population - Ecuador (%)
Place of birth for the foreign-born population - Guyana (%)
Place of birth for the foreign-born population - Peru (%)
Place of birth for the foreign-born population - Uruguay (%)
Place of birth for the foreign-born population - Venezuela (%)
Place of birth for the foreign-born population - Other South America (%)
Place of birth for the foreign-born population - Canada (%)
Place of birth for the foreign-born population - Other Northern America (%)
Place of birth for the foreign-born population - Other (%)
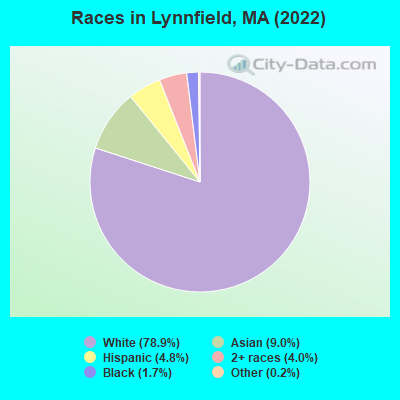
According to 2022 data, the most numerous races in Lynnfield, MA are White alone (10,207 residents), Hispanic (623 residents), and Asian alone (1,162 residents). 82.3% of Lynnfield residents speak English at home. 11.8% of Lynnfield, MA residents are foreign-born (6.0% born in Asia, 2.1% born in Latin America, 2.0% born in Europe, 1.3% born in North America), which is 53.0% less than the foreign-born rate of 18.0% across the entire state of Massachusetts.
Race distribution in Lynnfield
2000 2022
5,198,359 81.9% White alone 428,729 6.8% Hispanic 318,329 5.0% Black alone 236,786 3.7% Asian alone 110,338 1.7% Two or more races 43,586 0.7% Other race alone 11,264 0.2% American Indian alone 1,706 0.03% Native Hawaiian and Other
4,676,627 67.0% White alone 911,038 13.0% Hispanic 501,463 7.2% Asian alone 459,740 6.6% Black alone 341,889 4.9% Two or more races 84,403 1.2% Other race alone 5,838 0.08% American Indian alone 976 0.01% Native Hawaiian and Other
Income and house value in Lynnfield Median household income in 2022 $157,281 White non-Hispanic householdersover $200,000 Some other race householders$97,732 Two or more races householdersMedian 2022 house value $964,336 White Non-Hispanic householders$331,361 Black or African American householdersover $1,000,000 American Indian or Alaska Native householders over $1,000,000 Asian householders$809,995 Some other race householdersover $1,000,000 Hispanic or Latino householders
Median age by race in Lynnfield
47.0 Median age for White residents45.5 47.4 18.3 Median age for Black or African American residents17.5 32.9 -713,541,666.0 Median age for American Indian / Alaska Native residents-679,156,908.0 -364,551,862.7 35.9 Median age for Asian residents37.8 30.9 -514,227,641.8 Median age for Native Hawaiian / Pacific Islander residents-666,666,666.0 -508,717,948.2 18.3 Median age for Other race residents4.9 32.5 18.6 Median age for Two or more races residents24.0 16.6 46.3 Median age for White alone residents44.5 47.1 27.7 Median age for Hispanic or Latino residents16.8 34.0
Owner/renter occupied households by race in Lynnfield
House owners and renters - White residents 3,503 87.5% Owner occupied502 12.5% Renter occupiedHouse owners and renters - Black or African American residents 30 53.8% Owner occupied26 46.2% Renter occupiedHouse owners and renters - Asian residents 262 88.5% Owner occupied34 11.5% Renter occupiedHouse owners and renters - Other race residents 90 67.6% Owner occupied43 32.4% Renter occupiedHouse owners and renters - Two or more races residents 74 83.5% Owner occupied15 16.5% Renter occupiedHouse owners and renters - White alone residents 3,538 86.6% Owner occupied545 13.4% Renter occupiedHouse owners and renters - Hispanic or Latino residents 130 68.8% Owner occupied59 31.2% Renter occupied
Language usage in Lynnfield
English speakers - Total 82.3% of residents of Lynnfield speak English at home.
3.9% of residents speak Spanish at home 347 74.0% Speak English very well122 26.0% Speak English less than very well13.0% of residents speak other language at home 994 63.5% Speak English very well571 36.5% Speak English less than very well
English speakers - Born in the United States 87.4% of residents of Lynnfield speak English at home.
0.4% of residents speak Spanish at home 8 100.0% Speak English very well13.1% of residents speak other language at home 237 92.2% Speak English very well20 7.8% Speak English less than very well
English speakers - Native, born elsewhere 63.6% of residents of Lynnfield speak English at home.
45.5% of residents speak Spanish at home 15 100.0% Speak English very well
English speakers - Foreign-born 25.7% of residents of Lynnfield speak English at home.
8.0% of residents speak Spanish at home 78 61.4% Speak English very well49 38.6% Speak English less than very well63.0% of residents speak other language at home 546 54.9% Speak English very well448 45.1% Speak English less than very well
White (Caucasian) - Speak only English Native:
98.4% (8,872)Foreign-born:
64.1% (238)
White (Caucasian) - Speak another language Native:
2.3% (206)Foreign-born:
40.0% (148)
Black or African American - Speak another language Native:
63.2% (109)Foreign-born:
92.2% (86)
Asian - Speak only English Native:
57.2% (236)Foreign-born:
8.2% (59)
Asian - Speak another language Native:
43.2% (178)Foreign-born:
92.9% (665)
Two or more races - Speak another language Native:
16.1% (55)Foreign-born:
97.2% (210)
White alone - Speak only English Native:
97.0% (8,940)Foreign-born:
57.1% (264)
White alone - Speak another language Native:
2.9% (271)Foreign-born:
41.7% (193)
Hispanic or Latino - Speak another language Native:
95.8% (307)Foreign-born:
99.6% (142)
Foreign-born residents in Lynnfield 1,522 residents are foreign born (6.0% Asia , 2.1% Latin America , 2.0% Europe , 1.3% North America ).
This city:
11.8%Massachusetts:
17.6%
Marital status for residents in Lynnfield Marital status - White (Caucasian) population 15 years and over
Males 23.0% Never married71.0% Now married1.1% Separated1.2% Widowed3.8% DivorcedFemales 18.5% Never married62.9% Now married0.0% Separated10.7% Widowed7.9% DivorcedWomen who gave birth in the past 12 months Now married:
100.0% (79)Unmarried:
0.0% (0)
Women who did not give birth in the past 12 months Now married:
59.5% (1,068)Unmarried:
40.5% (728)
Marital status - Black or African American population 15 years and over
Males 43.0% Never married57.0% Now married0.0% Separated0.0% Widowed0.0% DivorcedFemales 50.0% Never married50.0% Now married0.0% Separated0.0% Widowed0.0% DivorcedWomen who did not give birth in the past 12 months Now married:
50.0% (27)Unmarried:
50.0% (27)
Marital status - Asian population 15 years and over
Males 7.0% Never married89.5% Now married0.0% Separated3.5% Widowed0.0% DivorcedFemales 19.1% Never married72.3% Now married0.0% Separated8.6% Widowed0.0% DivorcedWomen who did not give birth in the past 12 months Now married:
70.4% (293)Unmarried:
29.6% (123)
Marital status - Other race population 15 years and over
Males 34.5% Never married65.5% Now married0.0% Separated0.0% Widowed0.0% DivorcedFemales 51.1% Never married48.9% Now married0.0% Separated0.0% Widowed0.0% DivorcedWomen who gave birth in the past 12 months Now married:
100.0% (76)Unmarried:
0.0% (0)
Women who did not give birth in the past 12 months Now married:
0.0% (0)Unmarried:
100.0% (88)
Marital status - Two or more races population 15 years and over
Males 28.0% Never married67.4% Now married0.0% Separated0.0% Widowed4.6% DivorcedFemales 50.4% Never married35.7% Now married0.0% Separated0.0% Widowed13.9% DivorcedWomen who did not give birth in the past 12 months Now married:
0.0% (0)Unmarried:
100.0% (68)
Marital status - White alone, not Hispanic / Latino population 15 years and over
Males 23.0% Never married71.0% Now married1.1% Separated1.2% Widowed3.8% DivorcedFemales 18.6% Never married62.8% Now married0.0% Separated10.7% Widowed7.9% DivorcedWomen who gave birth in the past 12 months Now married:
100.0% (83)Unmarried:
0.0% (0)
Women who did not give birth in the past 12 months Now married:
59.3% (1,119)Unmarried:
40.7% (768)
Marital status - Hispanic or Latino population 15 years and over
Males 28.7% Never married66.2% Now married0.0% Separated0.0% Widowed5.1% DivorcedFemales 52.3% Never married40.3% Now married0.0% Separated0.0% Widowed7.4% DivorcedWomen who gave birth in the past 12 months Now married:
100.0% (63)Unmarried:
0.0% (0)
Women who did not give birth in the past 12 months Now married:
7.4% (9)Unmarried:
92.6% (119)
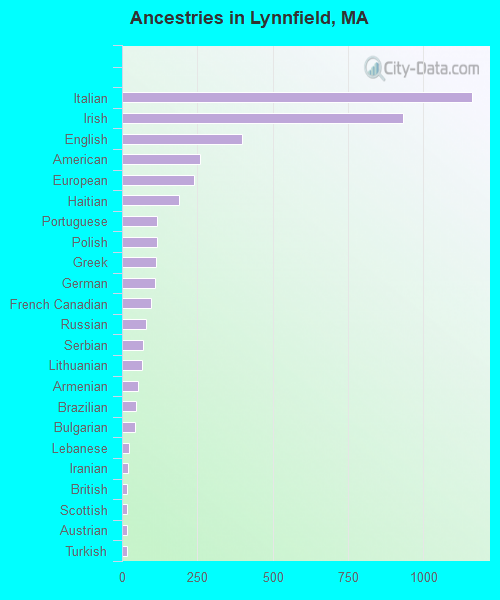
Ancestries in Lynnfield
1,161 20.3% Italian933 16.3% Irish397 6.9% English258 4.5% American238 4.2% European190 3.3% Haitian117 2.0% Portuguese115 2.0% Polish113 2.0% Greek108 1.9% German96 1.7% French Canadian79 1.4% Russian71 1.2% Serbian66 1.2% Lithuanian54 0.9% Armenian48 0.8% Brazilian44 0.8% Bulgarian24 0.4% Lebanese19 0.3% Iranian17 0.3% British17 0.3% Scottish15 0.3% Austrian15 0.3% Turkish8 0.1% Canadian7 0.1% Czech7 0.1% Northern European7 0.1% Swedish3 0.05% Slavic
Children Nativity (place of birth) in Lynnfield
Children under 6 years - Living with two parents Both parents native 712 100.0% NativeBoth parents foreign-born 101 100.0% NativeOne native, one foreign-born parent 324 100.0% NativeChildren under 6 years - Living with one parent Native parent 35 100.0% NativeChildren 6 to 17 years - Living with two parents Both parents native 1,079 99.9% Native1 0.1% Foreign-bornBoth parents foreign-born 269 94.5% Native16 5.5% Foreign-bornOne native, one foreign-born parent 321 100.0% NativeChildren 6 to 17 years - Living with one parent Native parent 300 100.0% NativeForeign-born parent 125 48.5% Native133 51.5% Foreign-born