Races in Maryville, Tennessee (TN) Detailed Stats
Ancestries, Foreign-born residents, place of birth
Settings
X


Recent posts about races in Maryville, Tennessee on our local forum with over 2,400,000 registered users:
 | Finally Made it To Maryville, First Impressions (66 replies) |
| Maryville House Hunting and Neighborhood Comparison (2 replies) |
| Maryville/Alcoa Residential lots info (5 replies) |
| Help need to find house to rent Mid June Maryville Area (1 reply) |
| Mixed Race moving to Maryville, TN...will I be accepted? (4 replies) |
| Greeneville Question (38 replies) |
Latest news about races in Maryville, TN collected exclusively by city-data.com from local newspapers, TV, and radio stations
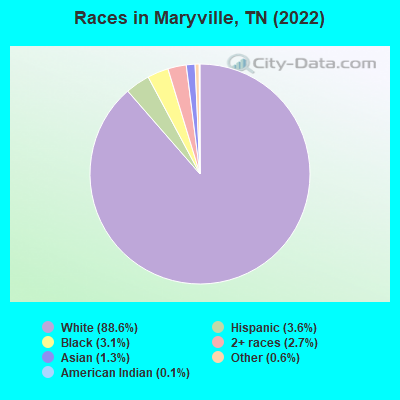
According to 2022 data, the most numerous races in Maryville, TN are White alone (29,058 residents), Black alone (1,022 residents), and Hispanic (1,174 residents). 96.0% of Maryville residents speak English at home. 2.8% of Maryville, TN residents are foreign-born (1.2% born in Asia, 0.9% born in Latin America, 0.4% born in Europe), which is 81.1% less than the foreign-born rate of 5.0% across the entire state of Tennessee.
Race distribution in Maryville
2000
2022

- 21,46392.8%White alone
- 6702.9%Black alone
- 3581.5%Asian alone
- 3181.4%Hispanic
- 2351.0%Two or more races
- 420.2%American Indian alone
- 260.1%Other race alone
- 80.03%Native Hawaiian and Other
Pacific Islander alone

-
- 29,05888.6%White alone
- 1,1743.6%Hispanic
- 1,0223.1%Black alone
- 8982.7%Two or more races
- 4331.3%Asian alone
- 1860.6%Other race alone
- 400.1%American Indian alone
2000
2022
-
- 4,505,93079.2%White alone
- 928,20416.3%Black alone
- 123,8382.2%Hispanic
- 54,8241.0%Two or more races
- 56,0771.0%Asian alone
- 13,8200.2%American Indian alone
- 4,7800.08%Other race alone
- 1,8100.03%Native Hawaiian and Other
Pacific Islander alone

-
- 5,070,02671.9%White alone
- 1,089,73815.5%Black alone
- 442,6296.3%Hispanic
- 279,3814.0%Two or more races
- 131,8171.9%Asian alone
- 26,9720.4%Other race alone
- 6,3870.09%American Indian alone
- 4,3890.06%Native Hawaiian and Other
Pacific Islander alone

Income and house value in Maryville
- Median household income in 2022
- $74,375White non-Hispanic householders
- $104,983Black householders
- $101,995Asian householders
- $49,299Two or more races householders
- $24,938Hispanic or Latino race householders
- Median 2022 house value
- $340,081White Non-Hispanic householders
- $282,110Black or African American householders
- $243,940American Indian or Alaska Native householders
- $507,396Asian householders
- $322,862Two or more races householders
- $328,889Hispanic or Latino householders
Household income for White non-Hispanic householders

Household income for Black householders

Household income for Asian householders

Household income for Some other race householders

Household income for Two or more races householders

Household income for Hispanic or Latino race householders

Median age by race in Maryville
- 42.0Median age for White residents
- 41.8Males
- 43.1Females
- 53.7Median age for Black or African American residents
- 29.9Males
- 70.5Females
- 23.2Median age for American Indian / Alaska Native residents
- -633,911,367.4Males
- 19.5Females
- 30.5Median age for Asian residents
- 31.2Males
- 33.9Females
- -666,666,666.0Median age for Native Hawaiian / Pacific Islander residents
- -666,666,666.0Males
- -666,666,666.0Females
- 78.5Median age for Other race residents
- 68.8Males
- 25.4Females
- 28.1Median age for Two or more races residents
- 18.2Males
- 29.3Females
- 42.0Median age for White alone residents
- 41.9Males
- 43.0Females
- 28.2Median age for Hispanic or Latino residents
- 34.6Males
- 20.7Females
Owner/renter occupied households by race in Maryville
- House owners and renters - White residents
- 8,04571.9%Owner occupied
- 3,13728.1%Renter occupied
- House owners and renters - Black or African American residents
- 20879.8%Owner occupied
- 5320.2%Renter occupied
- House owners and renters - Asian residents
- 6950.6%Owner occupied
- 6749.4%Renter occupied
- House owners and renters - Other race residents
- 5774.2%Owner occupied
- 2025.8%Renter occupied
- House owners and renters - Two or more races residents
- 31341.7%Owner occupied
- 43858.3%Renter occupied
- House owners and renters - White alone residents
- 8,07772.1%Owner occupied
- 3,13327.9%Renter occupied
- House owners and renters - Hispanic or Latino residents
- 5910.1%Owner occupied
- 53289.9%Renter occupied
Language usage in Maryville
- English speakers - Total
- 96.0% of residents of Maryville speak English at home.
- 2.1% of residents speak Spanish at home
- 26040.2%Speak English very well
- 38759.8%Speak English less than very well
- 1.8% of residents speak other language at home
- 27750.7%Speak English very well
- 26949.3%Speak English less than very well
- English speakers - Born in the United States
- 97.9% of residents of Maryville speak English at home.
- 1.0% of residents speak Spanish at home
- 10890.8%Speak English very well
- 119.2%Speak English less than very well
- 0.9% of residents speak other language at home
- 7666.7%Speak English very well
- 3833.3%Speak English less than very well
- English speakers - Native, born elsewhere
- 66.0% of residents of Maryville speak English at home.
- 26.4% of residents speak Spanish at home
- 3035.7%Speak English very well
- 5464.3%Speak English less than very well
- 11.9% of residents speak other language at home
- 38100.0%Speak English less than very well
- English speakers - Foreign-born
- 33.3% of residents of Maryville speak English at home.
- 34.7% of residents speak Spanish at home
- 185.7%Speak English very well
- 29694.3%Speak English less than very well
- 31.8% of residents speak other language at home
- 12342.7%Speak English very well
- 16557.3%Speak English less than very well
White (Caucasian) - Speak only English
| Native: | 98.9% (27,392) |
| Foreign-born: | 74.8% (84) |
White (Caucasian) - Speak another language
| Native: | 1.0% (276) |
| Foreign-born: | 22.8% (25) |
Asian - Speak only English
| Native: | 70.3% (86) |
| Foreign-born: | 31.9% (111) |
Asian - Speak another language
| Native: | 28.9% (35) |
| Foreign-born: | 67.9% (236) |
Other race - Speak another language
| Native: | 10.1% (17) |
| Foreign-born: | 100.0% (58) |
Two or more races - Speak another language
| Native: | 12.2% (160) |
| Foreign-born: | 69.0% (309) |
White alone - Speak only English
| Native: | 98.9% (27,271) |
| Foreign-born: | 48.1% (86) |
White alone - Speak another language
| Native: | 1.1% (316) |
| Foreign-born: | 46.0% (82) |
Hispanic or Latino - Speak another language
| Native: | 15.2% (120) |
| Foreign-born: | 72.9% (262) |
Foreign-born residents in Maryville
906 residents are foreign born (1.2% Asia, 0.9% Latin America, 0.4% Europe).
| This city: | 2.8% |
| Tennessee: | 5.4% |


Marital status for residents in Maryville
Marital status - White (Caucasian) population 15 years and over
- Males
- 32.2%Never married
- 55.3%Now married
- 0.4%Separated
- 3.6%Widowed
- 8.4%Divorced
- Females
- 24.4%Never married
- 49.9%Now married
- 1.5%Separated
- 10.9%Widowed
- 13.3%Divorced
Women who gave birth in the past 12 months
| Now married: | 61.7% (112) |
| Unmarried: | 38.3% (70) |
Women who did not give birth in the past 12 months
| Now married: | 51.5% (3,400) |
| Unmarried: | 48.5% (3,205) |
Marital status - Black or African American population 15 years and over
- Males
- 35.4%Never married
- 42.5%Now married
- 0.0%Separated
- 0.0%Widowed
- 22.1%Divorced
- Females
- 59.5%Never married
- 25.1%Now married
- 6.1%Separated
- 7.5%Widowed
- 1.9%Divorced
Women who did not give birth in the past 12 months
| Now married: | 0.0% (0) |
| Unmarried: | 100.0% (226) |
Marital status - Asian population 15 years and over
- Males
- 48.3%Never married
- 51.2%Now married
- 0.5%Separated
- 0.0%Widowed
- 0.0%Divorced
- Females
- 25.3%Never married
- 28.1%Now married
- 18.9%Separated
- 27.7%Widowed
- 0.0%Divorced
Women who did not give birth in the past 12 months
| Now married: | 59.6% (97) |
| Unmarried: | 40.4% (66) |
Marital status - Other race population 15 years and over
- Males
- 12.2%Never married
- 42.7%Now married
- 45.1%Separated
- 0.0%Widowed
- 0.0%Divorced
- Females
- 39.3%Never married
- 33.9%Now married
- 0.0%Separated
- 26.8%Widowed
- 0.0%Divorced
Women who did not give birth in the past 12 months
| Now married: | 35.3% (14) |
| Unmarried: | 64.7% (26) |
Marital status - Two or more races population 15 years and over
- Males
- 47.6%Never married
- 42.7%Now married
- 2.0%Separated
- 0.0%Widowed
- 7.7%Divorced
- Females
- 49.4%Never married
- 25.8%Now married
- 0.0%Separated
- 5.3%Widowed
- 19.5%Divorced
Women who gave birth in the past 12 months
| Now married: | 100.0% (7) |
| Unmarried: | 0.0% (0) |
Women who did not give birth in the past 12 months
| Now married: | 23.4% (153) |
| Unmarried: | 76.6% (501) |
Marital status - White alone, not Hispanic / Latino population 15 years and over
- Males
- 32.0%Never married
- 55.5%Now married
- 0.5%Separated
- 3.6%Widowed
- 8.4%Divorced
- Females
- 24.4%Never married
- 49.9%Now married
- 1.5%Separated
- 11.0%Widowed
- 13.3%Divorced
Women who gave birth in the past 12 months
| Now married: | 61.7% (114) |
| Unmarried: | 38.3% (71) |
Women who did not give birth in the past 12 months
| Now married: | 51.3% (3,395) |
| Unmarried: | 48.7% (3,229) |
Marital status - Hispanic or Latino population 15 years and over
- Males
- 61.1%Never married
- 26.0%Now married
- 10.6%Separated
- 0.0%Widowed
- 2.3%Divorced
- Females
- 53.3%Never married
- 19.9%Now married
- 2.5%Separated
- 0.0%Widowed
- 24.2%Divorced
Women who did not give birth in the past 12 months
| Now married: | 25.2% (86) |
| Unmarried: | 74.8% (254) |
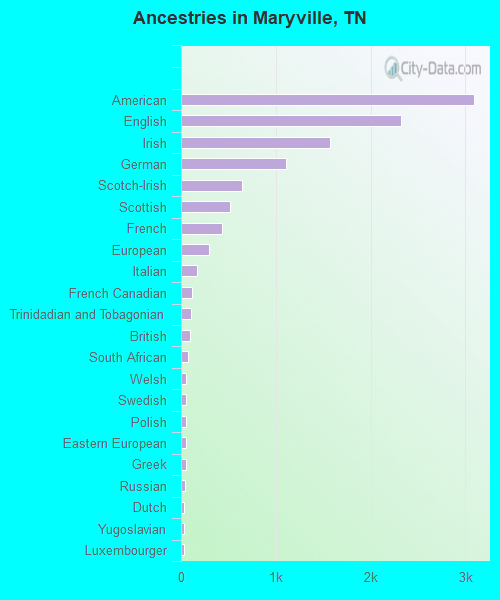
Ancestries in Maryville

- 3,09422.4%American
- 2,31916.8%English
- 1,56911.3%Irish
- 1,1108.0%German
- 6434.7%Scotch-Irish
- 5223.8%Scottish
- 4373.2%French
- 2982.2%European
- 1671.2%Italian
- 1190.9%French Canadian
- 1010.7%Trinidadian and Tobagonian
- 930.7%British
- 710.5%South African
- 570.4%Welsh
- 560.4%Swedish
- 550.4%Polish
- 530.4%Eastern European
- 480.3%Greek
- 470.3%Russian
- 310.2%Dutch
- 300.2%Yugoslavian
- 290.2%Luxembourger
- 280.2%Scandinavian
- 250.2%Norwegian
- 250.2%Turkish
- 240.2%Northern European
- 170.1%Danish
- 90.07%Finnish
- 90.07%Hungarian
- 80.06%Czech
- 60.04%African
- 50.04%Swiss
Geographical mobility in Maryville

- Same house 1 year ago
- 26,24291.1%White (Caucasian)
- 74881.4%Black or African American
- 24100.0%American Indian / Alaska Native
- 40585.9%Asian
- 16174.3%Other race
- 2,14497.4%Two or more races
- 26,35191.3%White alone, not Hispanic / Latino
- 1,01992.6%Hispanic or Latino

-
- Moved within same county
- 1,3414.7%White / Caucasian
- 9310.2%Black or African American
- 439.1%Asian
- 2812.9%Other race
- 160.7%Two or more races
- 1,2974.5%White alone, not Hispanic / Latino
- 353.2%Hispanic or Latino

-
- Moved within same state
- 6082.1%White / Caucasian
- 394.3%Black or African American
- 136.1%Other race
- 321.5%Two or more races
- 5842.0%White alone, not Hispanic / Latino
- 353.2%Hispanic or Latino

-
- Moved from different state
- 4341.5%White / Caucasian
- 364.0%Black or African American
- 120.5%Two or more races
- 4341.5%White alone, not Hispanic / Latino

-
- Moved from abroad
- 410.1%White
- 94.1%Other race
- 410.1%White alone, not Hispanic / Latino
- 60.5%Hispanic or Latino

Children Nativity (place of birth) in Maryville
Place of birth for residents in Maryville
![Place of birth for the foreign-born population - Regions]()
- 390Asia
- 315Americas
- 300Latin America
- 300Central America
- 180South Eastern Asia
- 141Eastern Asia
- 116Europe
- 83Northern Europe
- 71Africa
- 71Southern Africa
- 65China
- 34South Central Asia
- 34Western Asia
- 19Western Europe
- 14Northern America
- 13Eastern Europe
- 12Oceania
- 12Australia and New Zealand Subregion

![Place of birth for the foreign-born population - Countries]()
- 200Mexico
- 108Thailand
- 84Guatemala
- 72Laos
- 71South Africa
- 65China
- 56Korea
- 40England
- 34Pakistan
- 29United Kingdom
- 26Azerbaijan
- 19Germany
- 18Japan
- 14Canada
- 13Scotland
- 13Russia
- 12Australia
- 10Honduras
- 8Turkey
- 5El Salvador

Grandparents responsible for own grandchildren in Maryville
Zip codes: 37803.