Maryville, Tennessee
Maryville: Maryville in the Fall
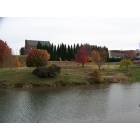
Maryville: Downtown park next to library
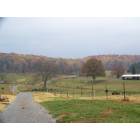
Maryville: scenery down Old Niles Ferry Road, off 411 South
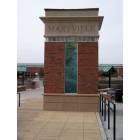
Maryville: Entrance to Library Downtown Maryville

Maryville: Outside of Maryville along 411 route - taking a motorcycle ride
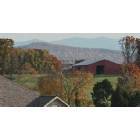
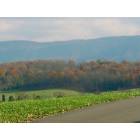
Maryville: An Autumn Shot From a Hillside off 321.

Maryville: Maryville Library

Maryville: Sunset over Maryville City
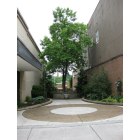
Maryville: River View, Courtyard
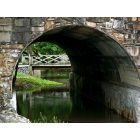
Maryville: Along the Greenbelt
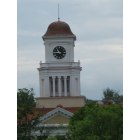
Maryville: Courthouse
- see
19
more - add
your


Submit your own pictures of this city and show them to the world
- OSM Map
- General Map
- Google Map
- MSN Map
Population change since 2000: +41.5%
 |
| Males: 15,529 | |
| Females: 17,187 |
| Median resident age: | 41.7 years |
| Tennessee median age: | 39.2 years |
Zip codes: 37803.
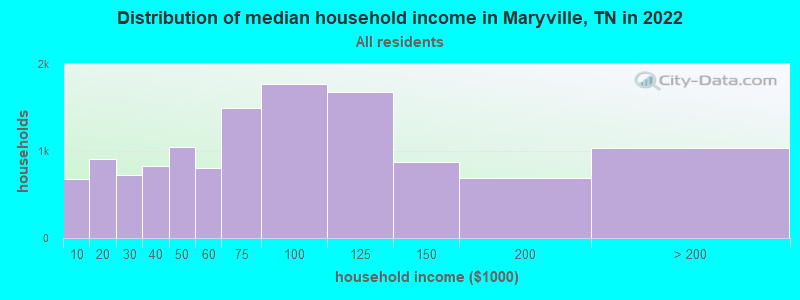
| Maryville: | $73,370 |
| TN: | $65,254 |
Estimated per capita income in 2022: $37,898 (it was $21,556 in 2000)
Maryville city income, earnings, and wages data
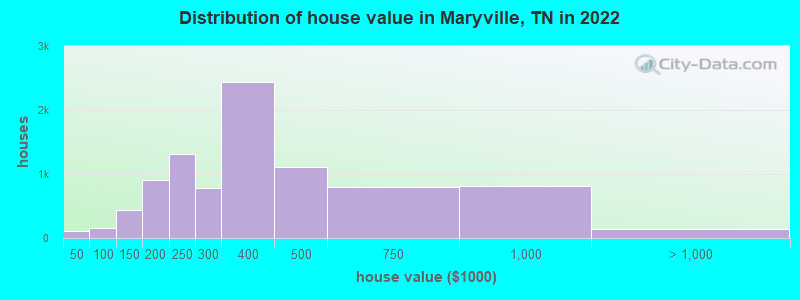
Estimated median house or condo value in 2022: $331,759 (it was $115,600 in 2000)
| Maryville: | $331,759 |
| TN: | $284,800 |
Mean prices in 2022: all housing units: $380,173; detached houses: $387,908; townhouses or other attached units: $342,255; in 2-unit structures: $390,176; in 3-to-4-unit structures: $230,609; in 5-or-more-unit structures: $242,736; mobile homes: $44,200
Median gross rent in 2022: $993.
(7.8% for White Non-Hispanic residents, 0.8% for Black residents, 30.7% for Hispanic or Latino residents, 11.8% for other race residents, 11.0% for two or more races residents)
Detailed information about poverty and poor residents in Maryville, TN


Compare current foreclosures in Maryville, TN:
| Photo | Address | Area | Beds / Baths | Price | Details |
|---|---|---|---|---|---|

|
#1
Fletcher St
Maryville, TN 37804
|
736 sq. feet
|
1 baths - beds |
show details | |

|
#2
Middlewood Dr
Maryville, TN 37803
|
3,624 sq. feet
|
3 baths - beds |
show details | |

|
#3
Montvale Rd
Maryville, TN 37803
|
2,244 sq. feet
|
2 baths - beds |
show details | |

|
#4
Woodlawn Ave
Maryville, TN 37804
|
1,912 sq. feet
|
1 baths - beds |
show details | |

|
#5
Pea Ridge Rd
Maryville, TN 37804
|
2,950 sq. feet
|
3 baths - beds |
show details | |

|
#6
Hutton Ridge Rd
Maryville, TN 37801
|
864 sq. feet
|
1 baths - beds |
show details | |

|
#7
Hope St
Maryville, TN 37801
|
1,120 sq. feet
|
1 baths - beds |
show details | |

|
#8
W Ray Ave
Maryville, TN 37803
|
975 sq. feet
|
1 baths - beds |
show details | |

|
#9
Sevierville Rd
Maryville, TN 37804
|
2,286 sq. feet
|
2 baths - beds |
show details | |

|
#10
Manchester Dr
Maryville, TN 37803
|
2,044 sq. feet
|
2 baths - beds |
show details |
| Photo | Address | Area | Beds / Baths | Price | Details |
|---|---|---|---|---|---|

|
#11
Howell Cir
Maryville, TN 37803
|
1,672 sq. feet
|
2 baths - beds |
show details | |

|
#12
Country Meadows Ln
Maryville, TN 37803
|
1,968 sq. feet
|
3 baths - beds |
show details | |

|
#13
Haverford Ln
Maryville, TN 37804
|
1,326 sq. feet
|
2 baths - beds |
show details | |

|
#14
Big Springs Rd
Maryville, TN 37801
|
1,766 sq. feet
|
1 baths - beds |
show details | |

|
#15
Orton Dr
Maryville, TN 37804
|
1,070 sq. feet
|
1 baths - beds |
show details | |

|
#16
Druid Hill Dr
Maryville, TN 37804
|
1,352 sq. feet
|
2 baths - beds |
show details | |

|
#17
Mackenzie Dr
Maryville, TN 37804
|
1,770 sq. feet
|
2 baths - beds |
show details | |

|
#18
Pineview Rd
Maryville, TN 37803
|
1,960 sq. feet
|
1 baths - beds |
show details | |

|
#19
Glenfield Cir
Maryville, TN 37804
|
1,572 sq. feet
|
2 baths - beds |
show details | |

|
#20
Belle St
Maryville, TN 37803
|
969 sq. feet
|
1 baths - beds |
show details |
| Photo | Address | Area | Beds / Baths | Price | Details |
|---|---|---|---|---|---|

|
#21
Highland Rd
Maryville, TN 37801
|
1,560 sq. feet
|
2 baths - beds |
show details | |

|
#22
Ingrid Dr
Maryville, TN 37801
|
1,674 sq. feet
|
2 baths - beds |
show details | |

|
#23
Martin St
Maryville, TN 37804
|
1,286 sq. feet
|
1 baths - beds |
show details | |

|
#24
Linda Ln
Maryville, TN 37803
|
2,528 sq. feet
|
1 baths - beds |
show details | |

|
#25
Old Niles Ferry Rd
Maryville, TN 37803
|
2,650 sq. feet
|
1 baths - beds |
show details | |

|
#26
Tech Dr
Maryville, TN 37803
|
1,232 sq. feet
|
2 baths - beds |
show details | |

|
#27
Tarpley St
Maryville, TN 37804
|
1,590 sq. feet
|
2 baths - beds |
show details | |

|
#28
Ridgecrest Dr
Maryville, TN 37803
|
1,281 sq. feet
|
2 baths - beds |
show details | |

|
#29
Westside Dr
Maryville, TN 37801
|
1,008 sq. feet
|
1 baths - beds |
show details | |

|
#30
Lancaster Ln
Maryville, TN 37803
|
1,700 sq. feet
|
2 baths - beds |
show details |
| Photo | Address | Area | Beds / Baths | Price | Details |
|---|---|---|---|---|---|

|
#31
Southern Oaks Dr
Maryville, TN 37801
|
1,436 sq. feet
|
2 baths - beds |
show details | |

|
#32
Fletcher St
Maryville, TN 37804
|
729 sq. feet
|
1 baths - beds |
show details | |

|
#33
Cardinal St
Maryville, TN 37803
|
1,100 sq. feet
|
2 baths - beds |
show details | |

|
#34
Mcnabb Pl
Maryville, TN 37801
|
960 sq. feet
|
1 baths - beds |
show details | |

|
#35
Jefferson Ave
Maryville, TN 37804
|
1,287 sq. feet
|
1 baths - beds |
show details | |

|
#36
Old Piney Rd
Maryville, TN 37803
|
840 sq. feet
|
1 baths - beds |
show details | |

|
#37
Lenore Ln
Maryville, TN 37804
|
3,887 sq. feet
|
4 baths - beds |
show details | |

|
#38
Portland Dr
Maryville, TN 37803
|
1,692 sq. feet
|
2 baths - beds |
show details | |

|
#39
Mo Dell Way
Maryville, TN 37801
|
1,544 sq. feet
|
2 baths - beds |
show details | |

|
#40
Ridgeway Trl
Maryville, TN 37801
|
1,720 sq. feet
|
2 baths - beds |
show details |
| Photo | Address | Area | Beds / Baths | Price | Details |
|---|---|---|---|---|---|

|
#41
Gateway Rd
Maryville, TN 37804
|
1,338 sq. feet
|
2 baths - beds |
show details | |

|
#42
Mcginley St
Maryville, TN 37804
|
728 sq. feet
|
1 baths - beds |
show details | |

|
#43
Grove St
Maryville, TN 37804
|
736 sq. feet
|
1 baths - beds |
show details | |

|
#44
Montvale Rd
Maryville, TN 37803
|
1,144 sq. feet
|
2 baths - beds |
show details | |

|
#45
Rafer Ave
Maryville, TN 37803
|
1,792 sq. feet
|
- baths - beds |
show details | |

|
#46
Keystone Dr
Maryville, TN 37804
|
1,578 sq. feet
|
2 baths - beds |
show details | |

|
#47
Timberview Ct
Maryville, TN 37801
|
1,227 sq. feet
|
2 baths - beds |
show details | |

|
#48
Arthur Ave
Maryville, TN 37804
|
836 sq. feet
|
1 baths - beds |
show details | |

|
#49
Quail Run Dr
Maryville, TN 37804
|
1,528 sq. feet
|
2 baths - beds |
show details | |

|
Check over 1 million property listings on Foreclosure.com!
|
browse all offers | |||


- 29,05888.6%White alone
- 1,1743.6%Hispanic
- 1,0223.1%Black alone
- 8982.7%Two or more races
- 4331.3%Asian alone
- 1860.6%Other race alone
- 400.1%American Indian alone
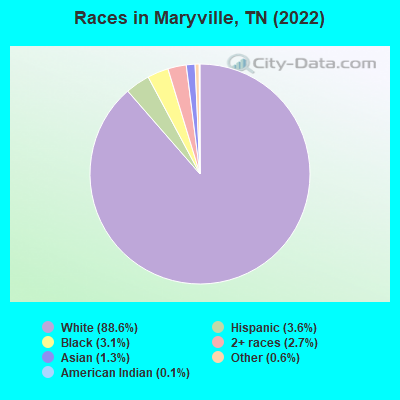
Races in Maryville detailed stats: ancestries, foreign born residents, place of birth
According to our research of Tennessee and other state lists, there were 114 registered sex offenders living in Maryville, Tennessee as of April 27, 2024.
The ratio of all residents to sex offenders in Maryville is 251 to 1.
Type |
2009 |
2010 |
2011 |
2012 |
2013 |
2014 |
2015 |
2016 |
2017 |
2018 |
2019 |
2020 |
2021 |
2022 |
|---|---|---|---|---|---|---|---|---|---|---|---|---|---|---|
| Murders (per 100,000) | 0 (0.0) | 2 (7.3) | 0 (0.0) | 0 (0.0) | 0 (0.0) | 0 (0.0) | 1 (3.5) | 0 (0.0) | 0 (0.0) | 0 (0.0) | 1 (3.4) | 0 (0.0) | 0 (0.0) | 1 (3.1) |
| Rapes (per 100,000) | 0 (0.0) | 5 (18.2) | 10 (36.1) | 4 (14.4) | 9 (32.1) | 4 (14.2) | 1 (3.5) | 5 (17.4) | 6 (20.7) | 8 (27.6) | 4 (13.6) | 2 (6.7) | 12 (39.7) | 12 (36.7) |
| Robberies (per 100,000) | 12 (43.4) | 19 (69.2) | 22 (79.4) | 13 (46.6) | 8 (28.6) | 3 (10.7) | 9 (31.5) | 7 (24.4) | 5 (17.3) | 2 (6.9) | 1 (3.4) | 1 (3.3) | 1 (3.3) | 0 (0.0) |
| Assaults (per 100,000) | 39 (141.1) | 35 (127.4) | 44 (158.8) | 42 (150.7) | 44 (157.1) | 31 (110.3) | 51 (178.7) | 44 (153.5) | 38 (131.4) | 38 (131.2) | 38 (129.2) | 64 (213.3) | 50 (165.2) | 47 (143.7) |
| Burglaries (per 100,000) | 131 (473.9) | 133 (484.3) | 148 (534.0) | 195 (699.6) | 142 (507.0) | 75 (266.8) | 101 (353.9) | 103 (359.4) | 93 (321.6) | 52 (179.6) | 53 (180.2) | 30 (100.0) | 33 (109.0) | 40 (122.3) |
| Thefts (per 100,000) | 574 (2,077) | 755 (2,749) | 668 (2,410) | 633 (2,271) | 570 (2,035) | 563 (2,002) | 471 (1,650) | 552 (1,926) | 504 (1,743) | 400 (1,381) | 375 (1,275) | 282 (939.8) | 215 (710.5) | 229 (699.9) |
| Auto thefts (per 100,000) | 28 (101.3) | 32 (116.5) | 39 (140.7) | 23 (82.5) | 23 (82.1) | 30 (106.7) | 22 (77.1) | 26 (90.7) | 44 (152.2) | 31 (107.0) | 35 (119.0) | 22 (73.3) | 25 (82.6) | 22 (67.2) |
| Arson (per 100,000) | 3 (10.9) | 0 (0.0) | 2 (7.2) | 1 (3.6) | 1 (3.6) | 2 (7.1) | 0 (0.0) | 3 (10.5) | 3 (10.4) | 2 (6.9) | 1 (3.4) | 1 (3.3) | 1 (3.3) | 2 (6.1) |
| City-Data.com crime index | 165.6 | 228.5 | 229.5 | 202.0 | 189.2 | 143.9 | 152.0 | 161.4 | 152.5 | 126.8 | 117.7 | 99.4 | 108.4 | 106.1 |
The City-Data.com crime index weighs serious crimes and violent crimes more heavily. Higher means more crime, U.S. average is 246.1. It adjusts for the number of visitors and daily workers commuting into cities.
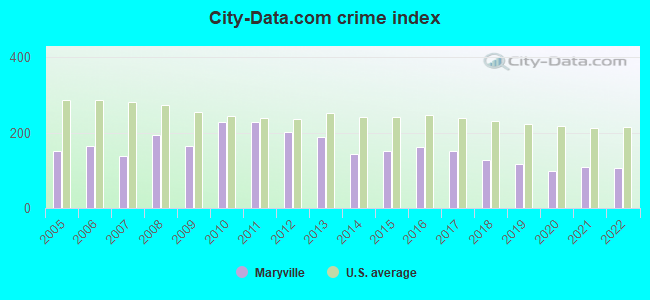
Crime rate in Maryville detailed stats: murders, rapes, robberies, assaults, burglaries, thefts, arson
Full-time law enforcement employees in 2021, including police officers: 62 (57 officers - 53 male; 4 female).
| Officers per 1,000 residents here: | 1.88 |
| Tennessee average: | 2.57 |
 Recent articles from our blog. Our writers, many of them Ph.D. graduates or candidates, create easy-to-read articles on a wide variety of topics.


Latest news from Maryville, TN collected exclusively by city-data.com from local newspapers, TV, and radio stations
Ancestries: American (22.3%), English (13.5%), Irish (10.6%), German (7.6%), Scotch-Irish (5.2%), Scottish (3.6%).
Current Local Time: EST time zone
Incorporated in 1795
Elevation: 940 feet
Land area: 15.9 square miles.
Population density: 2,055 people per square mile (low).
906 residents are foreign born (1.2% Asia, 0.9% Latin America, 0.4% Europe).
| This city: | 2.8% |
| Tennessee: | 5.4% |
Median real estate property taxes paid for housing units with mortgages in 2022: $1,952 (0.7%)
Median real estate property taxes paid for housing units with no mortgage in 2022: $2,595 (0.7%)
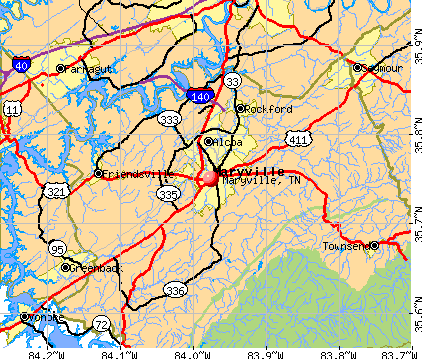
Nearest city with pop. 50,000+: Knoxville, TN  (15.5 miles , pop. 173,890).
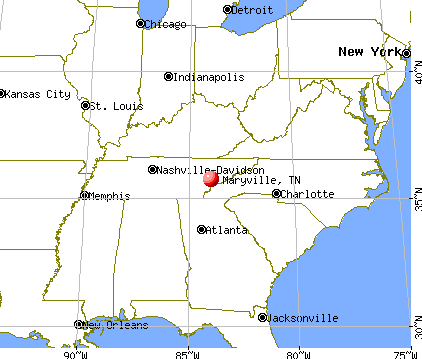
Nearest city with pop. 200,000+: Atlanta, GA (139.8 miles , pop. 416,474).
Nearest city with pop. 1,000,000+: Chicago, IL (466.1 miles , pop. 2,896,016).
Nearest cities:
), ), ), ), )Latitude: 35.75 N, Longitude: 83.98 W
Daytime population change due to commuting: +11,811 (+36.0%)
Workers who live and work in this city: 8,401 (55.1%)
Area code: 865
Maryville tourist attractions:
Maryville, Tennessee accommodation & food services, waste management - Economy and Business Data
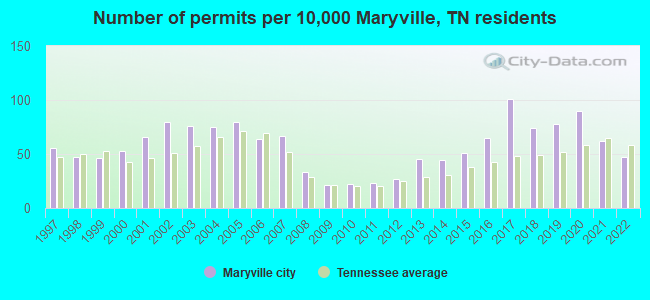
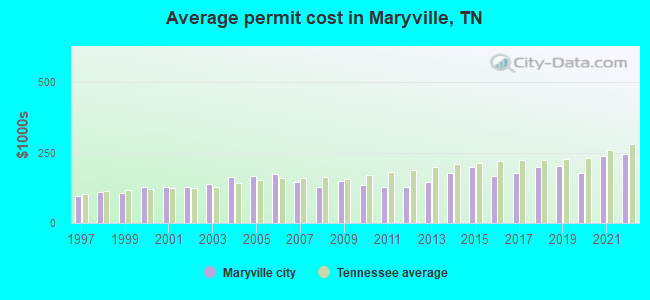
Single-family new house construction building permits:
- 2022: 108 buildings, average cost: $245,300
- 2021: 143 buildings, average cost: $236,400
- 2020: 208 buildings, average cost: $177,700
- 2019: 181 buildings, average cost: $200,700
- 2018: 172 buildings, average cost: $197,800
- 2017: 234 buildings, average cost: $178,400
- 2016: 150 buildings, average cost: $166,800
- 2015: 119 buildings, average cost: $197,900
- 2014: 102 buildings, average cost: $178,500
- 2013: 103 buildings, average cost: $146,400
- 2012: 62 buildings, average cost: $125,500
- 2011: 53 buildings, average cost: $126,400
- 2010: 51 buildings, average cost: $134,600
- 2009: 48 buildings, average cost: $148,800
- 2008: 77 buildings, average cost: $126,500
- 2007: 155 buildings, average cost: $144,100
- 2006: 147 buildings, average cost: $172,700
- 2005: 185 buildings, average cost: $166,000
- 2004: 174 buildings, average cost: $164,400
- 2003: 176 buildings, average cost: $137,200
- 2002: 184 buildings, average cost: $127,100
- 2001: 152 buildings, average cost: $126,400
- 2000: 122 buildings, average cost: $128,000
- 1999: 107 buildings, average cost: $104,600
- 1998: 109 buildings, average cost: $109,000
- 1997: 130 buildings, average cost: $96,700
| Here: | 2.8% |
| Tennessee: | 3.0% |
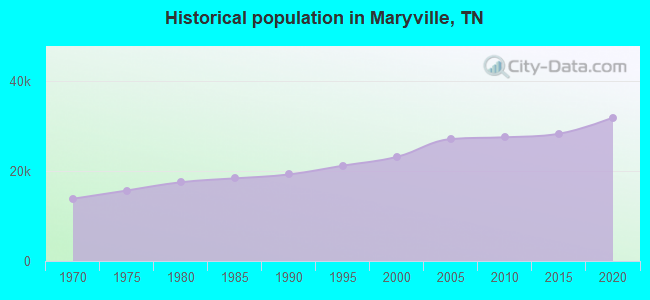
Population change in the 1990s: +2,745 (+13.5%).
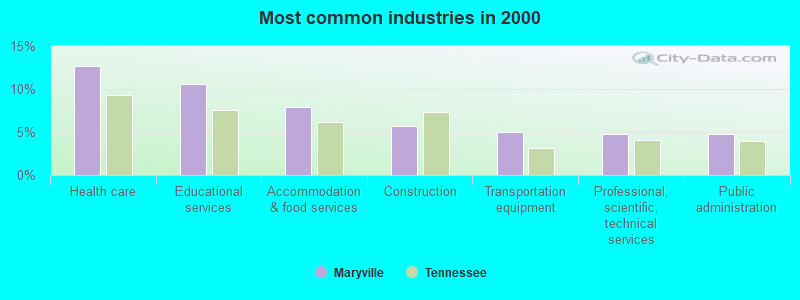
- Health care (12.6%)
- Educational services (10.6%)
- Accommodation & food services (7.9%)
- Construction (5.7%)
- Transportation equipment (5.0%)
- Professional, scientific, technical services (4.8%)
- Public administration (4.8%)
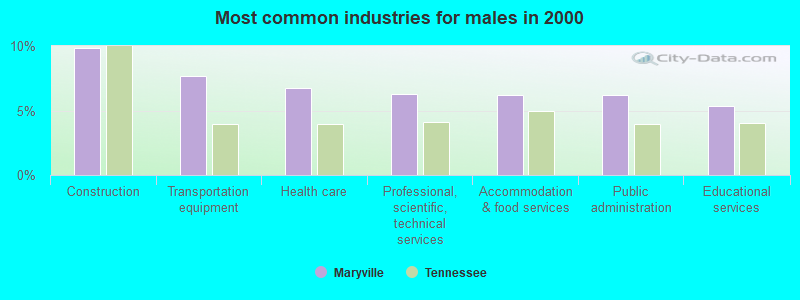
- Construction (9.9%)
- Transportation equipment (7.7%)
- Health care (6.7%)
- Professional, scientific, technical services (6.2%)
- Accommodation & food services (6.2%)
- Public administration (6.2%)
- Educational services (5.4%)
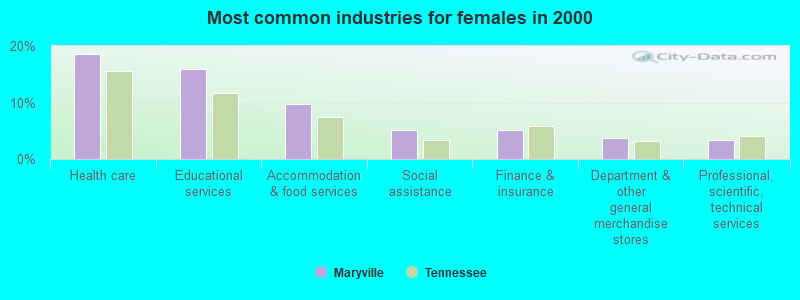
- Health care (18.7%)
- Educational services (15.9%)
- Accommodation & food services (9.7%)
- Social assistance (5.1%)
- Finance & insurance (5.1%)
- Department & other general merchandise stores (3.7%)
- Professional, scientific, technical services (3.3%)
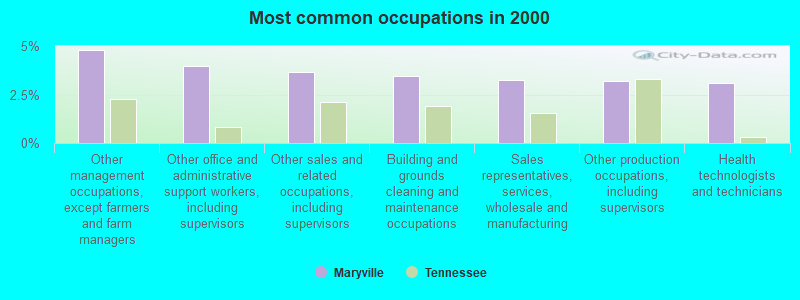
- Other management occupations, except farmers and farm managers (4.8%)
- Other office and administrative support workers, including supervisors (4.0%)
- Other sales and related occupations, including supervisors (3.7%)
- Building and grounds cleaning and maintenance occupations (3.4%)
- Sales representatives, services, wholesale and manufacturing (3.2%)
- Other production occupations, including supervisors (3.2%)
- Health technologists and technicians (3.1%)
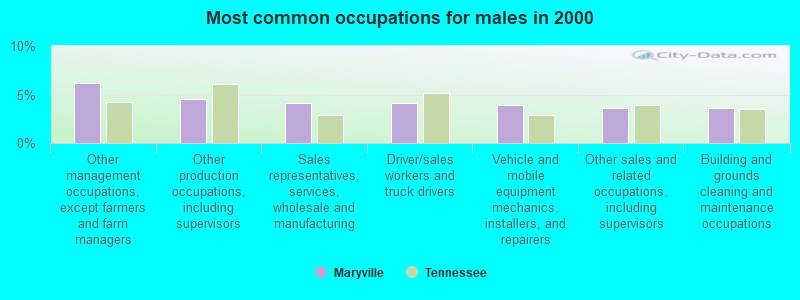
- Other management occupations, except farmers and farm managers (6.2%)
- Other production occupations, including supervisors (4.5%)
- Sales representatives, services, wholesale and manufacturing (4.1%)
- Driver/sales workers and truck drivers (4.1%)
- Vehicle and mobile equipment mechanics, installers, and repairers (3.9%)
- Other sales and related occupations, including supervisors (3.6%)
- Building and grounds cleaning and maintenance occupations (3.6%)
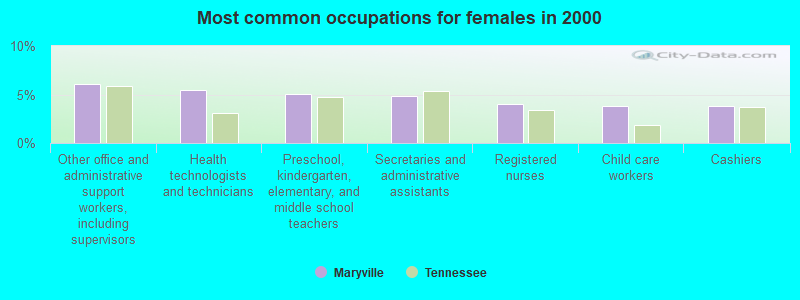
- Other office and administrative support workers, including supervisors (6.1%)
- Health technologists and technicians (5.5%)
- Preschool, kindergarten, elementary, and middle school teachers (5.0%)
- Secretaries and administrative assistants (4.8%)
- Registered nurses (4.1%)
- Child care workers (3.8%)
- Cashiers (3.8%)
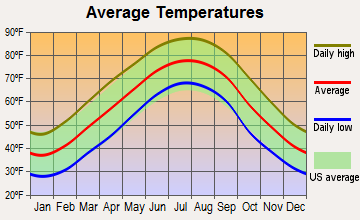
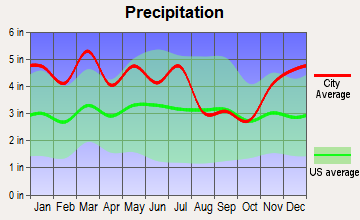
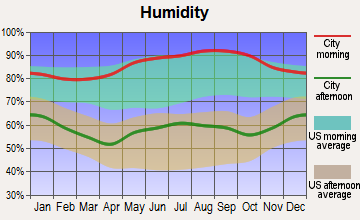
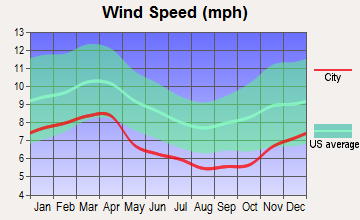
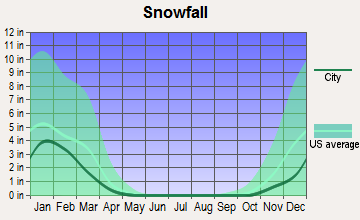
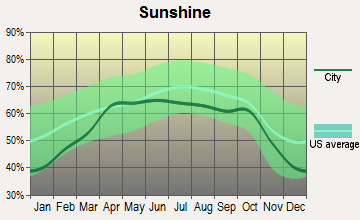
Average climate in Maryville, Tennessee
Based on data reported by over 4,000 weather stations

|
|

(lower is better)
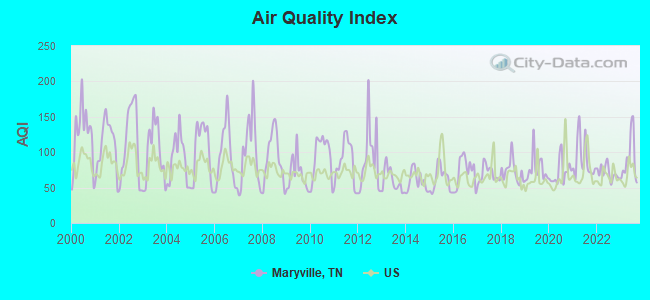
Air Quality Index (AQI) level in 2023 was 89.5. This is worse than average.
| City: | 89.5 |
| U.S.: | 72.6 |
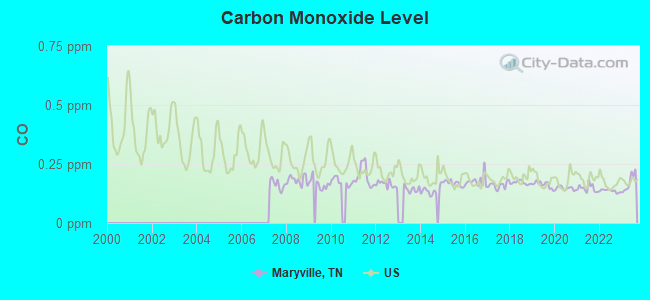
Carbon Monoxide (CO) [ppm] level in 2023 was 0.171. This is significantly better than average. Closest monitor was 8.3 miles away from the city center.
| City: | 0.171 |
| U.S.: | 0.251 |
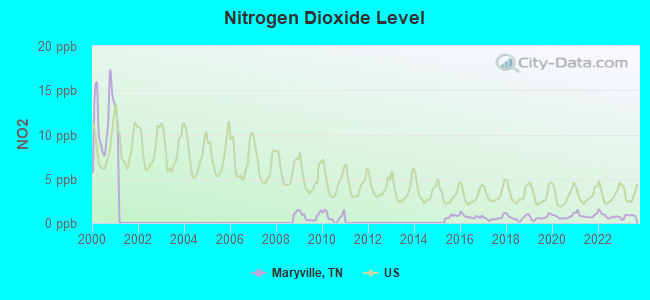
Nitrogen Dioxide (NO2) [ppb] level in 2023 was 0.751. This is significantly better than average. Closest monitor was 8.3 miles away from the city center.
| City: | 0.751 |
| U.S.: | 5.109 |
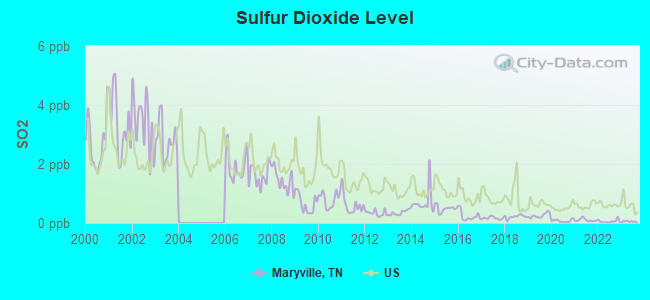
Sulfur Dioxide (SO2) [ppb] level in 2023 was 0.0574. This is significantly better than average. Closest monitor was 8.3 miles away from the city center.
| City: | 0.0574 |
| U.S.: | 1.5147 |
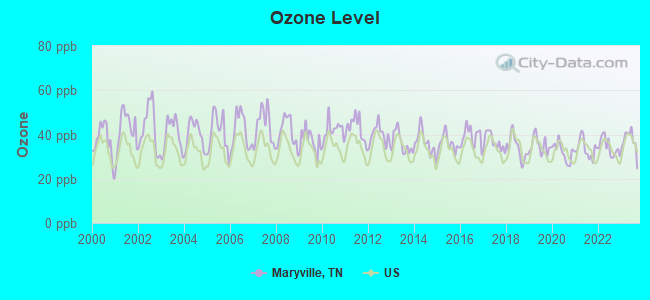
Ozone [ppb] level in 2023 was 37.0. This is about average. Closest monitor was 8.3 miles away from the city center.
| City: | 37.0 |
| U.S.: | 33.3 |
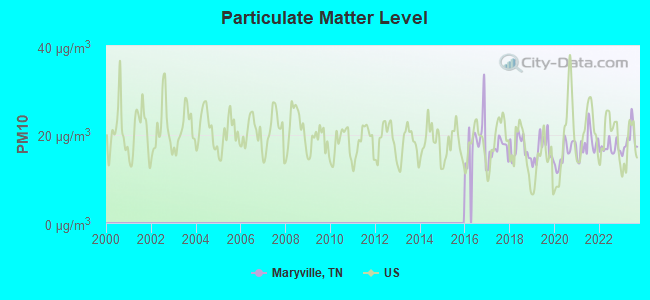
Particulate Matter (PM10) [µg/m3] level in 2023 was 18.9. This is about average. Closest monitor was 2.5 miles away from the city center.
| City: | 18.9 |
| U.S.: | 19.2 |
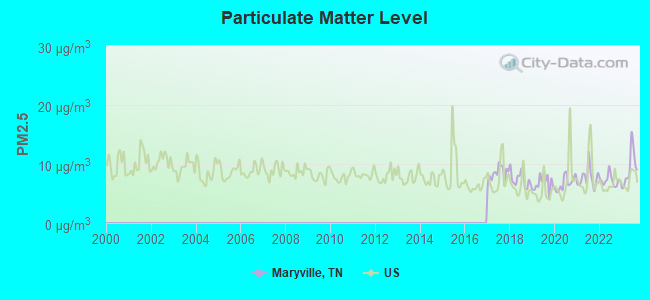
Particulate Matter (PM2.5) [µg/m3] level in 2023 was 9.29. This is about average. Closest monitor was 2.3 miles away from the city center.
| City: | 9.29 |
| U.S.: | 8.11 |
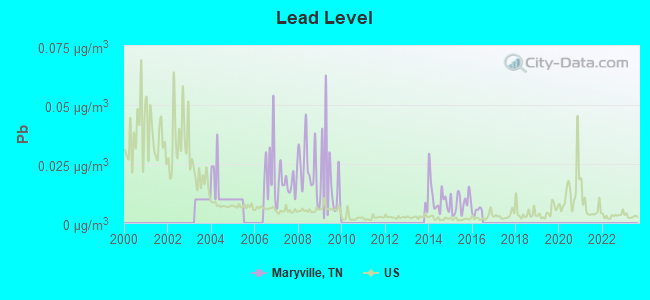
Lead (Pb) [µg/m3] level in 2015 was 0.00868. This is about average. Closest monitor was 0.1 miles away from the city center.
| City: | 0.00868 |
| U.S.: | 0.00931 |
Tornado activity:
Maryville-area historical tornado activity is significantly below Tennessee state average. It is 31% smaller than the overall U.S. average.
On 2/21/1993, a category F3 (max. wind speeds 158-206 mph) tornado 1.4 miles away from the Maryville city center killed one person and injured 55 people and caused between $5000 and $50,000 in damages.
On 4/3/1974, a category F4 (max. wind speeds 207-260 mph) tornado 41.5 miles away from the city center killed 4 people and injured 26 people and caused between $5,000,000 and $50,000,000 in damages.
Earthquake activity:
Maryville-area historical earthquake activity is significantly above Tennessee state average. It is 79% greater than the overall U.S. average.On 11/30/1973 at 07:48:41, a magnitude 4.7 (4.7 MB, 4.6 ML, Class: Light, Intensity: IV - V) earthquake occurred 3.5 miles away from the city center
On 7/27/1980 at 18:52:21, a magnitude 5.2 (5.1 MB, 4.7 MS, 5.0 UK, 5.2 UK, Class: Moderate, Intensity: VI - VII) earthquake occurred 169.8 miles away from Maryville center
On 8/9/2020 at 12:07:37, a magnitude 5.1 (5.1 MW, Depth: 4.7 mi) earthquake occurred 168.7 miles away from Maryville center
On 4/29/2003 at 08:59:39, a magnitude 4.9 (4.4 MB, 4.6 MW, 4.9 LG) earthquake occurred 127.6 miles away from the city center
On 12/12/2018 at 09:14:43, a magnitude 4.4 (4.4 MW, Depth: 4.9 mi) earthquake occurred 43.5 miles away from Maryville center
On 8/2/1974 at 08:52:09, a magnitude 4.9 (4.3 MB, 4.9 LG) earthquake occurred 154.9 miles away from the city center
Magnitude types: regional Lg-wave magnitude (LG), body-wave magnitude (MB), local magnitude (ML), surface-wave magnitude (MS), moment magnitude (MW)
Natural disasters:
The number of natural disasters in Blount County (13) is near the US average (15).Major Disasters (Presidential) Declared: 8
Emergencies Declared: 2
Causes of natural disasters: Floods: 8, Storms: 6, Tornadoes: 4, Heavy Rains: 2, Winds: 2, Winter Storms: 2, Flash Flood: 1, Hurricane: 1, Landslide: 1, Mudslide: 1, Snowfall: 1, Other: 1 (Note: some incidents may be assigned to more than one category).
Main business address for: RUBY TUESDAY INC (RETAIL-EATING PLACES).
Hospitals in Maryville:
- BLOUNT MEMORIAL HOSPITAL (Government - Local, provides emergency services, 907 E LAMAR ALEXANDER PARKWAY)
- MARYVILLE SURGICAL CENTER (763 E LAMAR ALEXANDER PARKWAY)
Nursing Homes in Maryville:
- ASBURY ACRES RETIREMENT CENTER (U S HWY 411)
- ASBURY PLACE AT MARYVILLE (2648 SEVIERVILLE RD)
- BLOUNT MEMORIAL TRANS CARE CTR (2320 EAST LAMAR ALEXANDER PKWY)
- COLONIAL HILLS NURSING CENTER (2034 COCHRAN RD)
- FAIRPARK HEALTHCARE CENTER (307 N FIFTH ST BOX 5477)
- FAIRPARK HEALTHCASE CENTER (307 N FIFTH ST)
- HILLHAVEN MARYVILLE CONVALESCENT CTR (1012 JAMESTOWN WAY)
- KINDRED NURSING AND REHABILITATION-MARYVILLE (1012 JAMESTOWN WAY)
- SHANNONDALE OF MARYVILLE HEALTH CARE CENTER (803 SHANNONDALE WAY)
Dialysis Facilities in Maryville:
- DCI MARYVILLE (1851 CREST RD)
- EAST TN DIALYSIS CTR., INC. (1629 EAST BROADWAY)
- TOTAL RENAL CARE, INC. (714 EAST HARPER STREET)
Home Health Centers in Maryville:
Airports located in Maryville:
- Montvale Airpark Airport (TN87) (Runways: 1)
College/University in Maryville:
Colleges/universities with over 2000 students nearest to Maryville:
- The University of Tennessee-Knoxville (about 15 miles; Knoxville, TN; Full-time enrollment: 25,483)
- Pellissippi State Community College (about 18 miles; Knoxville, TN; FT enrollment: 7,271)
- Roane State Community College (about 38 miles; Harriman, TN; FT enrollment: 4,302)
- Walters State Community College (about 52 miles; Morristown, TN; FT enrollment: 4,359)
- Western Carolina University (about 58 miles; Cullowhee, NC; FT enrollment: 8,684)
- Lincoln Memorial University (about 61 miles; Harrogate, TN; FT enrollment: 3,706)
- Cleveland State Community College (about 64 miles; Cleveland, TN; FT enrollment: 2,500)
Public high schools in Maryville:
- WILLIAM BLOUNT HIGH SCHOOL (Students: 1,725, Location: 219 COUNTY FARM RD, Grades: 9-12)
- HERITAGE HIGH SCHOOL (Students: 1,594, Location: 3741 E LAMAR ALEX PKWY, Grades: 9-12)
- MARYVILLE HIGH SCHOOL (Students: 1,496, Location: 825 LAWRENCE AV, Grades: 10-12)
- MARYVILLE JUNIOR HIGH SCHOOL (Students: 814, Location: 805 MONTVALE STA RD, Grades: 8-9)
Private high schools in Maryville:
Biggest public elementary/middle schools in Maryville:
- HERITAGE MIDDLE SCHOOL (Students: 717, Location: 3737 E LAMAR ALEX PKWY, Grades: 6-8)
- CARPENTERS MIDDLE SCHOOL (Students: 714, Location: 920 HUFFSTETLER RD, Grades: 6-8)
- LANIER ELEMENTARY (Students: 653, Location: 6006 LANIER RD, Grades: PK-5)
- PORTER ELEMENTARY (Students: 634, Location: 4520 WILDWOOD SPRINGS RD, Grades: KG-5)
- MARY BLOUNT ELEMENTARY (Students: 605, Location: 131 SOUTH OLD GLORY RD, Grades: PK-5)
- MONTVALE ELEMENTARY (Students: 548, Location: 3128 MONTVALE RD, Grades: KG-5)
- JOHN SEVIER ELEMENTARY (Students: 546, Location: 2001 SEQUOYAH AVENUE, Grades: PK-3)
- FOOTHILLS ELEMENTARY (Students: 513, Location: 520 SANDY SPRINGS RD, Grades: KG-3)
- SAM HOUSTON ELEMENTARY (Students: 474, Location: 330 MELROSE ST, Grades: PK-3)
- EAGLETON ELEMENTARY (Students: 449, Location: 708 SAM HOUSTON SCHOOL RD, Grades: PK-5)
Private elementary/middle school in Maryville:
User-submitted facts and corrections:
- Alcoa-Maryville Church of God, 2615 E. Lamar Alexander Pkwy., Maryville, TN 37804 is another church in this great city. For more information, please visit the church web site: http://amcog.org
- Maryville is also the birthplace of Lamar Alexander, United States Senator (R-Tennessee) added by Jason
- Maryville Christian School is another Private Christan School in Maryville. Please Add.
added by Debbie Dotson
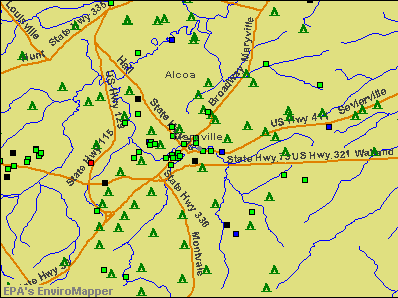
Points of interest:
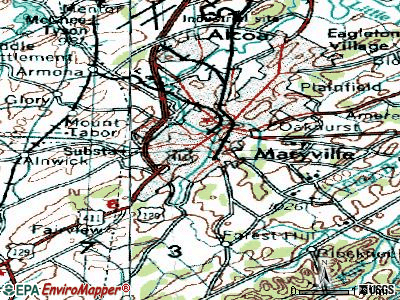
Notable locations in Maryville: Blount County Industrial Park (A), Blount County Fire Protection District Station 1 (B), City of Maryville Fire Department Station 1 (C), Asbury Acres (D), City of Maryville Fire Department Station 2 (E), City of Maryville Fire Department Station 3 (F), Blount County Courthouse (G), Maryville City Hall (H), Blount County Library (I), Union Planters Building (J), Broadway Tower (K). Display/hide their locations on the map
Shopping Centers: Foothills Mall Shopping Center (1), Foothills Plaza Shopping Center (2). Display/hide their locations on the map
Main business address in Maryville: RUBY TUESDAY INC (A). Display/hide its location on the map
Churches in Maryville include: Second Presbyterian Church (A), Maryville Christian Church (B), Saint Paul Church (C), Grandview Church (D), Victory Church (E), Trinity Church (F), Pilgrim Church (G), West Maryville Church (H), Maryville Church of Christ (I). Display/hide their locations on the map
Cemeteries: Cedar Cemetery (1), Friends Cemetery (2), New Providence Cemetery (3), East Maryville Cemetery (4), Wilder Cemetery (5), College Cemetery (6), Magnolia Cemetery (7). Display/hide their locations on the map
Streams, rivers, and creeks: Pistol Branch (A), Duncan Branch (B), Brown Creek (C). Display/hide their locations on the map
Parks in Maryville include: Shields Stadium (1), Amerine Park (2), Sandy Springs Park (3), Bicentennial Park (4), Everett Football Field (5), John Sevier Park (6), Everett Park (7). Display/hide their locations on the map
Tourist attractions: Sam Houston Schoolhouse (Historical Places & Services; 3650 Old Sam Houston Scho) (1), U S Government - National Park Service- Great Smoky Mountains National Park- Tremont Ranger Sta (Recreation Areas; 221 Court Street) (2), Foothills Paint Ball (Amusement & Theme Parks; 2725 US Highway 411 South) (3), All Seasons Vacation Center LLC (Tours & Charters; 636 West Lamar Alexander Parkway) (4). Display/hide their approximate locations on the map
Hotels: Four Eleven Motel (2651 US Highway 411 South) (1), American Classic Suites (805 Foothills Mall Drive) (2), Courtyard Apartments (204 Courtyard Circle) (3), Hamby Lowell (204 Courtyard Circle) (4). Display/hide their approximate locations on the map
Courts: Blount County - Juvenile Court Clerk (391 Court Street) (1), Blount County - General Sessions Court Clerk (928 East Lamar Alexander Parkway) (2), Blount County - Drug Court (950 East Lamar Alexander Parkway) (3), Blount County - Circuit Court Clerk (926 East Lamar Alexander Parkway) (4), Blount County - Sheriff Department- Court Services (942 East Lamar Alexander Parkway) (5). Display/hide their approximate locations on the map
Birthplace of: Lamar Alexander - Senior Senator, Charles W. Cansler - African s' rights activist, Latisha Wilder - Bodybuilder, Lee Humphrey - College basketball player (Florida Gators), Melanie Hutsell - Film actor, Mike Cross (musician) - Guitarist, Scott Feather - College basketball player (Wake Forest Demon Deacons).
Drinking water stations with addresses in Maryville and their reported violations in the past:
SOUTH BLOUNT UTILITY DISTRICT (Population served: 40,065, Surface water):Past monitoring violations:U. S. 129 DRAGON STORE (Population served: 350, Groundwater):
- Monitoring, Turbidity (Enhanced SWTR) - In MAR-2013, Contaminant: IESWTR. Follow-up actions: St Violation/Reminder Notice (MAY-01-2013), St Public Notif requested (MAY-01-2013)
- Monitoring, Routine (IDSE) - Between OCT-2008 and NOV-2008, Contaminant: Total Haloacetic Acids (HAA5). Follow-up actions: St Public Notif requested (FEB-06-2009), St Violation/Reminder Notice (FEB-06-2009), St Compliance achieved (FEB-18-2009)
- Monitoring, Routine (IDSE) - Between OCT-2008 and NOV-2008, Contaminant: TTHM. Follow-up actions: St Public Notif requested (FEB-06-2009), St Violation/Reminder Notice (FEB-06-2009), St Compliance achieved (FEB-18-2009)
- One regular monitoring violation
Past monitoring violations:HARMONY AT MONTVALE (Population served: 100, Groundwater):
- One routine major monitoring violation
Past monitoring violations:
- One routine major monitoring violation
Drinking water stations with addresses in Maryville that have no violations reported:
- MARYVILLE DEPT OF WAT QUAL CON (Population served: 38,240, Primary Water Source Type: Surface water)
| This city: | 2.4 people |
| Tennessee: | 2.5 people |
| This city: | 65.6% |
| Whole state: | 67.3% |
| This city: | 4.4% |
| Whole state: | 5.8% |
Likely homosexual households (counted as self-reported same-sex unmarried-partner households)
- Lesbian couples: 0.4% of all households
- Gay men: 0.2% of all households
People in group quarters in Maryville in 2010:
- 747 people in college/university student housing
- 529 people in nursing facilities/skilled-nursing facilities
- 341 people in local jails and other municipal confinement facilities
- 8 people in group homes for juveniles (non-correctional)
- 8 people in residential treatment centers for juveniles (non-correctional)
- 7 people in group homes intended for adults
- 4 people in emergency and transitional shelters (with sleeping facilities) for people experiencing homelessness
People in group quarters in Maryville in 2000:
- 687 people in college dormitories (includes college quarters off campus)
- 468 people in nursing homes
- 270 people in local jails and other confinement facilities (including police lockups)
- 119 people in other noninstitutional group quarters
- 42 people in hospitals/wards and hospices for chronically ill
- 42 people in other hospitals or wards for chronically ill
- 18 people in training schools for juvenile delinquents
- 9 people in homes for the mentally retarded
- 8 people in homes for the mentally ill
Banks with most branches in Maryville (2011 data):
- First Tennessee Bank, National Association: 7 branches. Info updated 2009/09/08: Bank assets: $24,563.4 mil, Deposits: $16,402.1 mil, headquarters in Memphis, TN, positive income, Commercial Lending Specialization, 180 total offices, Holding Company: First Horizon National Corporation
- Citizens Bank of Blount County: Fair Park Branch, Citizens Bank Of Blount County, Foothills Mall Branch, Heritage Branch, 411 South Branch. Info updated 2010/10/28: Bank assets: $339.6 mil, Deposits: $280.8 mil, local headquarters, positive income, Commercial Lending Specialization, 12 total offices, Holding Company: Twin Cities Financial Services, Inc.
- Mountain National Bank: West Maryville Branch, Maryville Regional Office Branch, Justice Center Branch. Info updated 2006/11/03: Bank assets: $509.3 mil, Deposits: $432.2 mil, headquarters in Sevierville, TN, negative income in the last year, Commercial Lending Specialization, 12 total offices, Holding Company: Mountain National Bancshares, Inc.
- Regions Bank: West Maryville Branch, Walland Highway Branch, West Maryville Branch. Info updated 2011/02/24: Bank assets: $123,368.2 mil, Deposits: $98,301.3 mil, headquarters in Birmingham, AL, positive income, Commercial Lending Specialization, 1778 total offices, Holding Company: Regions Financial Corporation
- Capital Bank, National Association: Eagleton Branch, Heritage Branch, West Maryville Branch. Info updated 2011/09/21: Bank assets: $6,448.0 mil, Deposits: $5,135.4 mil, headquarters in Miami, FL, positive income, Commercial Lending Specialization, 152 total offices, Holding Company: North American Financial Holdings, Inc.
- Foothills Bank & Trust: at 214 Keller Lane, branch established on 2007/06/04; Lamar Alexander Parkway Office Branc at 2430 E Lamar Alexander Parkway, branch established on 2008/01/02. Info updated 2010/10/01: Bank assets: $152.6 mil, Deposits: $125.0 mil, local headquarters, positive income, Commercial Lending Specialization, 3 total offices
- U.S. Bank National Association: Maryville College Branch at 826 E. Lamar Alexander Parkway, branch established on 2007/03/01; Maryville - Main Branch at 417 Foothills Mall Drive, branch established on 2004/05/17. Info updated 2012/01/30: Bank assets: $330,470.8 mil, Deposits: $236,091.5 mil, headquarters in Cincinnati, OH, positive income, 3121 total offices, Holding Company: U.S. Bancorp
- SunTrust Bank: Foothills Branch at 1804 W Broadway Ave, branch established on 1998/08/03; Maryville Kroger Branch at 730 Watkins Road, branch established on 2002/06/30. Info updated 2010/05/27: Bank assets: $171,291.7 mil, Deposits: $129,833.2 mil, headquarters in Atlanta, GA, positive income, Commercial Lending Specialization, 1716 total offices, Holding Company: Suntrust Banks, Inc.
- Branch Banking and Trust Company: Maryville Washington Street Branch at 220 South Washington Street, branch established on 2001/07/01; Maryville Main Branch at 216 Foothills Mall Drive, branch established on 2006/08/01. Info updated 2010/03/29: Bank assets: $168,867.6 mil, Deposits: $127,549.5 mil, headquarters in Winston Salem, NC, positive income, Commercial Lending Specialization, 1793 total offices, Holding Company: Bb&T Corporation
- 3 other banks with 3 local branches
For population 15 years and over in Maryville:
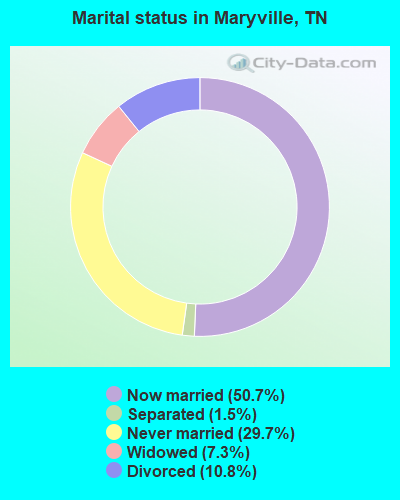
- Never married: 29.7%
- Now married: 50.7%
- Separated: 1.5%
- Widowed: 7.3%
- Divorced: 10.8%
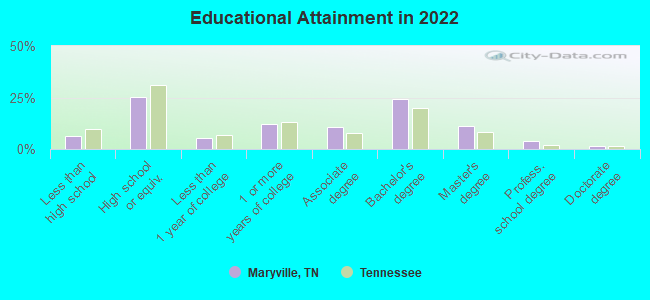
For population 25 years and over in Maryville:
- High school or higher: 93.3%
- Bachelor's degree or higher: 37.2%
- Graduate or professional degree: 15.4%
- Unemployed: 5.3%
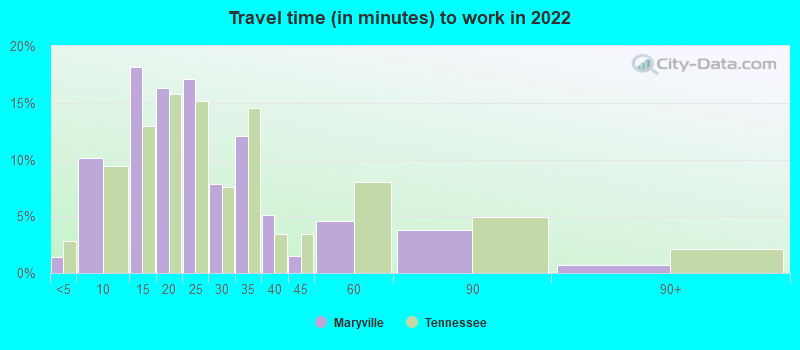
- Mean travel time to work (commute): 16.7 minutes
| Here: | 10.7 |
| Tennessee average: | 11.4 |
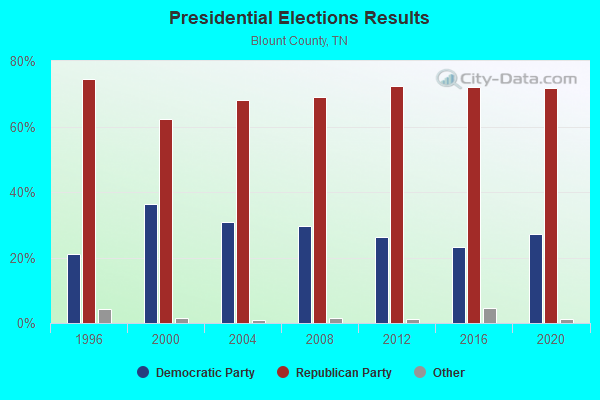
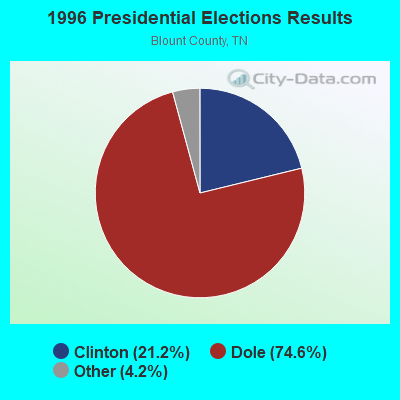
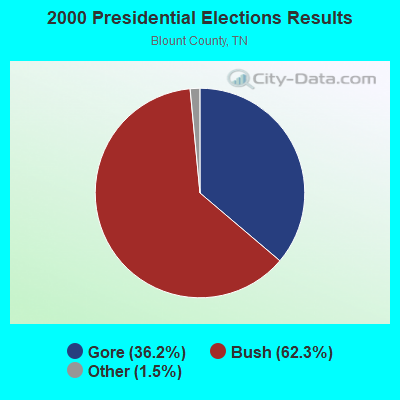

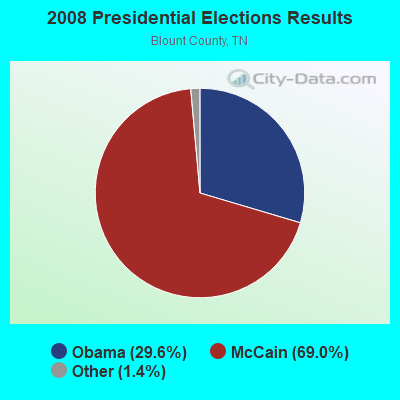

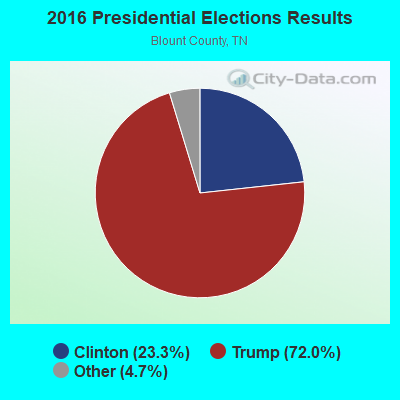

Graphs represent county-level data. Detailed 2008 Election Results
Religion statistics for Maryville, TN (based on Blount County data)
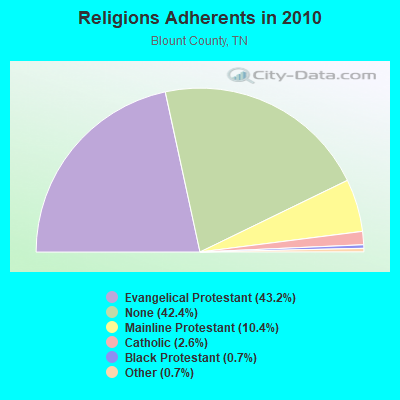
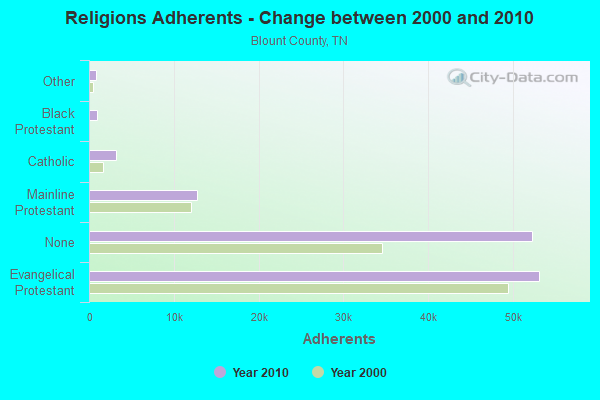
| Religion | Adherents | Congregations |
|---|---|---|
| Evangelical Protestant | 53,117 | 137 |
| Mainline Protestant | 12,736 | 34 |
| Catholic | 3,221 | 3 |
| Black Protestant | 891 | 7 |
| Other | 834 | 5 |
| Orthodox | - | - |
| None | 52,211 | - |
Food Environment Statistics:
| This county: | 1.34 / 10,000 pop. |
| State: | 1.99 / 10,000 pop. |
| Blount County: | 0.08 / 10,000 pop. |
| State: | 0.17 / 10,000 pop. |
| Blount County: | 0.42 / 10,000 pop. |
| State: | 0.65 / 10,000 pop. |
| This county: | 5.10 / 10,000 pop. |
| State: | 5.16 / 10,000 pop. |
| This county: | 6.27 / 10,000 pop. |
| Tennessee: | 6.56 / 10,000 pop. |
| Blount County: | 11.9% |
| State: | 11.4% |
| Blount County: | 29.9% |
| Tennessee: | 30.2% |
| Here: | 27.0% |
| Tennessee: | 13.5% |
Health and Nutrition:
| Maryville: | 49.8% |
| State: | 49.3% |
| This city: | 45.5% |
| Tennessee: | 46.1% |
| This city: | 28.7 |
| Tennessee: | 28.8 |
| Maryville: | 20.1% |
| Tennessee: | 21.0% |
| This city: | 12.5% |
| Tennessee: | 10.5% |
| Here: | 6.8 |
| Tennessee: | 6.8 |
| This city: | 34.3% |
| Tennessee: | 33.9% |
| Maryville: | 55.3% |
| State: | 55.9% |
| Maryville: | 76.8% |
| Tennessee: | 79.1% |
More about Health and Nutrition of Maryville, TN Residents
| Local government employment and payroll (March 2022) | |||||
| Function | Full-time employees | Monthly full-time payroll | Average yearly full-time wage | Part-time employees | Monthly part-time payroll |
|---|---|---|---|---|---|
| Elementary and Secondary - Instruction | 447 | $2,434,334 | $65,351 | 295 | $394,603 |
| Elementary and Secondary - Other Total | 65 | $164,211 | $30,316 | 96 | $108,793 |
| Police Protection - Officers | 60 | $339,161 | $67,832 | 5 | $5,476 |
| Electric Power | 54 | $350,937 | $77,986 | 1 | $1,867 |
| Streets and Highways | 43 | $192,588 | $53,745 | 2 | $1,787 |
| Water Supply | 38 | $207,743 | $65,603 | 0 | $0 |
| Firefighters | 34 | $185,558 | $65,491 | 1 | $106 |
| Other Government Administration | 24 | $183,153 | $91,577 | 13 | $375 |
| Solid Waste Management | 23 | $98,295 | $51,284 | 0 | $0 |
| Financial Administration | 18 | $124,874 | $83,249 | 0 | $0 |
| Sewerage | 16 | $83,437 | $62,578 | 0 | $0 |
| Other and Unallocable | 8 | $39,282 | $58,923 | 0 | $0 |
| Police - Other | 2 | $8,247 | $49,482 | 0 | $0 |
| Fire - Other | 1 | $4,900 | $58,800 | 0 | $0 |
| Judicial and Legal | 1 | $4,900 | $58,800 | 2 | $1,888 |
| Totals for Government | 834 | $4,421,620 | $63,620 | 415 | $514,895 |
Maryville government finances - Expenditure in 2021 (per resident):
- Construction - Sewerage: $333,000 ($10.18)
Elementary and Secondary Education: $65,000 ($1.99)
- Current Operations - Elementary and Secondary Education: $63,087,000 ($1928.32)
Electric Utilities: $59,843,000 ($1829.17)
Water Utilities: $15,416,000 ($471.21)
Solid Waste Management: $7,147,000 ($218.46)
Police Protection: $6,135,000 ($187.52)
Regular Highways: $5,162,000 ($157.78)
Local Fire Protection: $3,976,000 ($121.53)
General - Other: $2,680,000 ($81.92)
Protective Inspection and Regulation - Other: $1,311,000 ($40.07)
Financial Administration: $1,097,000 ($33.53)
General Public Buildings: $1,071,000 ($32.74)
Libraries: $899,000 ($27.48)
Sewerage: $838,000 ($25.61)
Parks and Recreation: $830,000 ($25.37)
Central Staff Services: $757,000 ($23.14)
Health - Other: $345,000 ($10.55)
Judicial and Legal Services: $202,000 ($6.17)
- Electric Utilities - Interest on Debt: $162,000 ($4.95)
- General - Interest on Debt: $2,414,000 ($73.79)
- Intergovernmental to Local - Other - Police Protection: $199,000 ($6.08)
Other - Central Staff Services: $122,000 ($3.73)
Other - Local Fire Protection: $13,000 ($0.40)
- Other Capital Outlay - Elementary and Secondary Education: $1,983,000 ($60.61)
- Total Salaries and Wages: $38,367,000 ($1172.73)
- Water Utilities - Interest on Debt: $1,149,000 ($35.12)
Maryville government finances - Revenue in 2021 (per resident):
- Charges - Elementary and Secondary Education - Other: $4,247,000 ($129.81)
Sewerage: $1,470,000 ($44.93)
Other: $679,000 ($20.75)
Solid Waste Management: $662,000 ($20.23)
Elementary and Secondary Education School Tuition and Transportation: $646,000 ($19.75)
Elementary and Secondary Education School Lunch: $340,000 ($10.39)
Regular Highways: $123,000 ($3.76)
- Local Intergovernmental - Education: $23,545,000 ($719.68)
- Miscellaneous - Interest Earnings: $954,000 ($29.16)
Fines and Forfeits: $897,000 ($27.42)
General Revenue - Other: $517,000 ($15.80)
Rents: $100,000 ($3.06)
Sale of Property: $7,000 ($0.21)
Donations From Private Sources: $7,000 ($0.21)
- Revenue - Electric Utilities: $66,852,000 ($2043.40)
Water Utilities: $20,122,000 ($615.05)
- State Intergovernmental - Education: $32,459,000 ($992.14)
General Local Government Support: $4,342,000 ($132.72)
Highways: $1,172,000 ($35.82)
Other: $234,000 ($7.15)
- Tax - Property: $41,465,000 ($1267.42)
General Sales and Gross Receipts: $25,372,000 ($775.52)
Occupation and Business License - Other: $692,000 ($21.15)
Other License: $35,000 ($1.07)
Other Selective Sales: $15,000 ($0.46)
Maryville government finances - Debt in 2021 (per resident):
- Long Term Debt - Beginning Outstanding - Unspecified Public Purpose: $111,358,000 ($3403.78)
Outstanding Unspecified Public Purpose: $104,122,000 ($3182.60)
Retired Unspecified Public Purpose: $7,236,000 ($221.18)
Maryville government finances - Cash and Securities in 2021 (per resident):
- Bond Funds - Cash and Securities: $8,758,000 ($267.70)
- Other Funds - Cash and Securities: $51,172,000 ($1564.13)
- Sinking Funds - Cash and Securities: $2,717,000 ($83.05)
| Businesses in Maryville, TN | ||||
| Name | Count | Name | Count | |
|---|---|---|---|---|
| AT&T | 1 | Kmart | 1 | |
| Advance Auto Parts | 2 | Kroger | 1 | |
| Aeropostale | 1 | Little Caesars Pizza | 1 | |
| American Eagle Outfitters | 1 | MasterBrand Cabinets | 2 | |
| Arby's | 1 | Maurices | 1 | |
| AutoZone | 1 | McDonald's | 1 | |
| Baskin-Robbins | 3 | Nike | 3 | |
| Bath & Body Works | 1 | Papa John's Pizza | 1 | |
| Blockbuster | 1 | Payless | 1 | |
| Burger King | 1 | Penske | 1 | |
| CVS | 2 | Pizza Hut | 1 | |
| Chick-Fil-A | 1 | RadioShack | 1 | |
| Circle K | 2 | SONIC Drive-In | 3 | |
| Cricket Wireless | 1 | Sears | 2 | |
| Curves | 1 | Sprint Nextel | 1 | |
| Domino's Pizza | 2 | Starbucks | 1 | |
| FedEx | 6 | Subway | 7 | |
| Finish Line | 1 | T-Mobile | 2 | |
| Firestone Complete Auto Care | 1 | T.J.Maxx | 1 | |
| GNC | 1 | Taco Bell | 1 | |
| GameStop | 1 | Target | 1 | |
| H&R Block | 2 | U-Haul | 6 | |
| Hobby Lobby | 1 | U.S. Cellular | 2 | |
| Home Depot | 1 | UPS | 10 | |
| IHOP | 1 | Vans | 1 | |
| JCPenney | 1 | Walgreens | 2 | |
| Jones New York | 2 | Walmart | 1 | |
| KFC | 1 | |||
Strongest AM radio stations in Maryville:
- WGAP (1400 AM; 1 kW; MARYVILLE, TN; Owner: HORNE RADIO, LLC)
- WKVL (850 AM; daytime; 50 kW; KNOXVILLE, TN; Owner: HORNE RADIO, LLC)
- WBCR (1470 AM; 1 kW; ALCOA, TN)
- WVLZ (1180 AM; daytime; 10 kW; KNOXVILLE, TN; Owner: KIRKLAND WIRELESS BROADCASTERS, INC.)
- WNOX (990 AM; 10 kW; KNOXVILLE, TN)
- WRJZ (620 AM; 5 kW; KNOXVILLE, TN; Owner: TENNESSEE MEDIA ASSOCIATES, INC)
- WQBB (1040 AM; daytime; 10 kW; POWELL, TN; Owner: JOURNAL BROADCAST CORPORATION)
- WMTY (670 AM; daytime; 2 kW; FARRAGUT, TN; Owner: HORNE RADIO, LLC)
- WMEN (760 AM; daytime; 2 kW; KNOXVILLE, TN; Owner: THOMAS MOFFIT JR.)
- WSEV (930 AM; 5 kW; SEVIERVILLE, TN; Owner: EAST TENNESSEE RADIO GROUP, L.P.)
- WLFJ (660 AM; daytime; 50 kW; GREENVILLE, SC; Owner: CLEAR CHANNEL BROADCASTING LICENSES, INC.)
- WATO (1290 AM; 5 kW; OAK RIDGE, TN)
- WFGW (1010 AM; 50 kW; BLACK MOUNTAIN, NC; Owner: BLUE RIDGE BROADCASTING CORP.)
Strongest FM radio stations in Maryville:
- WOKI-FM (100.3 FM; OAK RIDGE, TN; Owner: OAK RIDGE FM, INC.)
- WIVK-FM (107.7 FM; KNOXVILLE, TN; Owner: CITADEL BROADCASTING COMPANY)
- WWST (102.1 FM; SEVIERVILLE, TN; Owner: JOURNAL BROADCAST CORPORATION)
- WUOT (91.9 FM; KNOXVILLE, TN; Owner: UNIVERSITY OF TENNESSEE)
- WJXB-FM (97.5 FM; KNOXVILLE, TN; Owner: SOUTH CENTRAL COMMUNICATIONS CORP.)
- WTXM-FM (95.7 FM; MARYVILLE, TN; Owner: SOUTH CENTRAL COMMUNICATIONS CORP.)
- WYLV (89.1 FM; ALCOA, TN; Owner: FOOTHILLS BROADCASTING, INC.)
- WIMZ-FM (103.5 FM; KNOXVILLE, TN; Owner: SOUTH CENTRAL COMM., CORP.)
- WNFZ (94.3 FM; OAK RIDGE, TN; Owner: JOHN W. PIRKLE)
- WDVX (89.9 FM; CLINTON, TN; Owner: CUMBERLAND COMMUNITIES COMMUNI CORP.)
- WCVP-FM (95.9 FM; ROBBINSVILLE, NC; Owner: CHEROKEE BROADCASTING COMPANY, INC.)
- WYIL-FM (98.7 FM; OLIVER SPRINGS, TN; Owner: CITADEL BROADCASTING COMPANY)
- WSEV-FM (105.5 FM; GATLINBURG, TN; Owner: EAST TENNESSEE RADIO GROUP, L.P.)
- WFQS (91.3 FM; FRANKLIN, NC; Owner: WESTERN NORTH CAROLINA PUBLIC RADIO)
- WKZX-FM (93.5 FM; LENOIR CITY, TN; Owner: BP BROADCASTERS, LLC)
- W237AR (95.3 FM; HAZELWOOD, ETC., NC; Owner: WESTERN NORTH CAROLINA PUBLIC RADIO)
- WKHT (104.5 FM; KNOXVILLE, TN; Owner: JOURNAL BROADCAST CORPORATION)
- WMYU (93.1 FM; KARNS, TN; Owner: JOURNAL BROADCAST CORPORATION)
- WYFC (95.3 FM; CLINTON, TN; Owner: BIBLE BROADCASTING NETWORK, INC.)
- WRMX-FM (106.7 FM; NORRIS, TN; Owner: SOUTH CENTRAL COMMUNICATIONS CORPORATION)
TV broadcast stations around Maryville:
- WDTT-LP (Channel 38; LENOIR CITY, TN; Owner: WORD OF GOD FELLOWSHIP, INC.)
- WVLT-TV (Channel 8; KNOXVILLE, TN; Owner: WVLT LICENSEE CORP.)
- WKOP-TV (Channel 15; KNOXVILLE, TN; Owner: EAST TENNESSEE PUBLIC COMMUNICATIONS CORP.)
- WBIR-TV (Channel 10; KNOXVILLE, TN; Owner: GANNETT PACIFIC CORPORATION)
- WATE-TV (Channel 6; KNOXVILLE, TN; Owner: WATE, G.P.)
- WTNZ (Channel 43; KNOXVILLE, TN; Owner: RAYCOM AMERICA, INC.)
- W46DC (Channel 46; KNOXVILLE, TN; Owner: TRINITY BROADCASTING NETWORK)
- WEEE-LP (Channel 32; KNOXVILLE, TN; Owner: TIGER EYE BROADCASTING CORPORATION)
- WEZK-LP (Channel 28; KNOXVILLE, TN; Owner: SOUTH CENTRAL COMMUNICATIONS CORP.)
- W50AB (Channel 50; HIAWASSEE, GA; Owner: GEORGIA PUBLIC TELECOMMUNICATIONS COMMISSION)
- W50CG (Channel 50; KNOXVILLE, TN; Owner: THREE ANGELS BROADCASTING NETWORK, INC.)
- W56CM (Channel 56; KNOXVILLE, TN; Owner: VENTANA TELEVISION, INC.)
- WFEM-LP (Channel 12; HEISKELL, ETC., TN; Owner: H. EARL MARLAR)
- WJZC-LP (Channel 22; SEVIERVILLE, TN; Owner: SOUTH CENTRAL COMMUNICATIONS CORP.)
- National Bridge Inventory (NBI) Statistics
- 58Number of bridges
- 381ft / 116mTotal length
- $16,659,000Total costs
- 592,651Total average daily traffic
- 45,057Total average daily truck traffic
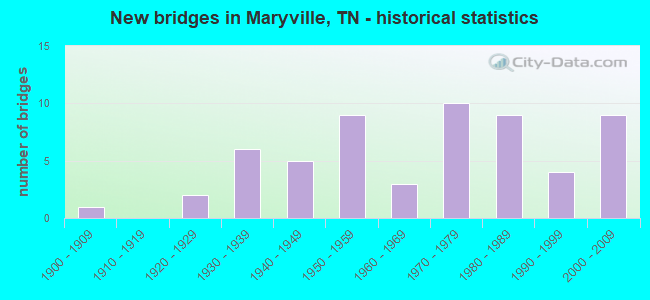
- New bridges - historical statistics
- 11900-1909
- 21920-1929
- 61930-1939
- 51940-1949
- 91950-1959
- 31960-1969
- 101970-1979
- 91980-1989
- 41990-1999
- 92000-2009
FCC Registered Antenna Towers: 280 (See the full list of FCC Registered Antenna Towers)
FCC Registered Commercial Land Mobile Towers: 1 (See the full list of FCC Registered Commercial Land Mobile Towers in Maryville, TN)
FCC Registered Private Land Mobile Towers: 2 (See the full list of FCC Registered Private Land Mobile Towers)
FCC Registered Broadcast Land Mobile Towers: 44 (See the full list of FCC Registered Broadcast Land Mobile Towers)
FCC Registered Microwave Towers: 12 (See the full list of FCC Registered Microwave Towers in this town)
FCC Registered Paging Towers: 2 (See the full list of FCC Registered Paging Towers)
FCC Registered Maritime Coast & Aviation Ground Towers: 3 (See the full list of FCC Registered Maritime Coast & Aviation Ground Towers)
FCC Registered Amateur Radio Licenses: 726 (See the full list of FCC Registered Amateur Radio Licenses in Maryville)
FAA Registered Aircraft: 86 (See the full list of FAA Registered Aircraft in Maryville)
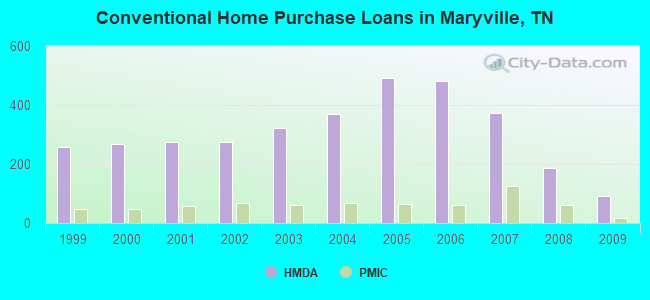
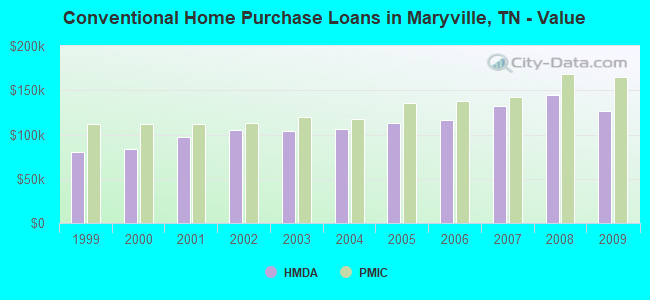
| Home Mortgage Disclosure Act Aggregated Statistics For Year 2009 (Based on 2 full and 7 partial tracts) | ||||||||||||||
| A) FHA, FSA/RHS & VA Home Purchase Loans | B) Conventional Home Purchase Loans | C) Refinancings | D) Home Improvement Loans | E) Loans on Dwellings For 5+ Families | F) Non-occupant Loans on < 5 Family Dwellings (A B C & D) | G) Loans On Manufactured Home Dwelling (A B C & D) | ||||||||
|---|---|---|---|---|---|---|---|---|---|---|---|---|---|---|
| Number | Average Value | Number | Average Value | Number | Average Value | Number | Average Value | Number | Average Value | Number | Average Value | Number | Average Value | |
| LOANS ORIGINATED | 90 | $131,734 | 91 | $126,070 | 522 | $166,344 | 26 | $56,049 | 1 | $407,690 | 55 | $104,008 | 4 | $66,655 |
| APPLICATIONS APPROVED, NOT ACCEPTED | 5 | $160,110 | 3 | $134,663 | 44 | $164,952 | 1 | $117,310 | 0 | $0 | 3 | $90,703 | 2 | $86,875 |
| APPLICATIONS DENIED | 11 | $134,326 | 13 | $111,204 | 153 | $169,716 | 15 | $41,639 | 1 | $53,150 | 10 | $103,991 | 2 | $54,525 |
| APPLICATIONS WITHDRAWN | 13 | $126,991 | 16 | $173,289 | 101 | $170,232 | 5 | $114,032 | 0 | $0 | 9 | $109,792 | 1 | $58,810 |
| FILES CLOSED FOR INCOMPLETENESS | 2 | $148,595 | 0 | $0 | 20 | $150,687 | 0 | $0 | 0 | $0 | 2 | $99,805 | 0 | $0 |
Detailed mortgage data for all 9 tracts in Maryville, TN
| Private Mortgage Insurance Companies Aggregated Statistics For Year 2009 (Based on 2 full and 7 partial tracts) | ||||||
| A) Conventional Home Purchase Loans | B) Refinancings | C) Non-occupant Loans on < 5 Family Dwellings (A & B) | ||||
|---|---|---|---|---|---|---|
| Number | Average Value | Number | Average Value | Number | Average Value | |
| LOANS ORIGINATED | 16 | $165,361 | 20 | $184,073 | 1 | $261,090 |
| APPLICATIONS APPROVED, NOT ACCEPTED | 2 | $362,690 | 7 | $229,726 | 0 | $0 |
| APPLICATIONS DENIED | 2 | $123,350 | 2 | $194,345 | 2 | $123,285 |
| APPLICATIONS WITHDRAWN | 0 | $0 | 3 | $233,610 | 0 | $0 |
| FILES CLOSED FOR INCOMPLETENESS | 1 | $137,860 | 0 | $0 | 0 | $0 |
2002 - 2018 National Fire Incident Reporting System (NFIRS) incidents
- Fire incident types reported to NFIRS in Maryville, TN
- 1,40443.3%Outside Fires
- 1,15735.7%Structure Fires
- 56017.3%Mobile Property/Vehicle Fires
- 1243.8%Other
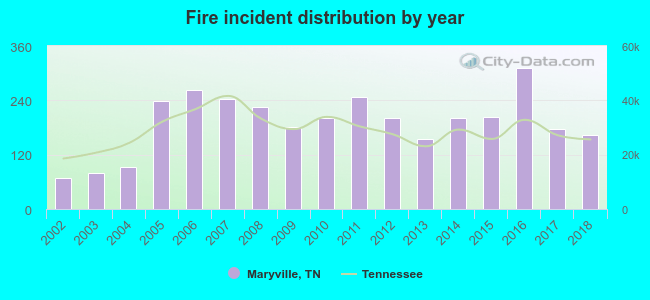 Based on the data from the years 2002 - 2018 the average number of fire incidents per year is 191. The highest number of fire incidents - 311 took place in 2016, and the least - 68 in 2002. The data has an increasing trend.
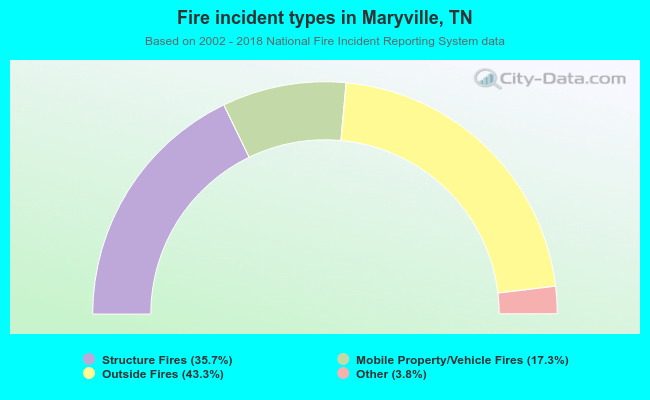 When looking into fire subcategories, the most reports belonged to: Outside Fires (43.3%), and Structure Fires (35.7%).
| Most common first names in Maryville, TN among deceased individuals | ||
| Name | Count | Lived (average) |
|---|---|---|
| James | 606 | 72.5 years |
| John | 464 | 74.6 years |
| William | 445 | 75.6 years |
| Mary | 421 | 78.9 years |
| Robert | 304 | 73.0 years |
| Charles | 289 | 72.4 years |
| Margaret | 184 | 80.0 years |
| George | 183 | 75.8 years |
| Ruth | 164 | 81.5 years |
| Helen | 136 | 79.4 years |
| Most common last names in Maryville, TN among deceased individuals | ||
| Last name | Count | Lived (average) |
|---|---|---|
| Davis | 168 | 76.4 years |
| Smith | 152 | 76.3 years |
| Russell | 151 | 76.7 years |
| Jones | 141 | 77.2 years |
| Williams | 125 | 76.5 years |
| Wilson | 121 | 73.3 years |
| Tipton | 116 | 74.1 years |
| Whitehead | 110 | 74.1 years |
| Long | 110 | 76.2 years |
| Walker | 107 | 77.4 years |

- 54.4%Utility gas
- 44.3%Electricity
- 1.0%Bottled, tank, or LP gas
- 0.3%No fuel used
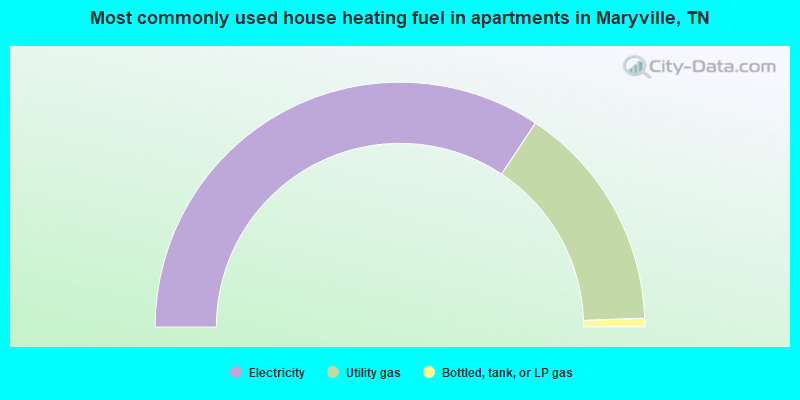
- 68.6%Electricity
- 30.2%Utility gas
- 1.1%Bottled, tank, or LP gas
Maryville compared to Tennessee state average:
- Unemployed percentage below state average.
- Black race population percentage significantly below state average.
- Length of stay since moving in below state average.
- Institutionalized population percentage above state average.
- Percentage of population with a bachelor's degree or higher above state average.

|
|
Total of 141 patent applications in 2008-2024.