Races in Millbrae, California (CA) Detailed Stats
Data:
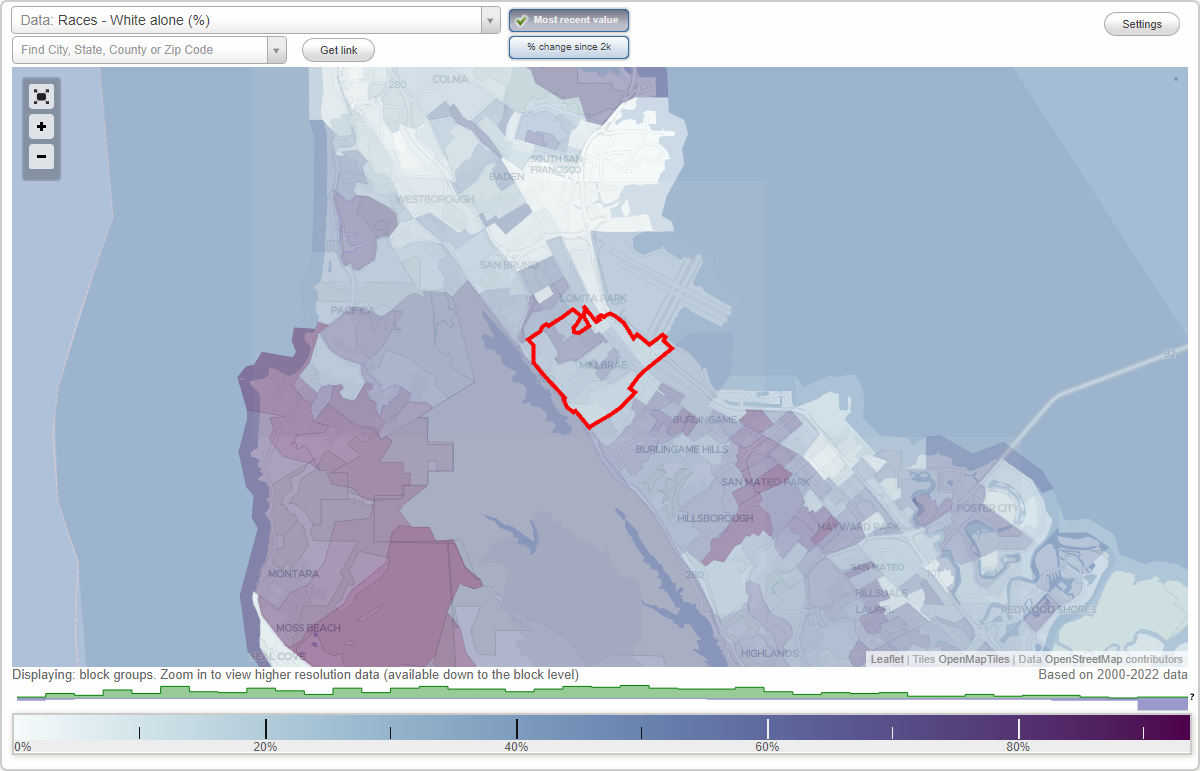
Races - White alone (%)
Races - White alone (% change since 2000)
Races - Black alone (%)
Races - Black alone (% change since 2000)
Races - American Indian alone (%)
Races - American Indian alone (% change since 2000)
Races - Asian alone (%)
Races - Asian alone (% change since 2000)
Races - Hispanic (%)
Races - Hispanic (% change since 2000)
Races - Native Hawaiian and Other Pacific Islander alone (%)
Races - Native Hawaiian and Other Pacific Islander alone (% change since 2000)
Races - Two or more races(%)
Races - Two or more races(% change since 2000)
Races - Other race alone (%)
Races - Other race alone (% change since 2000)
Racial diversity
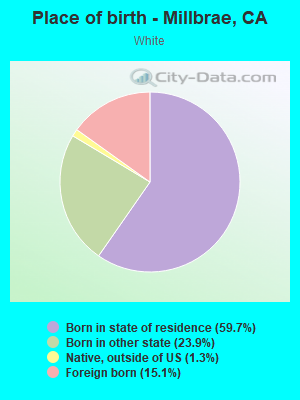
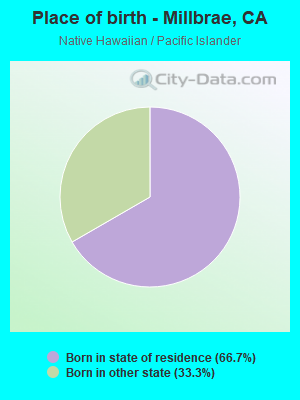
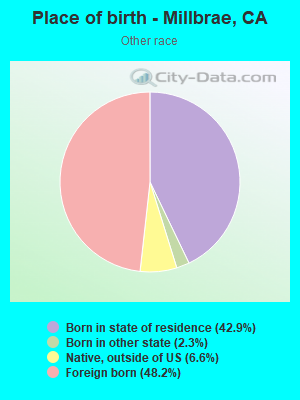
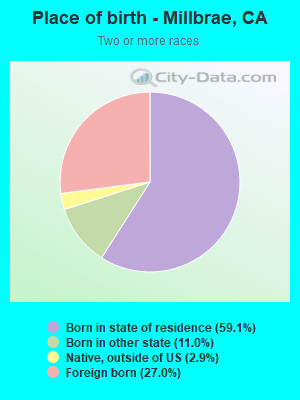
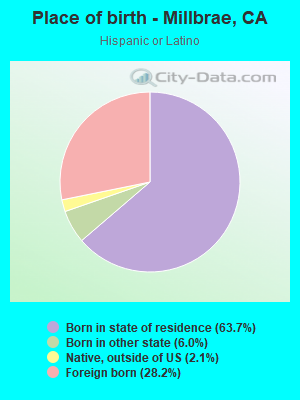
Place of birth - Born in state of residence (%)
Place of birth - Born in state of residence (%) - White
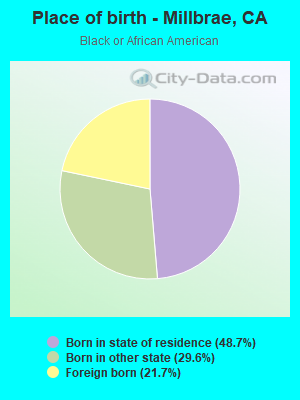
Place of birth - Born in state of residence (%) - Black or African American
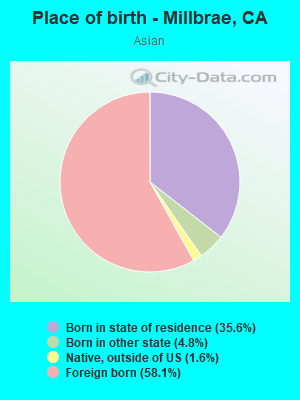
Place of birth - Born in state of residence (%) - Asian
Place of birth - Born in state of residence (%) - Hispanic or Latino
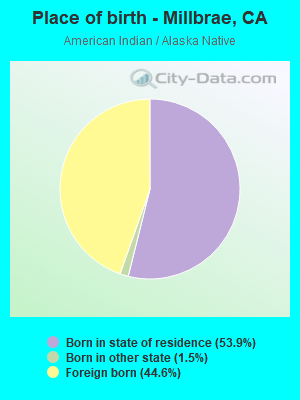
Place of birth - Born in state of residence (%) - American Indian and Alaska Native
Place of birth - Born in state of residence (%) - Multirace
Place of birth - Born in state of residence (%) - Other Race
Place of birth - Born in other state (%)
Place of birth - Born in other state (%) - White
Place of birth - Born in other state (%) - Black or African American
Place of birth - Born in other state (%) - Asian
Place of birth - Born in other state (%) - Hispanic or Latino
Place of birth - Born in other state (%) - American Indian and Alaska Native
Place of birth - Born in other state (%) - Multirace
Place of birth - Born in other state (%) - Other Race
Place of birth - Native, outside of US (%)
Place of birth - Native, outside of US (%) - White
Place of birth - Native, outside of US (%) - Black or African American
Place of birth - Native, outside of US (%) - Asian
Place of birth - Native, outside of US (%) - Hispanic or Latino
Place of birth - Native, outside of US (%) - American Indian and Alaska Native
Place of birth - Native, outside of US (%) - Multirace
Place of birth - Native, outside of US (%) - Other Race
Place of birth - Foreign born (%)
Place of birth - Foreign born (%) - White
Place of birth - Foreign born (%) - Black or African American
Place of birth - Foreign born (%) - Asian
Place of birth - Foreign born (%) - Hispanic or Latino
Place of birth - Foreign born (%) - American Indian and Alaska Native
Place of birth - Foreign born (%) - Multirace
Place of birth - Foreign born (%) - Other Race
Residents speaking English at home (%)
Residents speaking English at home - Born in the United States (%)
Residents speaking English at home - Native, born elsewhere (%)
Residents speaking English at home - Foreign born (%)
Residents speaking Spanish at home (%)
Residents speaking Spanish at home - Born in the United States (%)
Residents speaking Spanish at home - Native, born elsewhere (%)
Residents speaking Spanish at home - Foreign born (%)
Residents speaking other language at home (%)
Residents speaking other language at home - Born in the United States (%)
Residents speaking other language at home - Native, born elsewhere (%)
Residents speaking other language at home - Foreign born (%)
Marital status - Never married (%)
Marital status - Now married (%)
Marital status - Separated (%)
Marital status - Widowed (%)
Marital status - Divorced (%)
Ancestries Reported - Arab (%)
Ancestries Reported - Czech (%)
Ancestries Reported - Danish (%)
Ancestries Reported - Dutch (%)
Ancestries Reported - English (%)
Ancestries Reported - French (%)
Ancestries Reported - French Canadian (%)
Ancestries Reported - German (%)
Ancestries Reported - Greek (%)
Ancestries Reported - Hungarian (%)
Ancestries Reported - Irish (%)
Ancestries Reported - Italian (%)
Ancestries Reported - Lithuanian (%)
Ancestries Reported - Norwegian (%)
Ancestries Reported - Polish (%)
Ancestries Reported - Portuguese (%)
Ancestries Reported - Russian (%)
Ancestries Reported - Scotch-Irish (%)
Ancestries Reported - Scottish (%)
Ancestries Reported - Slovak (%)
Ancestries Reported - Subsaharan African (%)
Ancestries Reported - Swedish (%)
Ancestries Reported - Swiss (%)
Ancestries Reported - Ukrainian (%)
Ancestries Reported - United States (%)
Ancestries Reported - Welsh (%)
Ancestries Reported - West Indian (%)
Ancestries Reported - Other (%)
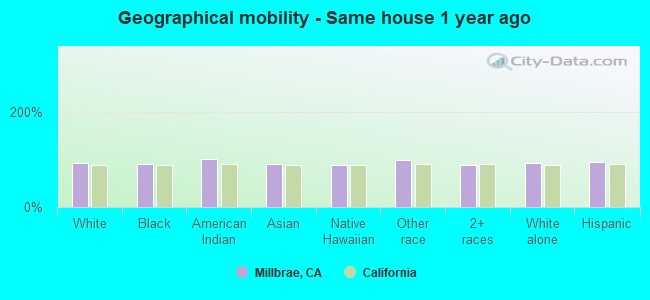
Geographical mobility - Same house 1 year ago (%)
Geographical mobility - Same house 1 year ago (%) - White
Geographical mobility - Same house 1 year ago (%) - Black or African American
Geographical mobility - Same house 1 year ago (%) - Asian
Geographical mobility - Same house 1 year ago (%) - Hispanic or Latino
Geographical mobility - Same house 1 year ago (%) - American Indian and Alaska Native
Geographical mobility - Same house 1 year ago (%) - Multirace
Geographical mobility - Same house 1 year ago (%) - Other Race
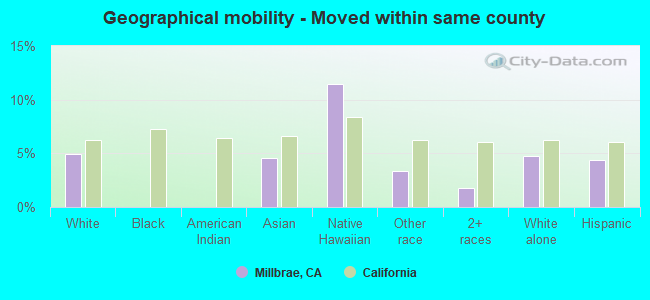
Geographical mobility - Moved within same county (%)
Geographical mobility - Moved within same county (%) - White
Geographical mobility - Moved within same county (%) - Black or African American
Geographical mobility - Moved within same county (%) - Asian
Geographical mobility - Moved within same county (%) - Hispanic or Latino
Geographical mobility - Moved within same county (%) - American Indian and Alaska Native
Geographical mobility - Moved within same county (%) - Multirace
Geographical mobility - Moved within same county (%) - Other Race
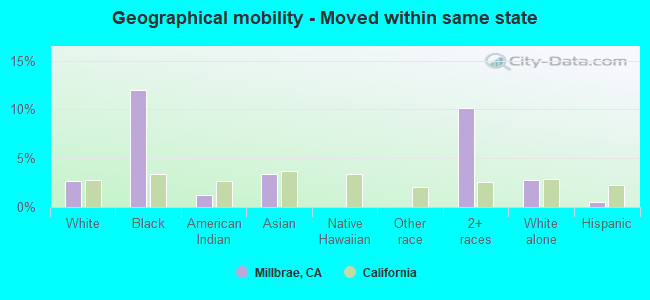
Geographical mobility - Moved from different county within same state (%)
Geographical mobility - Moved from different county within same state (%) - White
Geographical mobility - Moved from different county within same state (%) - Black or African American
Geographical mobility - Moved from different county within same state (%) - Asian
Geographical mobility - Moved from different county within same state (%) - Hispanic or Latino
Geographical mobility - Moved from different county within same state (%) - American Indian and Alaska Native
Geographical mobility - Moved from different county within same state (%) - Multirace
Geographical mobility - Moved from different county within same state (%) - Other Race
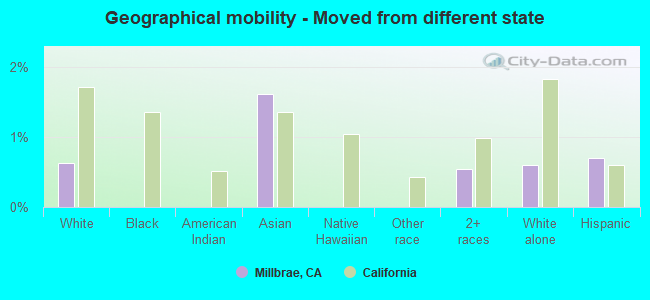
Geographical mobility - Moved from different state (%)
Geographical mobility - Moved from different state (%) - White
Geographical mobility - Moved from different state (%) - Black or African American
Geographical mobility - Moved from different state (%) - Asian
Geographical mobility - Moved from different state (%) - Hispanic or Latino
Geographical mobility - Moved from different state (%) - American Indian and Alaska Native
Geographical mobility - Moved from different state (%) - Multirace
Geographical mobility - Moved from different state (%) - Other Race
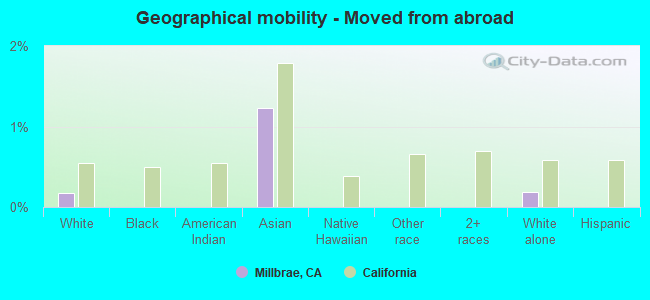
Geographical mobility - Moved from abroad (%)
Geographical mobility - Moved from abroad (%) - White
Geographical mobility - Moved from abroad (%) - Black or African American
Geographical mobility - Moved from abroad (%) - Asian
Geographical mobility - Moved from abroad (%) - Hispanic or Latino
Geographical mobility - Moved from abroad (%) - American Indian and Alaska Native
Geographical mobility - Moved from abroad (%) - Multirace
Geographical mobility - Moved from abroad (%) - Other Race
Place of birth for the foreign-born population - Ireland (%)
Place of birth for the foreign-born population - Denmark (%)
Place of birth for the foreign-born population - Norway (%)
Place of birth for the foreign-born population - Sweden (%)
Place of birth for the foreign-born population - United Kingdom (%)
Place of birth for the foreign-born population - England (%)
Place of birth for the foreign-born population - Scotland (%)
Place of birth for the foreign-born population - Other Northern Europe (%)
Place of birth for the foreign-born population - Austria (%)
Place of birth for the foreign-born population - Belgium (%)
Place of birth for the foreign-born population - France (%)
Place of birth for the foreign-born population - Germany (%)
Place of birth for the foreign-born population - Netherlands (%)
Place of birth for the foreign-born population - Switzerland (%)
Place of birth for the foreign-born population - Other Western Europe (%)
Place of birth for the foreign-born population - Greece (%)
Place of birth for the foreign-born population - Italy (%)
Place of birth for the foreign-born population - Portugal (%)
Place of birth for the foreign-born population - Spain (%)
Place of birth for the foreign-born population - Other Southern Europe (%)
Place of birth for the foreign-born population - Albania (%)
Place of birth for the foreign-born population - Belarus (%)
Place of birth for the foreign-born population - Bosnia and Herzegovina (%)
Place of birth for the foreign-born population - Bulgaria (%)
Place of birth for the foreign-born population - Croatia (%)
Place of birth for the foreign-born population - Czechoslovakia (%)
Place of birth for the foreign-born population - Hungary (%)
Place of birth for the foreign-born population - Latvia (%)
Place of birth for the foreign-born population - Lithuania (%)
Place of birth for the foreign-born population - North Macedonia (Macedonia) (%)
Place of birth for the foreign-born population - Moldova (%)
Place of birth for the foreign-born population - Poland (%)
Place of birth for the foreign-born population - Romania (%)
Place of birth for the foreign-born population - Russia (%)
Place of birth for the foreign-born population - Serbia (%)
Place of birth for the foreign-born population - Ukraine (%)
Place of birth for the foreign-born population - Other Eastern Europe (%)
Place of birth for the foreign-born population - China (%)
Place of birth for the foreign-born population - Hong Kong (%)
Place of birth for the foreign-born population - Taiwan (%)
Place of birth for the foreign-born population - Japan (%)
Place of birth for the foreign-born population - Korea (%)
Place of birth for the foreign-born population - Other Eastern Asia (%)
Place of birth for the foreign-born population - Afghanistan (%)
Place of birth for the foreign-born population - Bangladesh (%)
Place of birth for the foreign-born population - India (%)
Place of birth for the foreign-born population - Iran (%)
Place of birth for the foreign-born population - Kazakhstan (%)
Place of birth for the foreign-born population - Nepal (%)
Place of birth for the foreign-born population - Pakistan (%)
Place of birth for the foreign-born population - Sri Lanka (%)
Place of birth for the foreign-born population - Uzbekistan (%)
Place of birth for the foreign-born population - Other South Central Asia (%)
Place of birth for the foreign-born population - Burma (%)
Place of birth for the foreign-born population - Cambodia (%)
Place of birth for the foreign-born population - Indonesia (%)
Place of birth for the foreign-born population - Laos (%)
Place of birth for the foreign-born population - Malaysia (%)
Place of birth for the foreign-born population - Philippines (%)
Place of birth for the foreign-born population - Singapore (%)
Place of birth for the foreign-born population - Thailand (%)
Place of birth for the foreign-born population - Vietnam (%)
Place of birth for the foreign-born population - Other South Eastern Asia (%)
Place of birth for the foreign-born population - Armenia (%)
Place of birth for the foreign-born population - Iraq (%)
Place of birth for the foreign-born population - Israel (%)
Place of birth for the foreign-born population - Jordan (%)
Place of birth for the foreign-born population - Kuwait (%)
Place of birth for the foreign-born population - Lebanon (%)
Place of birth for the foreign-born population - Saudi Arabia (%)
Place of birth for the foreign-born population - Syria (%)
Place of birth for the foreign-born population - Turkey (%)
Place of birth for the foreign-born population - Yemen (%)
Place of birth for the foreign-born population - Other Western Asia (%)
Place of birth for the foreign-born population - Eritrea (%)
Place of birth for the foreign-born population - Ethiopia (%)
Place of birth for the foreign-born population - Kenya (%)
Place of birth for the foreign-born population - Somalia (%)
Place of birth for the foreign-born population - Uganda (%)
Place of birth for the foreign-born population - Zimbabwe (%)
Place of birth for the foreign-born population - Other Eastern Africa (%)
Place of birth for the foreign-born population - Cameroon (%)
Place of birth for the foreign-born population - Congo (%)
Place of birth for the foreign-born population - Democratic Republic of Congo (Zaire) (%)
Place of birth for the foreign-born population - Other Middle Africa (%)
Place of birth for the foreign-born population - Egypt (%)
Place of birth for the foreign-born population - Morocco (%)
Place of birth for the foreign-born population - Sudan (%)
Place of birth for the foreign-born population - Other Northern Africa (%)
Place of birth for the foreign-born population - South Africa (%)
Place of birth for the foreign-born population - Other Southern Africa (%)
Place of birth for the foreign-born population - Cabo Verde (%)
Place of birth for the foreign-born population - Ghana (%)
Place of birth for the foreign-born population - Liberia (%)
Place of birth for the foreign-born population - Nigeria (%)
Place of birth for the foreign-born population - Senegal (%)
Place of birth for the foreign-born population - Sierra Leone (%)
Place of birth for the foreign-born population - Other Western Africa (%)
Place of birth for the foreign-born population - Australia (%)
Place of birth for the foreign-born population - New Zealand (%)
Place of birth for the foreign-born population - Fiji (%)
Place of birth for the foreign-born population - Micronesia (%)
Place of birth for the foreign-born population - Bahamas (%)
Place of birth for the foreign-born population - Barbados (%)
Place of birth for the foreign-born population - Cuba (%)
Place of birth for the foreign-born population - Dominica (%)
Place of birth for the foreign-born population - Dominican Republic (%)
Place of birth for the foreign-born population - Grenada (%)
Place of birth for the foreign-born population - Haiti (%)
Place of birth for the foreign-born population - Jamaica (%)
Place of birth for the foreign-born population - St. Vincent and the Grenadines (%)
Place of birth for the foreign-born population - Trinidad and Tobago (%)
Place of birth for the foreign-born population - West Indies (%)
Place of birth for the foreign-born population - Other Caribbean (%)
Place of birth for the foreign-born population - Belize (%)
Place of birth for the foreign-born population - Costa Rica (%)
Place of birth for the foreign-born population - El Salvador (%)
Place of birth for the foreign-born population - Guatemala (%)
Place of birth for the foreign-born population - Honduras (%)
Place of birth for the foreign-born population - Mexico (%)
Place of birth for the foreign-born population - Nicaragua (%)
Place of birth for the foreign-born population - Panama (%)
Place of birth for the foreign-born population - Other Central America (%)
Place of birth for the foreign-born population - Argentina (%)
Place of birth for the foreign-born population - Bolivia (%)
Place of birth for the foreign-born population - Brazil (%)
Place of birth for the foreign-born population - Chile (%)
Place of birth for the foreign-born population - Colombia (%)
Place of birth for the foreign-born population - Ecuador (%)
Place of birth for the foreign-born population - Guyana (%)
Place of birth for the foreign-born population - Peru (%)
Place of birth for the foreign-born population - Uruguay (%)
Place of birth for the foreign-born population - Venezuela (%)
Place of birth for the foreign-born population - Other South America (%)
Place of birth for the foreign-born population - Canada (%)
Place of birth for the foreign-born population - Other Northern America (%)
Place of birth for the foreign-born population - Other (%)
Latest news about races in Millbrae, CA collected exclusively by city-data.com from local newspapers, TV, and radio stations
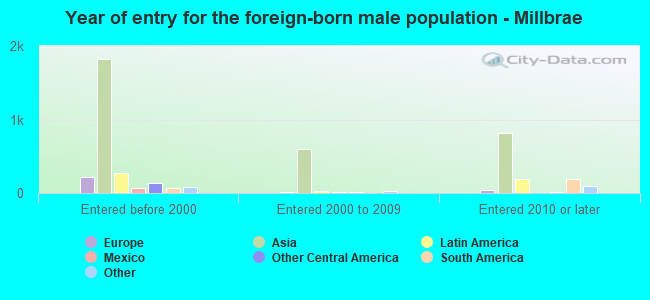
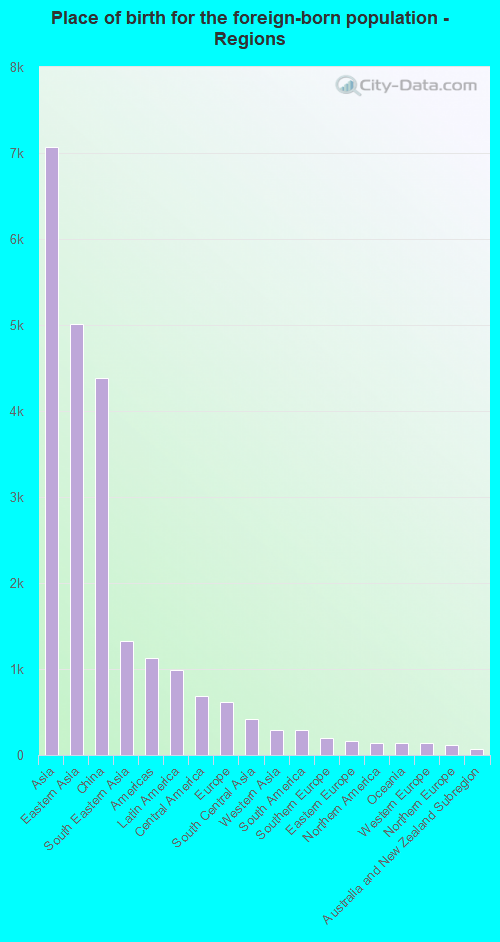
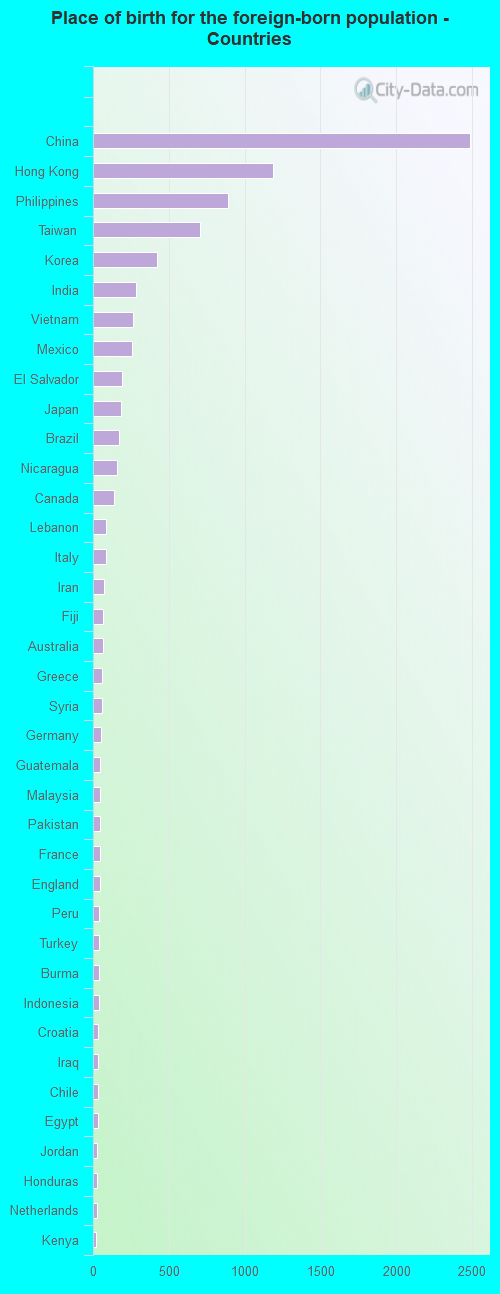
According to 2022 data, the most numerous races in Millbrae, CA are Hispanic (2,572 residents), White alone (7,100 residents), and Asian alone (12,094 residents). 50.6% of Millbrae residents speak English at home. 39.8% of Millbrae, CA residents are foreign-born (30.9% born in Asia, 4.3% born in Latin America), which is 34.7% greater than the foreign-born rate of 26.0% across the entire state of California.
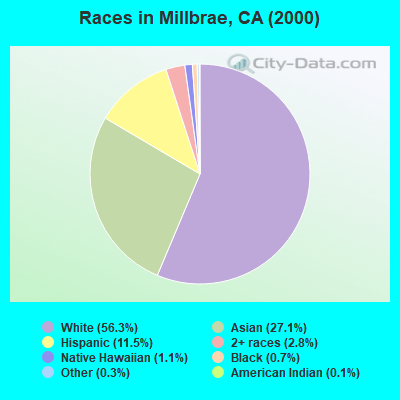
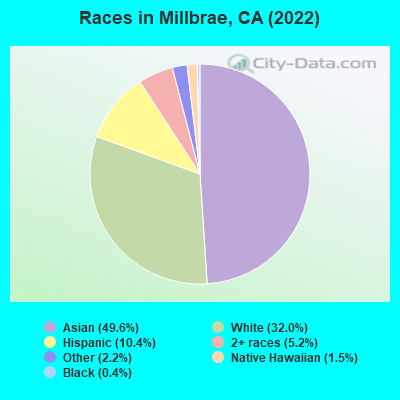
Race distribution in Millbrae
2000 2022
15,816,790 46.7% White alone 10,966,556 32.4% Hispanic 3,648,860 10.8% Asian alone 2,181,926 6.4% Black alone 903,115 2.7% Two or more races 178,984 0.5% American Indian alone 103,736 0.3% Native Hawaiian and Other 71,681 0.2% Other race alone
15,732,184 40.3% Hispanic 13,160,426 33.7% White alone 5,957,867 15.3% Asian alone 2,025,218 5.2% Black alone 1,663,222 4.3% Two or more races 251,618 0.6% Other race alone 135,777 0.3% Native Hawaiian and Other 103,030 0.3% American Indian alone
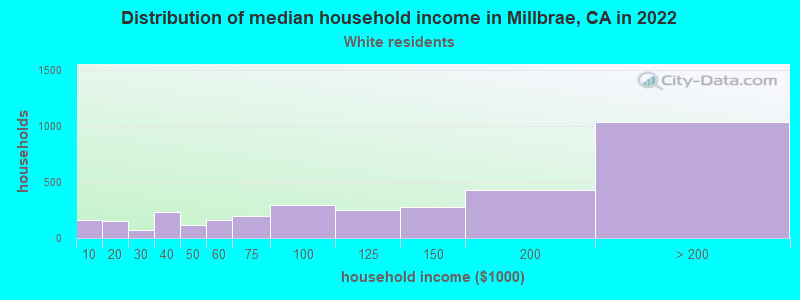
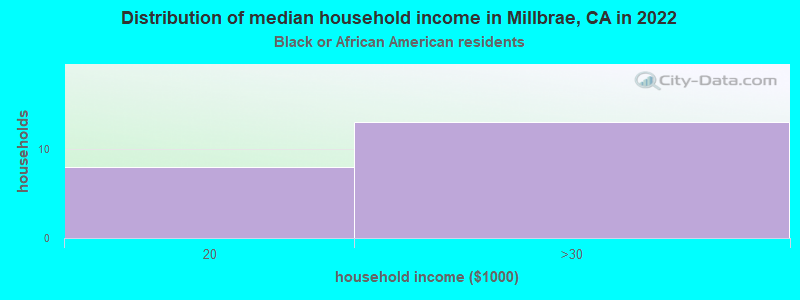
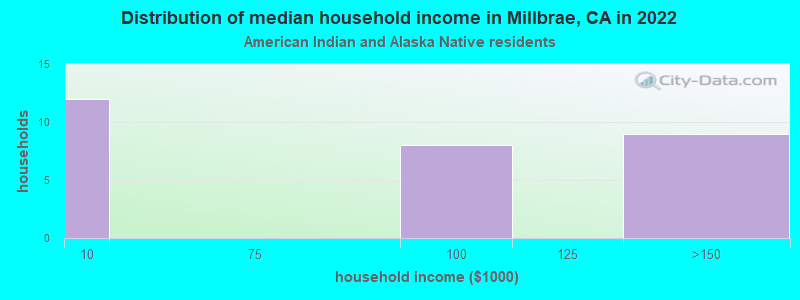
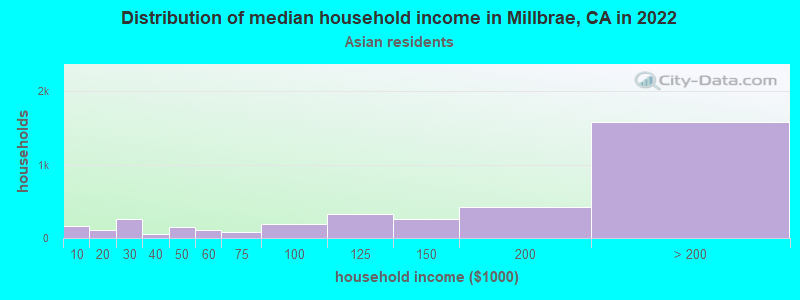
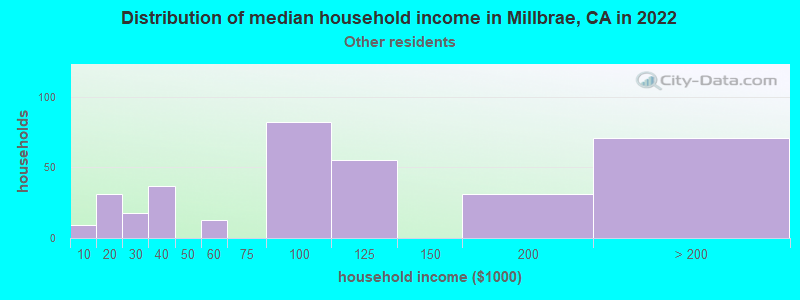
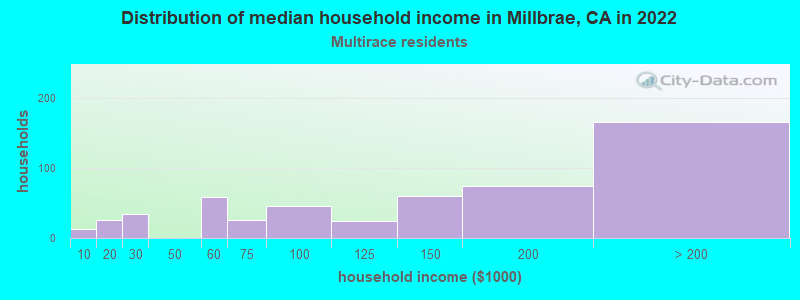
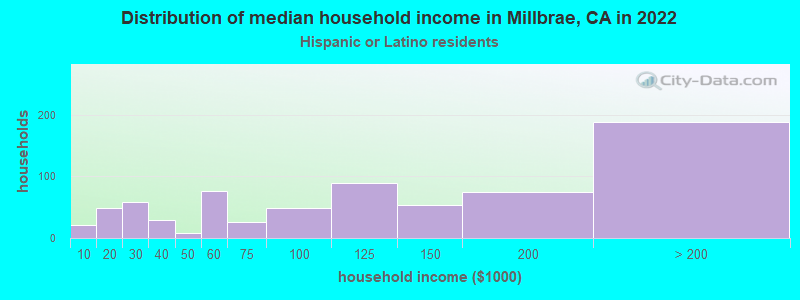
Income and house value in Millbrae Median household income in 2022 $157,562 White non-Hispanic householders$131,263 Black householders$24,194 American Indian and Alaska Native householders$197,403 Asian householders$115,338 Native Hawaiian and other Pacific Islander householders$100,132 Some other race householdersover $200,000 Two or more races householders$111,489 Hispanic or Latino race householdersMedian 2022 house value over $1,000,000 White Non-Hispanic householdersover $1,000,000 Black or African American householdersover $1,000,000 American Indian or Alaska Native householders over $1,000,000 Asian householdersover $1,000,000 Native Hawaiian and other Pacific Islander householdersover $1,000,000 Some other race householdersover $1,000,000 Two or more races householdersover $1,000,000 Hispanic or Latino householders
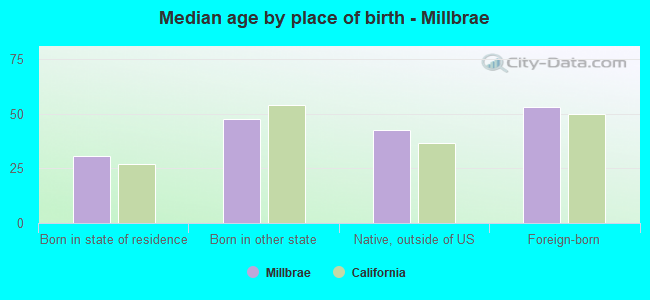
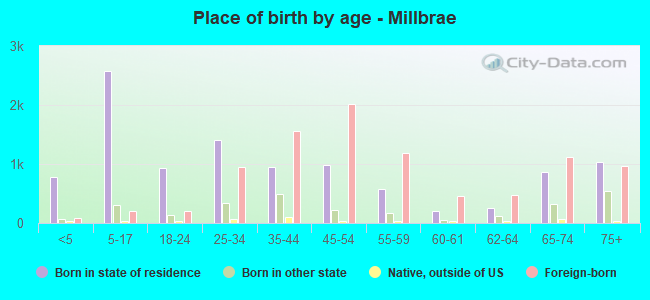
Median age by race in Millbrae
54.4 Median age for White residents51.5 57.8 46.1 Median age for Black or African American residents46.7 54.9 29.3 Median age for American Indian / Alaska Native residents29.9 14.2 42.3 Median age for Asian residents40.0 44.4 67.0 Median age for Native Hawaiian / Pacific Islander residents35.3 Median age for Other race residents40.1 37.1 21.8 Median age for Two or more races residents22.8 20.4 55.6 Median age for White alone residents52.9 58.2 43.8 Median age for Hispanic or Latino residents43.9 39.0
Owner/renter occupied households by race in Millbrae
House owners and renters - White residents 2,208 65.5% Owner occupied1,161 34.5% Renter occupiedHouse owners and renters - Black or African American residents 18 34.1% Owner occupied34 65.9% Renter occupiedHouse owners and renters - American Indian / Alaska Native residents 7 36.2% Owner occupied12 63.8% Renter occupiedHouse owners and renters - Asian residents 2,775 68.4% Owner occupied1,281 31.6% Renter occupiedHouse owners and renters - Other race residents 50 19.8% Owner occupied202 80.2% Renter occupiedHouse owners and renters - Two or more races residents 142 26.9% Owner occupied385 73.1% Renter occupiedHouse owners and renters - White alone residents 2,177 66.9% Owner occupied1,079 33.1% Renter occupiedHouse owners and renters - Hispanic or Latino residents 241 33.4% Owner occupied480 66.6% Renter occupied
Language usage in Millbrae
English speakers - Total 50.6% of residents of Millbrae speak English at home.
6.2% of residents speak Spanish at home 896 67.2% Speak English very well438 32.8% Speak English less than very well43.9% of residents speak other language at home 5,669 59.6% Speak English very well3,849 40.4% Speak English less than very well
English speakers - Born in the United States 88.0% of residents of Millbrae speak English at home.
2.0% of residents speak Spanish at home 51 100.0% Speak English very well10.4% of residents speak other language at home 222 84.4% Speak English very well41 15.6% Speak English less than very well
English speakers - Native, born elsewhere 38.9% of residents of Millbrae speak English at home.
16.8% of residents speak Spanish at home 65 100.0% Speak English very well42.5% of residents speak other language at home 94 57.3% Speak English very well70 42.7% Speak English less than very well
English speakers - Foreign-born 15.8% of residents of Millbrae speak English at home.
7.7% of residents speak Spanish at home 346 51.2% Speak English very well330 48.8% Speak English less than very well79.1% of residents speak other language at home 3,606 52.0% Speak English very well3,329 48.0% Speak English less than very well
White (Caucasian) - Speak only English Native:
96.3% (5,842)Foreign-born:
46.0% (505)
White (Caucasian) - Speak another language Native:
7.3% (444)Foreign-born:
63.6% (698)
Black or African American - Speak another language Native:
9.3% (12)Foreign-born:
84.9% (20)
American Indian / Alaska Native - Speak another language Native:
65.6% (33)Foreign-born:
100.0% (65)
Asian - Speak only English Native:
53.5% (2,540)Foreign-born:
12.8% (876)
Asian - Speak another language Native:
45.5% (2,161)Foreign-born:
87.1% (5,948)
Other race - Speak only English Native:
46.1% (199)Foreign-born:
11.7% (61)
Other race - Speak another language Native:
58.3% (252)Foreign-born:
90.7% (468)
Two or more races - Speak only English Native:
71.5% (1,409)Foreign-born:
26.8% (192)
Two or more races - Speak another language Native:
17.5% (345)Foreign-born:
62.7% (449)
White alone - Speak only English Native:
92.6% (5,294)Foreign-born:
36.5% (461)
White alone - Speak another language Native:
7.5% (428)Foreign-born:
63.5% (802)
Hispanic or Latino - Speak only English Native:
76.9% (1,279)Foreign-born:
21.5% (164)
Hispanic or Latino - Speak another language Native:
30.5% (506)Foreign-born:
85.1% (650)
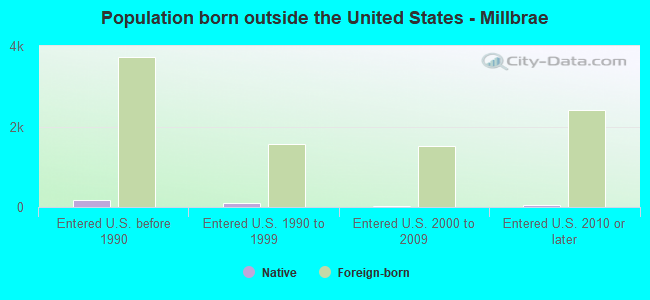
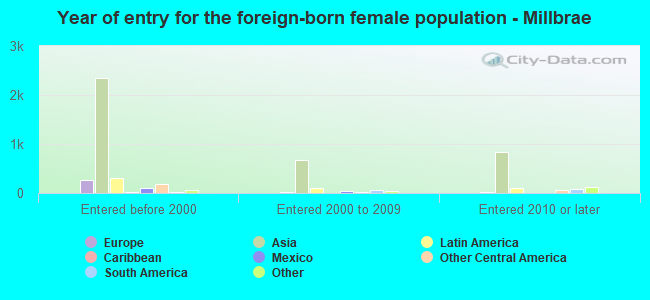
Foreign-born residents in Millbrae 9,021 residents are foreign born (30.9% Asia , 4.3% Latin America ).
This city:
39.8%California:
100.0%
Marital status for residents in Millbrae Marital status - White (Caucasian) population 15 years and over
Males 28.6% Never married52.8% Now married1.1% Separated4.7% Widowed12.8% DivorcedFemales 25.7% Never married46.1% Now married2.4% Separated14.4% Widowed11.4% DivorcedWomen who gave birth in the past 12 months Now married:
100.0% (37)Unmarried:
0.0% (0)
Women who did not give birth in the past 12 months Now married:
40.6% (479)Unmarried:
59.4% (699)
Marital status - Black or African American population 15 years and over
Males 56.1% Never married43.9% Now married0.0% Separated0.0% Widowed0.0% DivorcedFemales 30.6% Never married53.2% Now married0.0% Separated16.1% Widowed0.0% DivorcedWomen who did not give birth in the past 12 months Now married:
0.0% (0)Unmarried:
100.0% (18)
Marital status - American Indian / Alaska Native population 15 years and over
Males 0.0% Never married100.0% Now married0.0% Separated0.0% Widowed0.0% DivorcedFemales 56.3% Never married43.8% Now married0.0% Separated0.0% Widowed0.0% DivorcedWomen who did not give birth in the past 12 months Now married:
46.7% (20)Unmarried:
53.3% (23)
Marital status - Asian population 15 years and over
Males 31.5% Never married63.4% Now married0.7% Separated0.9% Widowed3.4% DivorcedFemales 20.9% Never married61.8% Now married2.2% Separated7.9% Widowed7.2% DivorcedWomen who gave birth in the past 12 months Now married:
100.0% (81)Unmarried:
0.0% (0)
Women who did not give birth in the past 12 months Now married:
61.3% (1,699)Unmarried:
38.7% (1,072)
Marital status - Native Hawaiian / Pacific Islander population 15 years and over
Males 0.0% Never married100.0% Now married0.0% Separated0.0% Widowed0.0% DivorcedFemales 80.0% Never married20.0% Now married0.0% Separated0.0% Widowed0.0% DivorcedWomen who gave birth in the past 12 months Now married:
96.2% (1)Unmarried:
0.0% (0)
Marital status - Other race population 15 years and over
Males 39.2% Never married52.1% Now married0.0% Separated0.8% Widowed7.9% DivorcedFemales 33.5% Never married55.6% Now married0.0% Separated5.4% Widowed5.4% DivorcedWomen who gave birth in the past 12 months Now married:
100.0% (36)Unmarried:
0.0% (0)
Women who did not give birth in the past 12 months Now married:
35.8% (91)Unmarried:
64.2% (164)
Marital status - Two or more races population 15 years and over
Males 58.6% Never married41.4% Now married0.0% Separated0.0% Widowed0.0% DivorcedFemales 31.7% Never married67.0% Now married0.0% Separated0.0% Widowed1.3% DivorcedWomen who gave birth in the past 12 months Now married:
100.0% (24)Unmarried:
0.0% (0)
Women who did not give birth in the past 12 months Now married:
59.2% (271)Unmarried:
40.8% (187)
Marital status - White alone, not Hispanic / Latino population 15 years and over
Males 26.8% Never married54.2% Now married0.9% Separated4.8% Widowed13.4% DivorcedFemales 25.0% Never married46.1% Now married2.1% Separated15.3% Widowed11.5% DivorcedWomen who gave birth in the past 12 months Now married:
100.0% (45)Unmarried:
0.0% (0)
Women who did not give birth in the past 12 months Now married:
39.2% (442)Unmarried:
60.8% (687)
Marital status - Hispanic or Latino population 15 years and over
Males 33.9% Never married52.3% Now married1.5% Separated3.0% Widowed9.3% DivorcedFemales 32.9% Never married49.1% Now married2.6% Separated7.2% Widowed8.2% DivorcedWomen who gave birth in the past 12 months Now married:
100.0% (30)Unmarried:
0.0% (0)
Women who did not give birth in the past 12 months Now married:
41.9% (236)Unmarried:
58.1% (327)
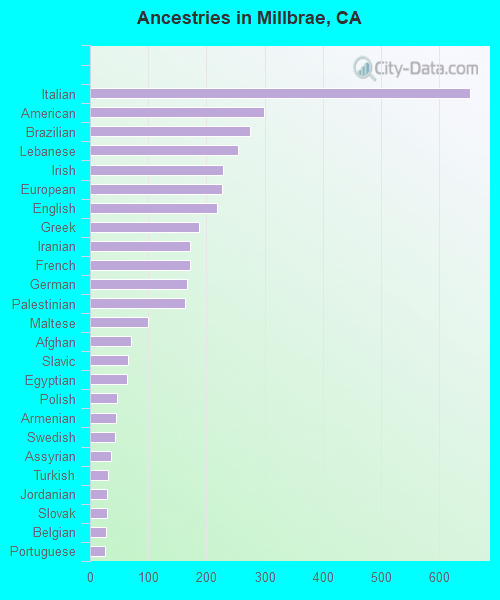
Ancestries in Millbrae
660 4.8% Italian336 2.4% American260 1.9% Irish226 1.6% German207 1.5% English147 1.1% Greek128 0.9% European99 0.7% Armenian90 0.6% Palestinian86 0.6% Brazilian85 0.6% French84 0.6% Egyptian70 0.5% Eastern European69 0.5% Maltese63 0.5% Scottish61 0.4% Iranian55 0.4% Polish51 0.4% Czech47 0.3% Lebanese46 0.3% Russian44 0.3% Danish41 0.3% British33 0.2% Croatian31 0.2% Turkish27 0.2% Dutch27 0.2% Australian22 0.2% Norwegian22 0.2% Ukrainian21 0.2% Yugoslavian18 0.1% Scotch-Irish18 0.1% Ethiopian17 0.1% Canadian17 0.1% Afghan16 0.1% Slovene14 0.1% Assyrian14 0.1% French Canadian14 0.1% Portuguese14 0.1% Slovak11 0.08% Celtic11 0.08% Swedish11 0.08% Hungarian10 0.07% Arab7 0.05% Basque7 0.05% Icelander6 0.04% Finnish4 0.03% Austrian3 0.02% Swiss
Geographical mobility in Millbrae Same house 1 year ago 6,689 91.9% White (Caucasian)137 90.7% Black or African American115 100.0% American Indian / Alaska Native10,829 89.6% Asian7 87.5% Native Hawaiian / Pacific Islander1,001 98.0% Other race2,770 87.1% Two or more races6,677 92.2% White alone, not Hispanic / Latino2,453 95.0% Hispanic or LatinoMoved within same county 362 5.0% White / Caucasian557 4.6% Asian1 11.4% Native Hawaiian / Pacific Islander35 3.4% Other race57 1.8% Two or more races345 4.8% White alone, not Hispanic / Latino113 4.4% Hispanic or LatinoMoved within same state 194 2.7% White / Caucasian18 12.0% Black or African American1 1.2% American Indian / Alaska Native406 3.4% Asian322 10.1% Two or more races201 2.8% White alone, not Hispanic / Latino13 0.5% Hispanic or LatinoMoved from different state 46 0.6% White / Caucasian195 1.6% Asian17 0.5% Two or more races44 0.6% White alone, not Hispanic / Latino18 0.7% Hispanic or LatinoMoved from abroad 13 0.2% White148 1.2% Asian14 0.2% White alone, not Hispanic / Latino
Children Nativity (place of birth) in Millbrae
Children under 6 years - Living with two parents Both parents native 441 100.0% NativeBoth parents foreign-born 334 86.7% Native51 13.3% Foreign-bornOne native, one foreign-born parent 370 100.0% NativeChildren under 6 years - Living with one parent Native parent 32 100.0% NativeForeign-born parent 28 34.5% Native53 65.5% Foreign-bornChildren 6 to 17 years - Living with two parents Both parents native 694 100.0% Native0 0.0% Foreign-bornBoth parents foreign-born 945 88.3% Native125 11.7% Foreign-bornOne native, one foreign-born parent 490 98.5% Native7 1.5% Foreign-bornChildren 6 to 17 years - Living with one parent Native parent 170 100.0% NativeForeign-born parent 275 57.0% Native207 43.0% Foreign-born
Grandparents responsible for own grandchildren in Millbrae
Grandparents (30 to 59 years) White / Caucasian 6 37.9% Responsible for grandchildren10 62.1% Not responsible for grandchildrenAsian 33 100.0% Not responsible for grandchildrenWhite alone, not Hispanic / Latino 12 63.6% Responsible for grandchildren7 36.4% Not responsible for grandchildrenHispanic or Latino 17 100.0% Not responsible for grandchildrenGrandparents (60 years and over) White / Caucasian 10 14.9% Responsible for grandchildren56 85.1% Not responsible for grandchildrenAsian 21 7.1% Responsible for grandchildren272 92.9% Not responsible for grandchildrenWhite alone, not Hispanic / Latino 6 13.1% Responsible for grandchildren40 86.9% Not responsible for grandchildrenHispanic or Latino 12 19.4% Responsible for grandchildren49 80.6% Not responsible for grandchildren