Races in Nanakuli, Hawaii (HI) Detailed Stats
Data:
Races - White alone (%)
Races - White alone (% change since 2000)
Races - Black alone (%)
Races - Black alone (% change since 2000)
Races - American Indian alone (%)
Races - American Indian alone (% change since 2000)
Races - Asian alone (%)
Races - Asian alone (% change since 2000)
Races - Hispanic (%)
Races - Hispanic (% change since 2000)
Races - Native Hawaiian and Other Pacific Islander alone (%)
Races - Native Hawaiian and Other Pacific Islander alone (% change since 2000)
Races - Two or more races(%)
Races - Two or more races(% change since 2000)
Races - Other race alone (%)
Races - Other race alone (% change since 2000)
Racial diversity
Place of birth - Born in state of residence (%)
Place of birth - Born in state of residence (%) - White
Place of birth - Born in state of residence (%) - Black or African American
Place of birth - Born in state of residence (%) - Asian
Place of birth - Born in state of residence (%) - Hispanic or Latino
Place of birth - Born in state of residence (%) - American Indian and Alaska Native
Place of birth - Born in state of residence (%) - Multirace
Place of birth - Born in state of residence (%) - Other Race
Place of birth - Born in other state (%)
Place of birth - Born in other state (%) - White
Place of birth - Born in other state (%) - Black or African American
Place of birth - Born in other state (%) - Asian
Place of birth - Born in other state (%) - Hispanic or Latino
Place of birth - Born in other state (%) - American Indian and Alaska Native
Place of birth - Born in other state (%) - Multirace
Place of birth - Born in other state (%) - Other Race
Place of birth - Native, outside of US (%)
Place of birth - Native, outside of US (%) - White
Place of birth - Native, outside of US (%) - Black or African American
Place of birth - Native, outside of US (%) - Asian
Place of birth - Native, outside of US (%) - Hispanic or Latino
Place of birth - Native, outside of US (%) - American Indian and Alaska Native
Place of birth - Native, outside of US (%) - Multirace
Place of birth - Native, outside of US (%) - Other Race
Place of birth - Foreign born (%)
Place of birth - Foreign born (%) - White
Place of birth - Foreign born (%) - Black or African American
Place of birth - Foreign born (%) - Asian
Place of birth - Foreign born (%) - Hispanic or Latino
Place of birth - Foreign born (%) - American Indian and Alaska Native
Place of birth - Foreign born (%) - Multirace
Place of birth - Foreign born (%) - Other Race
Residents speaking English at home (%)
Residents speaking English at home - Born in the United States (%)
Residents speaking English at home - Native, born elsewhere (%)
Residents speaking English at home - Foreign born (%)
Residents speaking Spanish at home (%)
Residents speaking Spanish at home - Born in the United States (%)
Residents speaking Spanish at home - Native, born elsewhere (%)
Residents speaking Spanish at home - Foreign born (%)
Residents speaking other language at home (%)
Residents speaking other language at home - Born in the United States (%)
Residents speaking other language at home - Native, born elsewhere (%)
Residents speaking other language at home - Foreign born (%)
Marital status - Never married (%)
Marital status - Now married (%)
Marital status - Separated (%)
Marital status - Widowed (%)
Marital status - Divorced (%)
Ancestries Reported - Arab (%)
Ancestries Reported - Czech (%)
Ancestries Reported - Danish (%)
Ancestries Reported - Dutch (%)
Ancestries Reported - English (%)
Ancestries Reported - French (%)
Ancestries Reported - French Canadian (%)
Ancestries Reported - German (%)
Ancestries Reported - Greek (%)
Ancestries Reported - Hungarian (%)
Ancestries Reported - Irish (%)
Ancestries Reported - Italian (%)
Ancestries Reported - Lithuanian (%)
Ancestries Reported - Norwegian (%)
Ancestries Reported - Polish (%)
Ancestries Reported - Portuguese (%)
Ancestries Reported - Russian (%)
Ancestries Reported - Scotch-Irish (%)
Ancestries Reported - Scottish (%)
Ancestries Reported - Slovak (%)
Ancestries Reported - Subsaharan African (%)
Ancestries Reported - Swedish (%)
Ancestries Reported - Swiss (%)
Ancestries Reported - Ukrainian (%)
Ancestries Reported - United States (%)
Ancestries Reported - Welsh (%)
Ancestries Reported - West Indian (%)
Ancestries Reported - Other (%)
Geographical mobility - Same house 1 year ago (%)
Geographical mobility - Same house 1 year ago (%) - White
Geographical mobility - Same house 1 year ago (%) - Black or African American
Geographical mobility - Same house 1 year ago (%) - Asian
Geographical mobility - Same house 1 year ago (%) - Hispanic or Latino
Geographical mobility - Same house 1 year ago (%) - American Indian and Alaska Native
Geographical mobility - Same house 1 year ago (%) - Multirace
Geographical mobility - Same house 1 year ago (%) - Other Race
Geographical mobility - Moved within same county (%)
Geographical mobility - Moved within same county (%) - White
Geographical mobility - Moved within same county (%) - Black or African American
Geographical mobility - Moved within same county (%) - Asian
Geographical mobility - Moved within same county (%) - Hispanic or Latino
Geographical mobility - Moved within same county (%) - American Indian and Alaska Native
Geographical mobility - Moved within same county (%) - Multirace
Geographical mobility - Moved within same county (%) - Other Race
Geographical mobility - Moved from different county within same state (%)
Geographical mobility - Moved from different county within same state (%) - White
Geographical mobility - Moved from different county within same state (%) - Black or African American
Geographical mobility - Moved from different county within same state (%) - Asian
Geographical mobility - Moved from different county within same state (%) - Hispanic or Latino
Geographical mobility - Moved from different county within same state (%) - American Indian and Alaska Native
Geographical mobility - Moved from different county within same state (%) - Multirace
Geographical mobility - Moved from different county within same state (%) - Other Race
Geographical mobility - Moved from different state (%)
Geographical mobility - Moved from different state (%) - White
Geographical mobility - Moved from different state (%) - Black or African American
Geographical mobility - Moved from different state (%) - Asian
Geographical mobility - Moved from different state (%) - Hispanic or Latino
Geographical mobility - Moved from different state (%) - American Indian and Alaska Native
Geographical mobility - Moved from different state (%) - Multirace
Geographical mobility - Moved from different state (%) - Other Race
Geographical mobility - Moved from abroad (%)
Geographical mobility - Moved from abroad (%) - White
Geographical mobility - Moved from abroad (%) - Black or African American
Geographical mobility - Moved from abroad (%) - Asian
Geographical mobility - Moved from abroad (%) - Hispanic or Latino
Geographical mobility - Moved from abroad (%) - American Indian and Alaska Native
Geographical mobility - Moved from abroad (%) - Multirace
Geographical mobility - Moved from abroad (%) - Other Race
Place of birth for the foreign-born population - Ireland (%)
Place of birth for the foreign-born population - Denmark (%)
Place of birth for the foreign-born population - Norway (%)
Place of birth for the foreign-born population - Sweden (%)
Place of birth for the foreign-born population - United Kingdom (%)
Place of birth for the foreign-born population - England (%)
Place of birth for the foreign-born population - Scotland (%)
Place of birth for the foreign-born population - Other Northern Europe (%)
Place of birth for the foreign-born population - Austria (%)
Place of birth for the foreign-born population - Belgium (%)
Place of birth for the foreign-born population - France (%)
Place of birth for the foreign-born population - Germany (%)
Place of birth for the foreign-born population - Netherlands (%)
Place of birth for the foreign-born population - Switzerland (%)
Place of birth for the foreign-born population - Other Western Europe (%)
Place of birth for the foreign-born population - Greece (%)
Place of birth for the foreign-born population - Italy (%)
Place of birth for the foreign-born population - Portugal (%)
Place of birth for the foreign-born population - Spain (%)
Place of birth for the foreign-born population - Other Southern Europe (%)
Place of birth for the foreign-born population - Albania (%)
Place of birth for the foreign-born population - Belarus (%)
Place of birth for the foreign-born population - Bosnia and Herzegovina (%)
Place of birth for the foreign-born population - Bulgaria (%)
Place of birth for the foreign-born population - Croatia (%)
Place of birth for the foreign-born population - Czechoslovakia (%)
Place of birth for the foreign-born population - Hungary (%)
Place of birth for the foreign-born population - Latvia (%)
Place of birth for the foreign-born population - Lithuania (%)
Place of birth for the foreign-born population - North Macedonia (Macedonia) (%)
Place of birth for the foreign-born population - Moldova (%)
Place of birth for the foreign-born population - Poland (%)
Place of birth for the foreign-born population - Romania (%)
Place of birth for the foreign-born population - Russia (%)
Place of birth for the foreign-born population - Serbia (%)
Place of birth for the foreign-born population - Ukraine (%)
Place of birth for the foreign-born population - Other Eastern Europe (%)
Place of birth for the foreign-born population - China (%)
Place of birth for the foreign-born population - Hong Kong (%)
Place of birth for the foreign-born population - Taiwan (%)
Place of birth for the foreign-born population - Japan (%)
Place of birth for the foreign-born population - Korea (%)
Place of birth for the foreign-born population - Other Eastern Asia (%)
Place of birth for the foreign-born population - Afghanistan (%)
Place of birth for the foreign-born population - Bangladesh (%)
Place of birth for the foreign-born population - India (%)
Place of birth for the foreign-born population - Iran (%)
Place of birth for the foreign-born population - Kazakhstan (%)
Place of birth for the foreign-born population - Nepal (%)
Place of birth for the foreign-born population - Pakistan (%)
Place of birth for the foreign-born population - Sri Lanka (%)
Place of birth for the foreign-born population - Uzbekistan (%)
Place of birth for the foreign-born population - Other South Central Asia (%)
Place of birth for the foreign-born population - Burma (%)
Place of birth for the foreign-born population - Cambodia (%)
Place of birth for the foreign-born population - Indonesia (%)
Place of birth for the foreign-born population - Laos (%)
Place of birth for the foreign-born population - Malaysia (%)
Place of birth for the foreign-born population - Philippines (%)
Place of birth for the foreign-born population - Singapore (%)
Place of birth for the foreign-born population - Thailand (%)
Place of birth for the foreign-born population - Vietnam (%)
Place of birth for the foreign-born population - Other South Eastern Asia (%)
Place of birth for the foreign-born population - Armenia (%)
Place of birth for the foreign-born population - Iraq (%)
Place of birth for the foreign-born population - Israel (%)
Place of birth for the foreign-born population - Jordan (%)
Place of birth for the foreign-born population - Kuwait (%)
Place of birth for the foreign-born population - Lebanon (%)
Place of birth for the foreign-born population - Saudi Arabia (%)
Place of birth for the foreign-born population - Syria (%)
Place of birth for the foreign-born population - Turkey (%)
Place of birth for the foreign-born population - Yemen (%)
Place of birth for the foreign-born population - Other Western Asia (%)
Place of birth for the foreign-born population - Eritrea (%)
Place of birth for the foreign-born population - Ethiopia (%)
Place of birth for the foreign-born population - Kenya (%)
Place of birth for the foreign-born population - Somalia (%)
Place of birth for the foreign-born population - Uganda (%)
Place of birth for the foreign-born population - Zimbabwe (%)
Place of birth for the foreign-born population - Other Eastern Africa (%)
Place of birth for the foreign-born population - Cameroon (%)
Place of birth for the foreign-born population - Congo (%)
Place of birth for the foreign-born population - Democratic Republic of Congo (Zaire) (%)
Place of birth for the foreign-born population - Other Middle Africa (%)
Place of birth for the foreign-born population - Egypt (%)
Place of birth for the foreign-born population - Morocco (%)
Place of birth for the foreign-born population - Sudan (%)
Place of birth for the foreign-born population - Other Northern Africa (%)
Place of birth for the foreign-born population - South Africa (%)
Place of birth for the foreign-born population - Other Southern Africa (%)
Place of birth for the foreign-born population - Cabo Verde (%)
Place of birth for the foreign-born population - Ghana (%)
Place of birth for the foreign-born population - Liberia (%)
Place of birth for the foreign-born population - Nigeria (%)
Place of birth for the foreign-born population - Senegal (%)
Place of birth for the foreign-born population - Sierra Leone (%)
Place of birth for the foreign-born population - Other Western Africa (%)
Place of birth for the foreign-born population - Australia (%)
Place of birth for the foreign-born population - New Zealand (%)
Place of birth for the foreign-born population - Fiji (%)
Place of birth for the foreign-born population - Micronesia (%)
Place of birth for the foreign-born population - Bahamas (%)
Place of birth for the foreign-born population - Barbados (%)
Place of birth for the foreign-born population - Cuba (%)
Place of birth for the foreign-born population - Dominica (%)
Place of birth for the foreign-born population - Dominican Republic (%)
Place of birth for the foreign-born population - Grenada (%)
Place of birth for the foreign-born population - Haiti (%)
Place of birth for the foreign-born population - Jamaica (%)
Place of birth for the foreign-born population - St. Vincent and the Grenadines (%)
Place of birth for the foreign-born population - Trinidad and Tobago (%)
Place of birth for the foreign-born population - West Indies (%)
Place of birth for the foreign-born population - Other Caribbean (%)
Place of birth for the foreign-born population - Belize (%)
Place of birth for the foreign-born population - Costa Rica (%)
Place of birth for the foreign-born population - El Salvador (%)
Place of birth for the foreign-born population - Guatemala (%)
Place of birth for the foreign-born population - Honduras (%)
Place of birth for the foreign-born population - Mexico (%)
Place of birth for the foreign-born population - Nicaragua (%)
Place of birth for the foreign-born population - Panama (%)
Place of birth for the foreign-born population - Other Central America (%)
Place of birth for the foreign-born population - Argentina (%)
Place of birth for the foreign-born population - Bolivia (%)
Place of birth for the foreign-born population - Brazil (%)
Place of birth for the foreign-born population - Chile (%)
Place of birth for the foreign-born population - Colombia (%)
Place of birth for the foreign-born population - Ecuador (%)
Place of birth for the foreign-born population - Guyana (%)
Place of birth for the foreign-born population - Peru (%)
Place of birth for the foreign-born population - Uruguay (%)
Place of birth for the foreign-born population - Venezuela (%)
Place of birth for the foreign-born population - Other South America (%)
Place of birth for the foreign-born population - Canada (%)
Place of birth for the foreign-born population - Other Northern America (%)
Place of birth for the foreign-born population - Other (%)
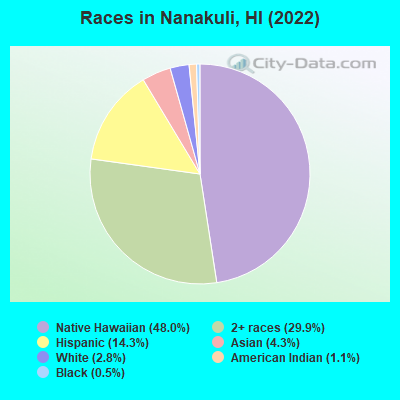
According to 2022 data, the most numerous races in Nanakuli, HI are Asian alone (525 residents), Two or more races (3,647 residents), and White alone (344 residents). 83.0% of Nanakuli residents speak English at home. 8.0% of Nanakuli, HI residents are foreign-born (5.7% born in Oceania, 1.7% born in Asia), which is 126.0% less than the foreign-born rate of 18.0% across the entire state of Hawaii.
Race distribution in Nanakuli
2000 2022
494,149 40.8% Asian alone 277,091 22.9% White alone 218,700 18.1% Two or more races 108,441 9.0% Native Hawaiian and Other 87,699 7.2% Hispanic 20,829 1.7% Black alone 2,089 0.2% Other race alone 2,539 0.2% American Indian alone
498,125 34.6% Asian alone 318,574 22.1% Two or more races 297,937 20.7% White alone 160,103 11.1% Hispanic 134,567 9.3% Native Hawaiian and Other 23,682 1.6% Black alone 5,378 0.4% Other race alone 1,830 0.1% American Indian alone
Income and house value in Nanakuli Median household income in 2022 $75,140 Asian householders$62,427 Native Hawaiian and other Pacific Islander householders$93,614 Two or more races householders$75,714 Hispanic or Latino race householdersMedian 2022 house value $472,523 White Non-Hispanic householders $565,979 Asian householders$454,816 Native Hawaiian and other Pacific Islander householders$538,106 Some other race householders$490,886 Two or more races householders$538,106 Hispanic or Latino householders
Median age by race in Nanakuli
56.3 Median age for White residents49.6 57.4 64.7 Median age for Black or African American residents69.8 33.8 24.1 Median age for American Indian / Alaska Native residents10.4 22.1 55.8 Median age for Asian residents60.0 50.2 32.8 Median age for Native Hawaiian / Pacific Islander residents32.8 32.8 54.4 Median age for Other race residents51.3 -593,471,809.5 29.9 Median age for Two or more races residents29.9 30.6 57.4 Median age for White alone residents56.7 58.0 21.2 Median age for Hispanic or Latino residents22.0 20.0
Owner/renter occupied households by race in Nanakuli
House owners and renters - White residents 72 45.3% Owner occupied86 54.7% Renter occupiedHouse owners and renters - Black or African American residents 35 52.7% Owner occupied31 47.3% Renter occupiedHouse owners and renters - American Indian / Alaska Native residents 5 23.6% Owner occupied16 76.4% Renter occupiedHouse owners and renters - Asian residents 200 92.0% Owner occupied17 8.0% Renter occupiedHouse owners and renters - Native Hawaiian / Pacific Islander residents 966 61.5% Owner occupied605 38.5% Renter occupiedHouse owners and renters - Other race residents 24 71.2% Owner occupied10 28.8% Renter occupiedHouse owners and renters - Two or more races residents 732 70.5% Owner occupied306 29.5% Renter occupiedHouse owners and renters - White alone residents 67 43.4% Owner occupied87 56.6% Renter occupiedHouse owners and renters - Hispanic or Latino residents 167 53.1% Owner occupied147 46.9% Renter occupied
Language usage in Nanakuli
English speakers - Total 83.0% of residents of Nanakuli speak English at home.
1.0% of residents speak Spanish at home 96 82.1% Speak English very well21 17.9% Speak English less than very well16.5% of residents speak other language at home 1,547 82.5% Speak English very well328 17.5% Speak English less than very well
English speakers - Born in the United States 92.8% of residents of Nanakuli speak English at home.
6.9% of residents speak other language at home 55 98.2% Speak English very well1 1.8% Speak English less than very well
English speakers - Native, born elsewhere 52.3% of residents of Nanakuli speak English at home.
12.6% of residents speak Spanish at home 25 100.0% Speak English very well32.7% of residents speak other language at home 65 100.0% Speak English very well
English speakers - Foreign-born 19.5% of residents of Nanakuli speak English at home.
2.8% of residents speak Spanish at home 25 100.0% Speak English less than very well77.9% of residents speak other language at home 501 71.0% Speak English very well205 29.0% Speak English less than very well
White (Caucasian) - Speak only English Native:
99.6% (352)Foreign-born:
14.4% (2)
White (Caucasian) - Speak another language Native:
1.5% (5)Foreign-born:
79.9% (12)
American Indian / Alaska Native - Speak only English Native:
93.4% (162)Foreign-born:
81.2% (4)
Asian - Speak only English Native:
88.5% (426)Foreign-born:
5.9% (10)
Asian - Speak another language Native:
11.6% (56)Foreign-born:
94.1% (164)
Native Hawaiian / Pacific Islander - Speak only English Native:
87.6% (4,550)Foreign-born:
20.8% (144)
Native Hawaiian / Pacific Islander - Speak another language Native:
13.1% (681)Foreign-born:
78.7% (544)
Other race - Speak another language Native:
9.0% (7)Foreign-born:
98.0% (21)
Two or more races - Speak only English Native:
88.9% (3,744)Foreign-born:
45.3% (17)
Two or more races - Speak another language Native:
11.2% (471)Foreign-born:
55.1% (21)
White alone - Speak only English Native:
99.9% (325)Foreign-born:
13.4% (2)
White alone - Speak another language Native:
0.5% (2)Foreign-born:
86.1% (14)
Hispanic or Latino - Speak only English Native:
89.8% (1,337)Foreign-born:
4.8% (3)
Hispanic or Latino - Speak another language Native:
10.5% (157)Foreign-born:
91.9% (67)
Foreign-born residents in Nanakuli 971 residents are foreign born (5.7% Oceania , 1.7% Asia ).
This city:
8.0%Hawaii:
18.0%
Marital status for residents in Nanakuli Marital status - White (Caucasian) population 15 years and over
Males 43.0% Never married52.8% Now married0.0% Separated1.6% Widowed2.6% DivorcedFemales 16.3% Never married55.6% Now married0.0% Separated16.9% Widowed11.2% DivorcedWomen who did not give birth in the past 12 months Now married:
50.0% (36)Unmarried:
50.0% (36)
Marital status - Black or African American population 15 years and over
Males 0.0% Never married96.9% Now married0.0% Separated0.0% Widowed3.1% DivorcedFemales 7.0% Never married93.0% Now married0.0% Separated0.0% Widowed0.0% DivorcedWomen who did not give birth in the past 12 months Now married:
100.0% (27)Unmarried:
0.0% (0)
Marital status - American Indian / Alaska Native population 15 years and over
Males 0.0% Never married80.8% Now married19.2% Separated0.0% Widowed0.0% DivorcedFemales 76.3% Never married23.7% Now married0.0% Separated0.0% Widowed0.0% DivorcedWomen who did not give birth in the past 12 months Now married:
21.3% (24)Unmarried:
78.7% (87)
Marital status - Asian population 15 years and over
Males 47.8% Never married40.4% Now married0.0% Separated9.4% Widowed2.4% DivorcedFemales 24.5% Never married63.2% Now married0.0% Separated7.1% Widowed5.1% DivorcedWomen who gave birth in the past 12 months Now married:
50.0% (6)Unmarried:
50.0% (6)
Women who did not give birth in the past 12 months Now married:
47.8% (83)Unmarried:
52.2% (90)
Marital status - Native Hawaiian / Pacific Islander population 15 years and over
Males 39.3% Never married45.7% Now married4.1% Separated3.0% Widowed7.9% DivorcedFemales 43.3% Never married40.2% Now married1.2% Separated8.3% Widowed7.0% DivorcedWomen who gave birth in the past 12 months Now married:
52.6% (62)Unmarried:
47.4% (56)
Women who did not give birth in the past 12 months Now married:
30.6% (394)Unmarried:
69.4% (893)
Marital status - Other race population 15 years and over
Males 12.1% Never married25.9% Now married19.0% Separated0.0% Widowed43.1% DivorcedFemales 0.0% Never married35.7% Now married0.0% Separated0.0% Widowed64.3% DivorcedWomen who did not give birth in the past 12 months Now married:
100.0% (12)Unmarried:
0.0% (0)
Marital status - Two or more races population 15 years and over
Males 50.6% Never married37.0% Now married0.3% Separated4.7% Widowed7.4% DivorcedFemales 47.6% Never married38.4% Now married0.2% Separated8.3% Widowed5.5% DivorcedWomen who gave birth in the past 12 months Now married:
52.3% (24)Unmarried:
47.7% (22)
Women who did not give birth in the past 12 months Now married:
35.3% (367)Unmarried:
64.7% (673)
Marital status - White alone, not Hispanic / Latino population 15 years and over
Males 47.7% Never married50.6% Now married0.0% Separated1.7% Widowed0.0% DivorcedFemales 17.0% Never married53.8% Now married0.0% Separated17.5% Widowed11.7% DivorcedWomen who did not give birth in the past 12 months Now married:
44.9% (30)Unmarried:
55.1% (37)
Marital status - Hispanic or Latino population 15 years and over
Males 45.8% Never married35.2% Now married4.4% Separated0.4% Widowed14.2% DivorcedFemales 49.5% Never married41.2% Now married0.0% Separated4.8% Widowed4.4% DivorcedWomen who gave birth in the past 12 months Now married:
50.0% (7)Unmarried:
50.0% (7)
Women who did not give birth in the past 12 months Now married:
36.8% (135)Unmarried:
63.2% (233)
Ancestries in Nanakuli
62 1.3% American40 0.8% Polish22 0.4% German18 0.4% Nigerian17 0.3% Irish17 0.3% Portuguese
Children Nativity (place of birth) in Nanakuli
Children under 6 years - Living with two parents Both parents native 422 100.0% NativeBoth parents foreign-born 12 100.0% NativeOne native, one foreign-born parent 51 100.0% NativeChildren under 6 years - Living with one parent Native parent 484 100.0% NativeForeign-born parent 30 89.5% Native3 10.5% Foreign-bornChildren 6 to 17 years - Living with two parents Both parents native 1,095 100.0% NativeBoth parents foreign-born 33 100.0% NativeOne native, one foreign-born parent 149 100.0% NativeChildren 6 to 17 years - Living with one parent Native parent 675 99.5% Native4 0.5% Foreign-bornForeign-born parent 98 77.8% Native28 22.2% Foreign-born
Grandparents responsible for own grandchildren in Nanakuli
Grandparents (30 to 59 years) White / Caucasian 18 100.0% Not responsible for grandchildrenAsian 11 100.0% Not responsible for grandchildrenNative Hawaiian / Pacific Islander 17 11.9% Responsible for grandchildren123 88.1% Not responsible for grandchildrenTwo or more races 15 13.8% Responsible for grandchildren93 86.2% Not responsible for grandchildrenWhite alone, not Hispanic / Latino 21 100.0% Not responsible for grandchildrenHispanic or Latino 7 23.7% Responsible for grandchildren23 76.3% Not responsible for grandchildrenGrandparents (60 years and over) White / Caucasian 6 100.0% Not responsible for grandchildrenAsian 28 100.0% Not responsible for grandchildrenNative Hawaiian / Pacific Islander 102 29.4% Responsible for grandchildren246 70.6% Not responsible for grandchildrenTwo or more races 24 11.1% Responsible for grandchildren189 88.9% Not responsible for grandchildrenWhite alone, not Hispanic / Latino 6 100.0% Not responsible for grandchildrenHispanic or Latino 43 100.0% Not responsible for grandchildren