Races in New Milford, Connecticut (CT) Detailed Stats
Ancestries, Foreign-born residents, place of birth
Settings
X


Recent posts about races in New Milford, Connecticut on our local forum with over 2,400,000 registered users:
 | 2024 Connecticut Town Tournament VI (Celebrating the 10-Year Anniversary & Dazzleman's Memorial) (722 replies) |
| Who killed Everett Carr of New Milford in 1985? (0 replies) |
| Opinions on New Milford (10 replies) |
| Connecticut TOWN TOURNAMENT V (2022) (831 replies) |
| Connecticut TOWN TOURNAMENT IV (2020) (849 replies) |
| Economic Climate in CT (18750 replies) |
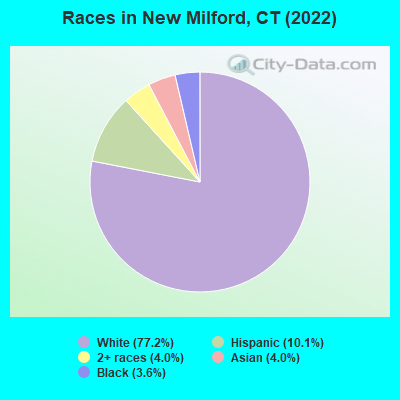
According to 2022 data, the most numerous races in New Milford, CT are White alone (5,497 residents), Hispanic (716 residents), and Black alone (256 residents). 83.9% of New Milford residents speak English at home. 9.3% of New Milford, CT residents are foreign-born (3.8% born in Latin America, 2.2% born in Asia, 1.8% born in Europe), which is 60.5% less than the foreign-born rate of 15.0% across the entire state of Connecticut.
Race distribution in New Milford
2000
2022

- 6,04291.1%White alone
- 2053.1%Hispanic
- 1402.1%Asian alone
- 1181.8%Black alone
- 1051.6%Two or more races
- 130.2%American Indian alone
- 90.1%Other race alone
- 10.02%Native Hawaiian and Other
Pacific Islander alone

-
- 5,49777.2%White alone
- 71610.1%Hispanic
- 2834.0%Asian alone
- 2864.0%Two or more races
- 2563.6%Black alone
- 60.08%American Indian alone
2000
2022
-
- 2,638,84577.5%White alone
- 320,3239.4%Hispanic
- 295,5718.7%Black alone
- 81,5642.4%Asian alone
- 52,8961.6%Two or more races
- 8,1410.2%Other race alone
- 7,2670.2%American Indian alone
- 9580.03%Native Hawaiian and Other
Pacific Islander alone

-
- 2,246,91362.0%White alone
- 658,97818.2%Hispanic
- 353,9739.8%Black alone
- 172,9294.8%Asian alone
- 159,6314.4%Two or more races
- 29,7610.8%Other race alone
- 3,4280.09%American Indian alone
- 5920.02%Native Hawaiian and Other
Pacific Islander alone

Income and house value in New Milford
- Median household income in 2022
- $77,038White non-Hispanic householders
- $61,716Asian householders
- $58,523Some other race householders
- $81,559Two or more races householders
- $59,023Hispanic or Latino race householders
- Median 2022 house value
- $327,050White Non-Hispanic householders
- $371,940Black or African American householders
- $232,721American Indian or Alaska Native householders
- $448,272Asian householders
- $155,147Two or more races householders
- $336,152Hispanic or Latino householders
Household income for White non-Hispanic householders

Household income for Black householders

Household income for Asian householders

Household income for Some other race householders

Household income for Two or more races householders

Household income for Hispanic or Latino race householders

Median age by race in New Milford
- 44.7Median age for White residents
- 44.7Males
- 44.8Females
- 17.3Median age for Black or African American residents
- 17.1Males
- -681,159,419.6Females
- -742,173,111.6Median age for American Indian / Alaska Native residents
- -701,030,927.1Males
- -704,477,611.2Females
- 27.8Median age for Asian residents
- 24.1Males
- 43.9Females
- -641,269,840.6Median age for Native Hawaiian / Pacific Islander residents
- -414,239,481.8Males
- -691,588,784.4Females
- 30.8Median age for Other race residents
- 46.5Males
- 31.3Females
- 24.1Median age for Two or more races residents
- 24.0Males
- 17.8Females
- 44.2Median age for White alone residents
- 44.2Males
- 44.4Females
- 27.9Median age for Hispanic or Latino residents
- 23.2Males
- 28.4Females
Owner/renter occupied households by race in New Milford
- House owners and renters - White residents
- 1,51065.1%Owner occupied
- 81034.9%Renter occupied
- House owners and renters - Black or African American residents
- 82100.0%Renter occupied
- House owners and renters - Asian residents
- 3939.2%Owner occupied
- 6060.8%Renter occupied
- House owners and renters - Other race residents
- 4742.2%Owner occupied
- 6557.8%Renter occupied
- House owners and renters - Two or more races residents
- 1614.6%Owner occupied
- 9385.4%Renter occupied
- House owners and renters - White alone residents
- 1,48663.5%Owner occupied
- 85236.5%Renter occupied
- House owners and renters - Hispanic or Latino residents
- 9539.6%Owner occupied
- 14460.4%Renter occupied
Language usage in New Milford
- English speakers - Total
- 83.9% of residents of New Milford speak English at home.
- 8.4% of residents speak Spanish at home
- 31957.6%Speak English very well
- 23542.4%Speak English less than very well
- 7.4% of residents speak other language at home
- 25752.9%Speak English very well
- 22947.1%Speak English less than very well
- English speakers - Born in the United States
- 96.0% of residents of New Milford speak English at home.
- 2.7% of residents speak Spanish at home
- 4075.5%Speak English very well
- 1324.5%Speak English less than very well
- 0.5% of residents speak other language at home
- 9100.0%Speak English less than very well
- English speakers - Native, born elsewhere
- 21.2% of residents of New Milford speak English at home.
- 75.0% of residents speak Spanish at home
- 2769.2%Speak English very well
- 1230.8%Speak English less than very well
- English speakers - Foreign-born
- 21.3% of residents of New Milford speak English at home.
- 29.4% of residents speak Spanish at home
- 4120.9%Speak English very well
- 15579.1%Speak English less than very well
- 48.5% of residents speak other language at home
- 18557.3%Speak English very well
- 13842.7%Speak English less than very well
White (Caucasian) - Speak only English
| Native: | 96.3% (4,750) |
| Foreign-born: | 21.1% (59) |
White (Caucasian) - Speak another language
| Native: | 4.2% (208) |
| Foreign-born: | 77.1% (215) |
Black or African American - Speak only English
| Native: | 99.1% (149) |
| Foreign-born: | 100.0% (25) |
Asian - Speak only English
| Native: | 9.3% (12) |
| Foreign-born: | 30.8% (47) |
Asian - Speak another language
| Native: | 88.4% (117) |
| Foreign-born: | 68.2% (104) |
Other race - Speak another language
| Native: | 39.1% (57) |
| Foreign-born: | 100.0% (86) |
Two or more races - Speak another language
| Native: | 16.9% (77) |
| Foreign-born: | 100.0% (73) |
White alone - Speak only English
| Native: | 97.6% (4,758) |
| Foreign-born: | 24.7% (61) |
White alone - Speak another language
| Native: | 2.4% (117) |
| Foreign-born: | 75.0% (185) |
Hispanic or Latino - Speak another language
| Native: | 47.8% (247) |
| Foreign-born: | 100.0% (165) |
Foreign-born residents in New Milford
666 residents are foreign born (3.8% Latin America, 2.2% Asia, 1.8% Europe).
| This city: | 9.3% |
| Connecticut: | 15.0% |


Marital status for residents in New Milford
Marital status - White (Caucasian) population 15 years and over
- Males
- 31.6%Never married
- 52.9%Now married
- 0.0%Separated
- 4.2%Widowed
- 11.3%Divorced
- Females
- 22.9%Never married
- 44.5%Now married
- 2.8%Separated
- 11.0%Widowed
- 18.8%Divorced
Women who gave birth in the past 12 months
| Now married: | 100.0% (3) |
| Unmarried: | 0.0% (0) |
Women who did not give birth in the past 12 months
| Now married: | 52.7% (609) |
| Unmarried: | 47.3% (545) |
Marital status - Black or African American population 15 years and over
- Males
- 41.1%Never married
- 12.6%Now married
- 0.0%Separated
- 0.0%Widowed
- 46.4%Divorced
- Females
- 20.0%Never married
- 80.0%Now married
- 0.0%Separated
- 0.0%Widowed
- 0.0%Divorced
Women who did not give birth in the past 12 months
| Now married: | 80.0% (24) |
| Unmarried: | 20.0% (6) |
Marital status - Asian population 15 years and over
- Males
- 58.2%Never married
- 32.7%Now married
- 9.1%Separated
- 0.0%Widowed
- 0.0%Divorced
- Females
- 33.1%Never married
- 41.4%Now married
- 0.0%Separated
- 25.6%Widowed
- 0.0%Divorced
Women who did not give birth in the past 12 months
| Now married: | 48.8% (41) |
| Unmarried: | 51.2% (43) |
Marital status - Other race population 15 years and over
- Males
- 14.6%Never married
- 85.4%Now married
- 0.0%Separated
- 0.0%Widowed
- 0.0%Divorced
- Females
- 30.6%Never married
- 69.4%Now married
- 0.0%Separated
- 0.0%Widowed
- 0.0%Divorced
Women who did not give birth in the past 12 months
| Now married: | 55.2% (45) |
| Unmarried: | 44.8% (37) |
Marital status - Two or more races population 15 years and over
- Males
- 58.3%Never married
- 37.9%Now married
- 0.0%Separated
- 0.0%Widowed
- 3.8%Divorced
- Females
- 85.9%Never married
- 14.1%Now married
- 0.0%Separated
- 0.0%Widowed
- 0.0%Divorced
Women who did not give birth in the past 12 months
| Now married: | 14.1% (29) |
| Unmarried: | 85.9% (177) |
Marital status - White alone, not Hispanic / Latino population 15 years and over
- Males
- 30.8%Never married
- 53.0%Now married
- 0.0%Separated
- 4.3%Widowed
- 11.8%Divorced
- Females
- 22.6%Never married
- 44.3%Now married
- 3.0%Separated
- 11.6%Widowed
- 18.7%Divorced
Women who gave birth in the past 12 months
| Now married: | 100.0% (3) |
| Unmarried: | 0.0% (0) |
Women who did not give birth in the past 12 months
| Now married: | 53.4% (606) |
| Unmarried: | 46.6% (528) |
Marital status - Hispanic or Latino population 15 years and over
- Males
- 48.8%Never married
- 51.2%Now married
- 0.0%Separated
- 0.0%Widowed
- 0.0%Divorced
- Females
- 48.5%Never married
- 43.1%Now married
- 0.0%Separated
- 0.0%Widowed
- 8.5%Divorced
Women who did not give birth in the past 12 months
| Now married: | 32.5% (78) |
| Unmarried: | 67.5% (162) |
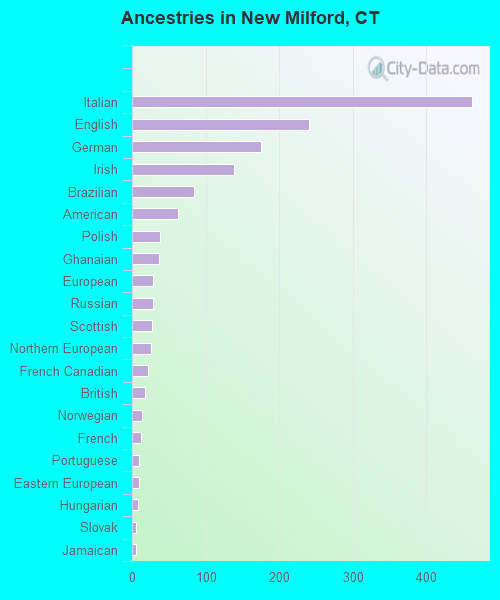
Ancestries in New Milford

- 46221.3%Italian
- 24111.1%English
- 1758.1%German
- 1396.4%Irish
- 843.9%Brazilian
- 632.9%American
- 381.8%Polish
- 371.7%Ghanaian
- 291.3%European
- 281.3%Russian
- 271.2%Scottish
- 261.2%Northern European
- 221.0%French Canadian
- 180.8%British
- 140.6%Norwegian
- 120.6%French
- 100.5%Portuguese
- 90.4%Eastern European
- 80.4%Hungarian
- 60.3%Slovak
- 60.3%Jamaican
Geographical mobility in New Milford

- Same house 1 year ago
- 5,02690.6%White (Caucasian)
- 23191.0%Black or African American
- 894.8%American Indian / Alaska Native
- 22277.7%Asian
- 22396.9%Other race
- 51183.8%Two or more races
- 4,93589.9%White alone, not Hispanic / Latino
- 63989.5%Hispanic or Latino

-
- Moved within same county
- 2805.0%White / Caucasian
- 4716.6%Asian
- 104.6%Other race
- 8614.1%Two or more races
- 3075.6%White alone, not Hispanic / Latino
- 669.3%Hispanic or Latino

-
- Moved within same state
- 340.6%White / Caucasian
- 218.1%Black or African American
- 20.8%Asian
- 350.6%White alone, not Hispanic / Latino

-
- Moved from different state
- 2053.7%White / Caucasian
- 2093.8%White alone, not Hispanic / Latino

Children Nativity (place of birth) in New Milford
Place of birth for residents in New Milford
![Place of birth for the foreign-born population - Regions]()
- 285Americas
- 285Latin America
- 208South America
- 166Asia
- 136Europe
- 92Eastern Asia
- 88Eastern Europe
- 66Africa
- 66Western Africa
- 61China
- 46Central America
- 31Caribbean
- 30Western Asia
- 29South Eastern Asia
- 26Northern Europe
- 20Western Europe
- 14South Central Asia
- 11Oceania
- 11Australia and New Zealand Subregion

![Place of birth for the foreign-born population - Countries]()
- 106Ecuador
- 90Brazil
- 71Poland
- 66Ghana
- 61China
- 46Mexico
- 30Saudi Arabia
- 27Dominican Republic
- 20Germany
- 18England
- 18Philippines
- 14India
- 11Australia
- 11Venezuela
- 10Cambodia
- 9Hungary
- 8Croatia
- 7Scotland
- 4Jamaica

Zip codes: 06776.