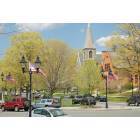
New Milford, Connecticut Submit your own pictures of this place and show them to the world
OSM Map
General Map
Google Map
MSN Map
OSM Map
General Map
Google Map
MSN Map
OSM Map
General Map
Google Map
MSN Map
OSM Map
General Map
Google Map
MSN Map
Please wait while loading the map...
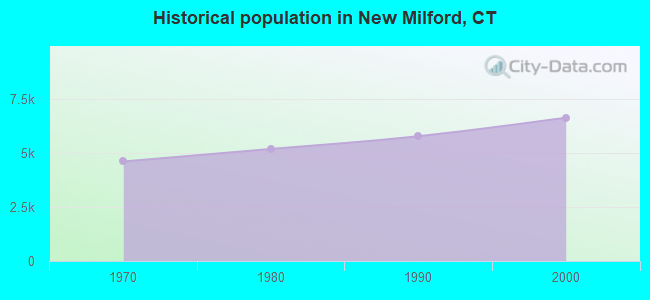
Population in 2010: 6,523. Population change since 2000: -1.7%Males: 2,914 Females: 3,609
March 2022 cost of living index in New Milford: 130.8 (high, U.S. average is 100) Percentage of residents living in poverty in 2022: 6.0%for White Non-Hispanic residents , 13.6% for Hispanic or Latino residents , 14.4% for other race residents , 17.7% for two or more races residents )
Profiles of local businesses
Business Search - 14 Million verified businesses
Data:
Median household income ($)
Median household income (% change since 2000)
Household income diversity
Ratio of average income to average house value (%)
Ratio of average income to average rent
Median household income ($) - White
Median household income ($) - Black or African American
Median household income ($) - Asian
Median household income ($) - Hispanic or Latino
Median household income ($) - American Indian and Alaska Native
Median household income ($) - Multirace
Median household income ($) - Other Race
Median household income for houses/condos with a mortgage ($)
Median household income for apartments without a mortgage ($)
Races - White alone (%)
Races - White alone (% change since 2000)
Races - Black alone (%)
Races - Black alone (% change since 2000)
Races - American Indian alone (%)
Races - American Indian alone (% change since 2000)
Races - Asian alone (%)
Races - Asian alone (% change since 2000)
Races - Hispanic (%)
Races - Hispanic (% change since 2000)
Races - Native Hawaiian and Other Pacific Islander alone (%)
Races - Native Hawaiian and Other Pacific Islander alone (% change since 2000)
Races - Two or more races (%)
Races - Two or more races (% change since 2000)
Races - Other race alone (%)
Races - Other race alone (% change since 2000)
Racial diversity
Unemployment (%)
Unemployment (% change since 2000)
Unemployment (%) - White
Unemployment (%) - Black or African American
Unemployment (%) - Asian
Unemployment (%) - Hispanic or Latino
Unemployment (%) - American Indian and Alaska Native
Unemployment (%) - Multirace
Unemployment (%) - Other Race
Population density (people per square mile)
Population - Males (%)
Population - Females (%)
Population - Males (%) - White
Population - Males (%) - Black or African American
Population - Males (%) - Asian
Population - Males (%) - Hispanic or Latino
Population - Males (%) - American Indian and Alaska Native
Population - Males (%) - Multirace
Population - Males (%) - Other Race
Population - Females (%) - White
Population - Females (%) - Black or African American
Population - Females (%) - Asian
Population - Females (%) - Hispanic or Latino
Population - Females (%) - American Indian and Alaska Native
Population - Females (%) - Multirace
Population - Females (%) - Other Race
Coronavirus confirmed cases (Apr 26, 2024)
Deaths caused by coronavirus (Apr 26, 2024)
Coronavirus confirmed cases (per 100k population) (Apr 26, 2024)
Deaths caused by coronavirus (per 100k population) (Apr 26, 2024)
Daily increase in number of cases (Apr 26, 2024)
Weekly increase in number of cases (Apr 26, 2024)
Cases doubled (in days) (Apr 26, 2024)
Hospitalized patients (Apr 18, 2022)
Negative test results (Apr 18, 2022)
Total test results (Apr 18, 2022)
COVID Vaccine doses distributed (per 100k population) (Sep 19, 2023)
COVID Vaccine doses administered (per 100k population) (Sep 19, 2023)
COVID Vaccine doses distributed (Sep 19, 2023)
COVID Vaccine doses administered (Sep 19, 2023)
Likely homosexual households (%)
Likely homosexual households (% change since 2000)
Likely homosexual households - Lesbian couples (%)
Likely homosexual households - Lesbian couples (% change since 2000)
Likely homosexual households - Gay men (%)
Likely homosexual households - Gay men (% change since 2000)
Cost of living index
Median gross rent ($)
Median contract rent ($)
Median monthly housing costs ($)
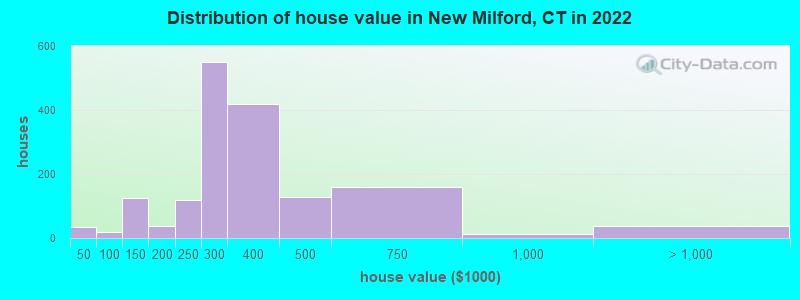
Median house or condo value ($)
Median house or condo value ($ change since 2000)
Mean house or condo value by units in structure - 1, detached ($)
Mean house or condo value by units in structure - 1, attached ($)
Mean house or condo value by units in structure - 2 ($)
Mean house or condo value by units in structure by units in structure - 3 or 4 ($)
Mean house or condo value by units in structure - 5 or more ($)
Mean house or condo value by units in structure - Boat, RV, van, etc. ($)
Mean house or condo value by units in structure - Mobile home ($)
Median house or condo value ($) - White
Median house or condo value ($) - Black or African American
Median house or condo value ($) - Asian
Median house or condo value ($) - Hispanic or Latino
Median house or condo value ($) - American Indian and Alaska Native
Median house or condo value ($) - Multirace
Median house or condo value ($) - Other Race
Median resident age
Resident age diversity
Median resident age - Males
Median resident age - Females
Median resident age - White
Median resident age - Black or African American
Median resident age - Asian
Median resident age - Hispanic or Latino
Median resident age - American Indian and Alaska Native
Median resident age - Multirace
Median resident age - Other Race
Median resident age - Males - White
Median resident age - Males - Black or African American
Median resident age - Males - Asian
Median resident age - Males - Hispanic or Latino
Median resident age - Males - American Indian and Alaska Native
Median resident age - Males - Multirace
Median resident age - Males - Other Race
Median resident age - Females - White
Median resident age - Females - Black or African American
Median resident age - Females - Asian
Median resident age - Females - Hispanic or Latino
Median resident age - Females - American Indian and Alaska Native
Median resident age - Females - Multirace
Median resident age - Females - Other Race
Commute - mean travel time to work (minutes)
Travel time to work - Less than 5 minutes (%)
Travel time to work - Less than 5 minutes (% change since 2000)
Travel time to work - 5 to 9 minutes (%)
Travel time to work - 5 to 9 minutes (% change since 2000)
Travel time to work - 10 to 19 minutes (%)
Travel time to work - 10 to 19 minutes (% change since 2000)
Travel time to work - 20 to 29 minutes (%)
Travel time to work - 20 to 29 minutes (% change since 2000)
Travel time to work - 30 to 39 minutes (%)
Travel time to work - 30 to 39 minutes (% change since 2000)
Travel time to work - 40 to 59 minutes (%)
Travel time to work - 40 to 59 minutes (% change since 2000)
Travel time to work - 60 to 89 minutes (%)
Travel time to work - 60 to 89 minutes (% change since 2000)
Travel time to work - 90 or more minutes (%)
Travel time to work - 90 or more minutes (% change since 2000)
Marital status - Never married (%)
Marital status - Now married (%)
Marital status - Separated (%)
Marital status - Widowed (%)
Marital status - Divorced (%)
Median family income ($)
Median family income (% change since 2000)
Median non-family income ($)
Median non-family income (% change since 2000)
Median per capita income ($)
Median per capita income (% change since 2000)
Median family income ($) - White
Median family income ($) - Black or African American
Median family income ($) - Asian
Median family income ($) - Hispanic or Latino
Median family income ($) - American Indian and Alaska Native
Median family income ($) - Multirace
Median family income ($) - Other Race
Median year house/condo built
Median year apartment built
Year house built - Built 2005 or later (%)
Year house built - Built 2000 to 2004 (%)
Year house built - Built 1990 to 1999 (%)
Year house built - Built 1980 to 1989 (%)
Year house built - Built 1970 to 1979 (%)
Year house built - Built 1960 to 1969 (%)
Year house built - Built 1950 to 1959 (%)
Year house built - Built 1940 to 1949 (%)
Year house built - Built 1939 or earlier (%)
Average household size
Household density (households per square mile)
Average household size - White
Average household size - Black or African American
Average household size - Asian
Average household size - Hispanic or Latino
Average household size - American Indian and Alaska Native
Average household size - Multirace
Average household size - Other Race
Occupied housing units (%)
Vacant housing units (%)
Owner occupied housing units (%)
Renter occupied housing units (%)
Vacancy status - For rent (%)
Vacancy status - For sale only (%)
Vacancy status - Rented or sold, not occupied (%)
Vacancy status - For seasonal, recreational, or occasional use (%)
Vacancy status - For migrant workers (%)
Vacancy status - Other vacant (%)
Residents with income below the poverty level (%)
Residents with income below 50% of the poverty level (%)
Children below poverty level (%)
Poor families by family type - Married-couple family (%)
Poor families by family type - Male, no wife present (%)
Poor families by family type - Female, no husband present (%)
Poverty status for native-born residents (%)
Poverty status for foreign-born residents (%)
Poverty among high school graduates not in families (%)
Poverty among people who did not graduate high school not in families (%)
Residents with income below the poverty level (%) - White
Residents with income below the poverty level (%) - Black or African American
Residents with income below the poverty level (%) - Asian
Residents with income below the poverty level (%) - Hispanic or Latino
Residents with income below the poverty level (%) - American Indian and Alaska Native
Residents with income below the poverty level (%) - Multirace
Residents with income below the poverty level (%) - Other Race
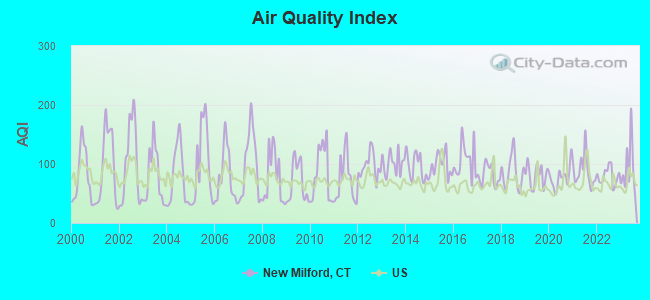
Air pollution - Air Quality Index (AQI)
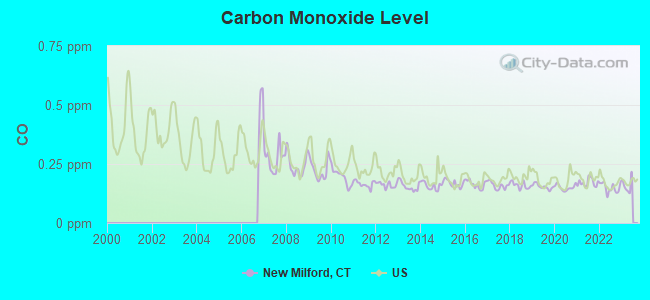
Air pollution - CO
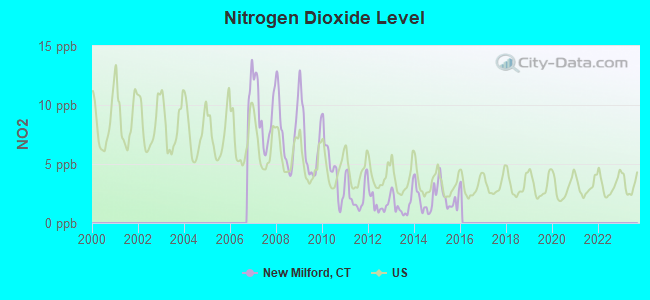
Air pollution - NO2
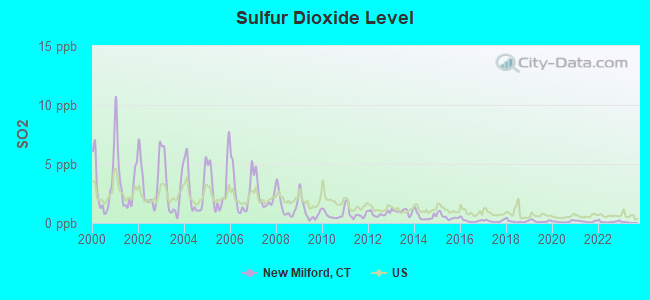
Air pollution - SO2
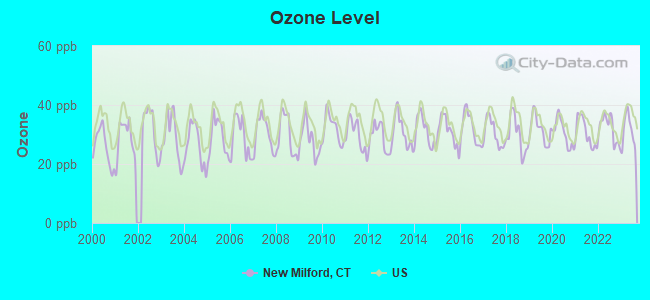
Air pollution - Ozone
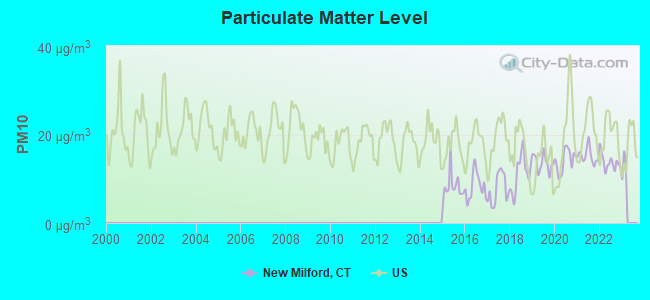
Air pollution - PM10
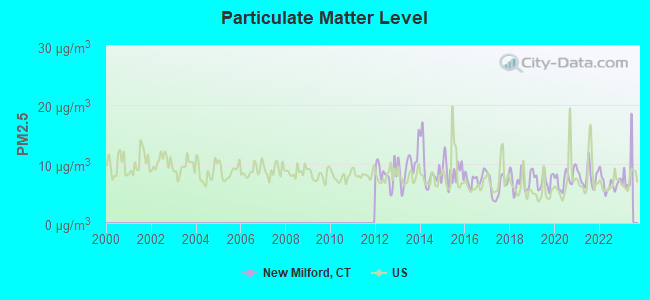
Air pollution - PM25
Air pollution - Pb
Crime - Murders per 100,000 population
Crime - Rapes per 100,000 population
Crime - Robberies per 100,000 population
Crime - Assaults per 100,000 population
Crime - Burglaries per 100,000 population
Crime - Thefts per 100,000 population
Crime - Auto thefts per 100,000 population
Crime - Arson per 100,000 population
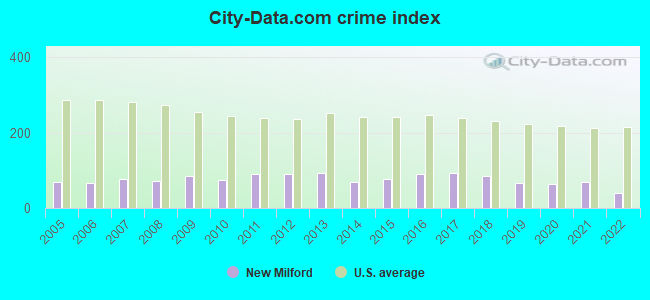
Crime - City-data.com crime index
Crime - Violent crime index
Crime - Property crime index
Crime - Murders per 100,000 population (5 year average)
Crime - Rapes per 100,000 population (5 year average)
Crime - Robberies per 100,000 population (5 year average)
Crime - Assaults per 100,000 population (5 year average)
Crime - Burglaries per 100,000 population (5 year average)
Crime - Thefts per 100,000 population (5 year average)
Crime - Auto thefts per 100,000 population (5 year average)
Crime - Arson per 100,000 population (5 year average)
Crime - City-data.com crime index (5 year average)
Crime - Violent crime index (5 year average)
Crime - Property crime index (5 year average)
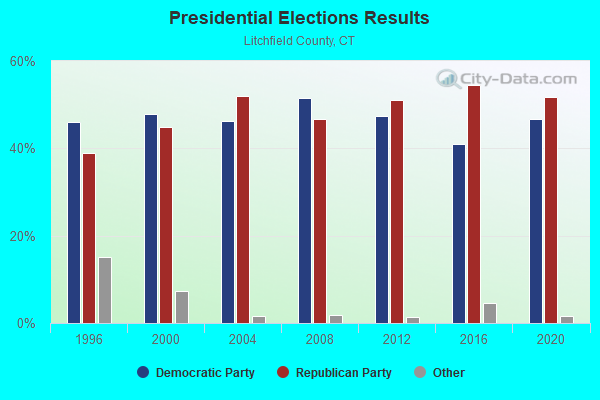
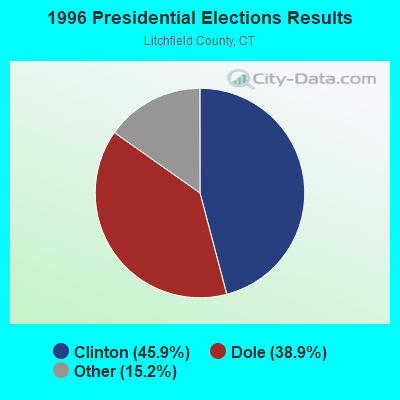
1996 Presidential Elections Results (%) - Democratic Party (Clinton)
1996 Presidential Elections Results (%) - Republican Party (Dole)
1996 Presidential Elections Results (%) - Other
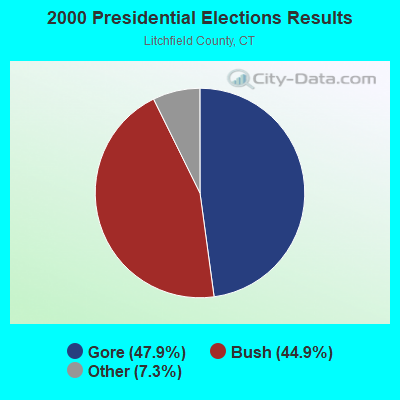
2000 Presidential Elections Results (%) - Democratic Party (Gore)
2000 Presidential Elections Results (%) - Republican Party (Bush)
2000 Presidential Elections Results (%) - Other
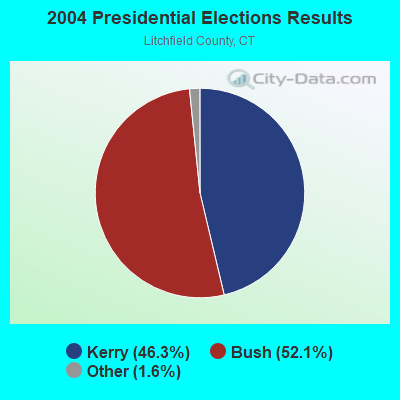
2004 Presidential Elections Results (%) - Democratic Party (Kerry)
2004 Presidential Elections Results (%) - Republican Party (Bush)
2004 Presidential Elections Results (%) - Other
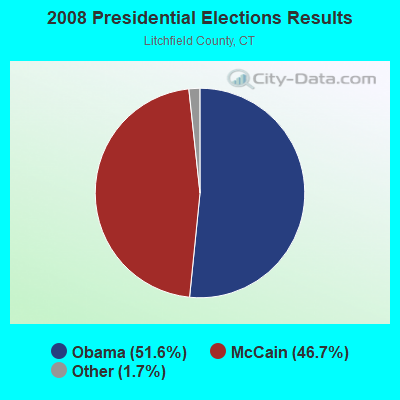
2008 Presidential Elections Results (%) - Democratic Party (Obama)
2008 Presidential Elections Results (%) - Republican Party (McCain)
2008 Presidential Elections Results (%) - Other
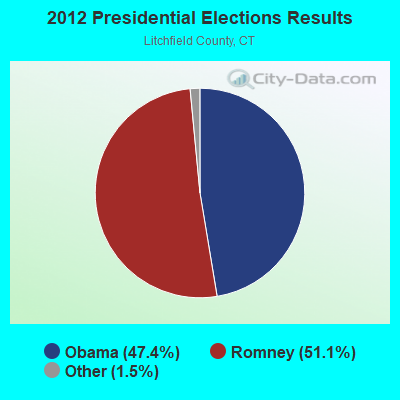
2012 Presidential Elections Results (%) - Democratic Party (Obama)
2012 Presidential Elections Results (%) - Republican Party (Romney)
2012 Presidential Elections Results (%) - Other
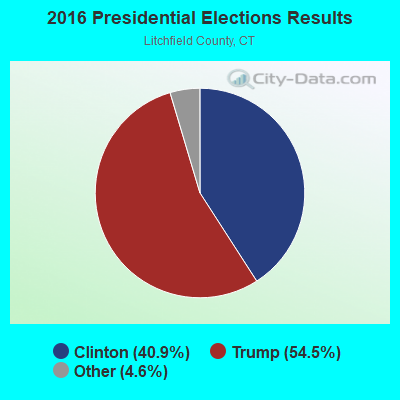
2016 Presidential Elections Results (%) - Democratic Party (Clinton)
2016 Presidential Elections Results (%) - Republican Party (Trump)
2016 Presidential Elections Results (%) - Other
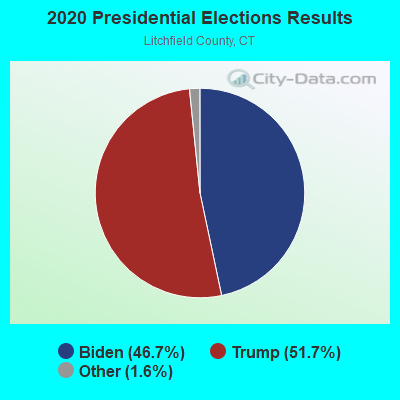
2020 Presidential Elections Results (%) - Democratic Party (Biden)
2020 Presidential Elections Results (%) - Republican Party (Trump)
2020 Presidential Elections Results (%) - Other
Ancestries Reported - Arab (%)
Ancestries Reported - Czech (%)
Ancestries Reported - Danish (%)
Ancestries Reported - Dutch (%)
Ancestries Reported - English (%)
Ancestries Reported - French (%)
Ancestries Reported - French Canadian (%)
Ancestries Reported - German (%)
Ancestries Reported - Greek (%)
Ancestries Reported - Hungarian (%)
Ancestries Reported - Irish (%)
Ancestries Reported - Italian (%)
Ancestries Reported - Lithuanian (%)
Ancestries Reported - Norwegian (%)
Ancestries Reported - Polish (%)
Ancestries Reported - Portuguese (%)
Ancestries Reported - Russian (%)
Ancestries Reported - Scotch-Irish (%)
Ancestries Reported - Scottish (%)
Ancestries Reported - Slovak (%)
Ancestries Reported - Subsaharan African (%)
Ancestries Reported - Swedish (%)
Ancestries Reported - Swiss (%)
Ancestries Reported - Ukrainian (%)
Ancestries Reported - United States (%)
Ancestries Reported - Welsh (%)
Ancestries Reported - West Indian (%)
Ancestries Reported - Other (%)
Educational Attainment - No schooling completed (%)
Educational Attainment - Less than high school (%)
Educational Attainment - High school or equivalent (%)
Educational Attainment - Less than 1 year of college (%)
Educational Attainment - 1 or more years of college (%)
Educational Attainment - Associate degree (%)
Educational Attainment - Bachelor's degree (%)
Educational Attainment - Master's degree (%)
Educational Attainment - Professional school degree (%)
Educational Attainment - Doctorate degree (%)
School Enrollment - Nursery, preschool (%)
School Enrollment - Kindergarten (%)
School Enrollment - Grade 1 to 4 (%)
School Enrollment - Grade 5 to 8 (%)
School Enrollment - Grade 9 to 12 (%)
School Enrollment - College undergrad (%)
School Enrollment - Graduate or professional (%)
School Enrollment - Not enrolled in school (%)
School enrollment - Public schools (%)
School enrollment - Private schools (%)
School enrollment - Not enrolled (%)
Median number of rooms in houses and condos
Median number of rooms in apartments
Housing units lacking complete plumbing facilities (%)
Housing units lacking complete kitchen facilities (%)
Density of houses
Urban houses (%)
Rural houses (%)
Households with people 60 years and over (%)
Households with people 65 years and over (%)
Households with people 75 years and over (%)
Households with one or more nonrelatives (%)
Households with no nonrelatives (%)
Population in households (%)
Family households (%)
Nonfamily households (%)
Population in families (%)
Family households with own children (%)
Median number of bedrooms in owner occupied houses
Mean number of bedrooms in owner occupied houses
Median number of bedrooms in renter occupied houses
Mean number of bedrooms in renter occupied houses
Median number of vehichles in owner occupied houses
Mean number of vehichles in owner occupied houses
Median number of vehichles in renter occupied houses
Mean number of vehichles in renter occupied houses
Mortgage status - with mortgage (%)
Mortgage status - with second mortgage (%)
Mortgage status - with home equity loan (%)
Mortgage status - with both second mortgage and home equity loan (%)
Mortgage status - without a mortgage (%)
Average family size
Average family size - White
Average family size - Black or African American
Average family size - Asian
Average family size - Hispanic or Latino
Average family size - American Indian and Alaska Native
Average family size - Multirace
Average family size - Other Race
Geographical mobility - Same house 1 year ago (%)
Geographical mobility - Moved within same county (%)
Geographical mobility - Moved from different county within same state (%)
Geographical mobility - Moved from different state (%)
Geographical mobility - Moved from abroad (%)
Place of birth - Born in state of residence (%)
Place of birth - Born in other state (%)
Place of birth - Native, outside of US (%)
Place of birth - Foreign born (%)
Housing units in structures - 1, detached (%)
Housing units in structures - 1, attached (%)
Housing units in structures - 2 (%)
Housing units in structures - 3 or 4 (%)
Housing units in structures - 5 to 9 (%)
Housing units in structures - 10 to 19 (%)
Housing units in structures - 20 to 49 (%)
Housing units in structures - 50 or more (%)
Housing units in structures - Mobile home (%)
Housing units in structures - Boat, RV, van, etc. (%)
House/condo owner moved in on average (years ago)
Renter moved in on average (years ago)
Year householder moved into unit - Moved in 1999 to March 2000 (%)
Year householder moved into unit - Moved in 1995 to 1998 (%)
Year householder moved into unit - Moved in 1990 to 1994 (%)
Year householder moved into unit - Moved in 1980 to 1989 (%)
Year householder moved into unit - Moved in 1970 to 1979 (%)
Year householder moved into unit - Moved in 1969 or earlier (%)
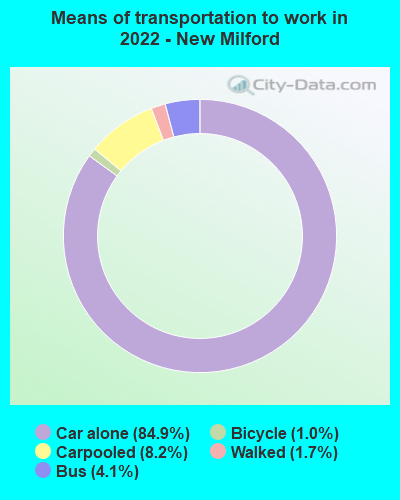
Means of transportation to work - Drove car alone (%)
Means of transportation to work - Carpooled (%)
Means of transportation to work - Public transportation (%)
Means of transportation to work - Bus or trolley bus (%)
Means of transportation to work - Streetcar or trolley car (%)
Means of transportation to work - Subway or elevated (%)
Means of transportation to work - Railroad (%)
Means of transportation to work - Ferryboat (%)
Means of transportation to work - Taxicab (%)
Means of transportation to work - Motorcycle (%)
Means of transportation to work - Bicycle (%)
Means of transportation to work - Walked (%)
Means of transportation to work - Other means (%)
Working at home (%)
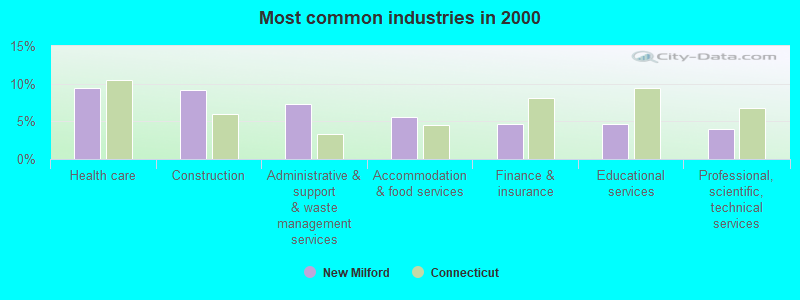
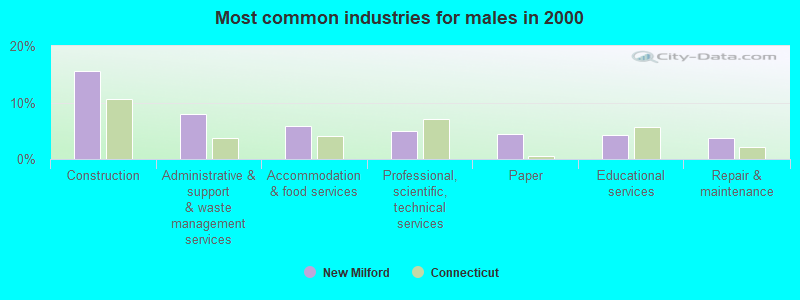
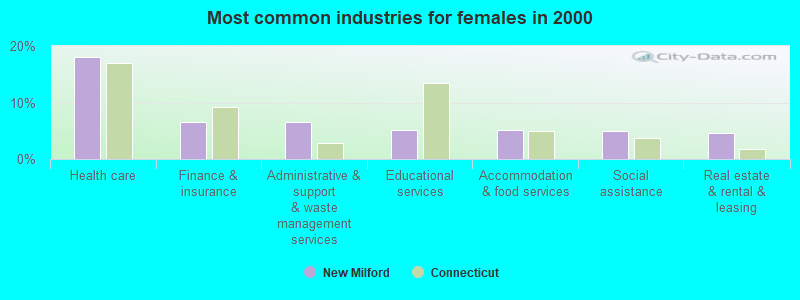
Industry diversity
Most Common Industries - Agriculture, forestry, fishing and hunting, and mining (%)
Most Common Industries - Agriculture, forestry, fishing and hunting (%)
Most Common Industries - Mining, quarrying, and oil and gas extraction (%)
Most Common Industries - Construction (%)
Most Common Industries - Manufacturing (%)
Most Common Industries - Wholesale trade (%)
Most Common Industries - Retail trade (%)
Most Common Industries - Transportation and warehousing, and utilities (%)
Most Common Industries - Transportation and warehousing (%)
Most Common Industries - Utilities (%)
Most Common Industries - Information (%)
Most Common Industries - Finance and insurance, and real estate and rental and leasing (%)
Most Common Industries - Finance and insurance (%)
Most Common Industries - Real estate and rental and leasing (%)
Most Common Industries - Professional, scientific, and management, and administrative and waste management services (%)
Most Common Industries - Professional, scientific, and technical services (%)
Most Common Industries - Management of companies and enterprises (%)
Most Common Industries - Administrative and support and waste management services (%)
Most Common Industries - Educational services, and health care and social assistance (%)
Most Common Industries - Educational services (%)
Most Common Industries - Health care and social assistance (%)
Most Common Industries - Arts, entertainment, and recreation, and accommodation and food services (%)
Most Common Industries - Arts, entertainment, and recreation (%)
Most Common Industries - Accommodation and food services (%)
Most Common Industries - Other services, except public administration (%)
Most Common Industries - Public administration (%)
Occupation diversity
Most Common Occupations - Management, business, science, and arts occupations (%)
Most Common Occupations - Management, business, and financial occupations (%)
Most Common Occupations - Management occupations (%)
Most Common Occupations - Business and financial operations occupations (%)
Most Common Occupations - Computer, engineering, and science occupations (%)
Most Common Occupations - Computer and mathematical occupations (%)
Most Common Occupations - Architecture and engineering occupations (%)
Most Common Occupations - Life, physical, and social science occupations (%)
Most Common Occupations - Education, legal, community service, arts, and media occupations (%)
Most Common Occupations - Community and social service occupations (%)
Most Common Occupations - Legal occupations (%)
Most Common Occupations - Education, training, and library occupations (%)
Most Common Occupations - Arts, design, entertainment, sports, and media occupations (%)
Most Common Occupations - Healthcare practitioners and technical occupations (%)
Most Common Occupations - Health diagnosing and treating practitioners and other technical occupations (%)
Most Common Occupations - Health technologists and technicians (%)
Most Common Occupations - Service occupations (%)
Most Common Occupations - Healthcare support occupations (%)
Most Common Occupations - Protective service occupations (%)
Most Common Occupations - Fire fighting and prevention, and other protective service workers including supervisors (%)
Most Common Occupations - Law enforcement workers including supervisors (%)
Most Common Occupations - Food preparation and serving related occupations (%)
Most Common Occupations - Building and grounds cleaning and maintenance occupations (%)
Most Common Occupations - Personal care and service occupations (%)
Most Common Occupations - Sales and office occupations (%)
Most Common Occupations - Sales and related occupations (%)
Most Common Occupations - Office and administrative support occupations (%)
Most Common Occupations - Natural resources, construction, and maintenance occupations (%)
Most Common Occupations - Farming, fishing, and forestry occupations (%)
Most Common Occupations - Construction and extraction occupations (%)
Most Common Occupations - Installation, maintenance, and repair occupations (%)
Most Common Occupations - Production, transportation, and material moving occupations (%)
Most Common Occupations - Production occupations (%)
Most Common Occupations - Transportation occupations (%)
Most Common Occupations - Material moving occupations (%)
People in Group quarters - Institutionalized population (%)
People in Group quarters - Correctional institutions (%)
People in Group quarters - Federal prisons and detention centers (%)
People in Group quarters - Halfway houses (%)
People in Group quarters - Local jails and other confinement facilities (including police lockups) (%)
People in Group quarters - Military disciplinary barracks (%)
People in Group quarters - State prisons (%)
People in Group quarters - Other types of correctional institutions (%)
People in Group quarters - Nursing homes (%)
People in Group quarters - Hospitals/wards, hospices, and schools for the handicapped (%)
People in Group quarters - Hospitals/wards and hospices for chronically ill (%)
People in Group quarters - Hospices or homes for chronically ill (%)
People in Group quarters - Military hospitals or wards for chronically ill (%)
People in Group quarters - Other hospitals or wards for chronically ill (%)
People in Group quarters - Hospitals or wards for drug/alcohol abuse (%)
People in Group quarters - Mental (Psychiatric) hospitals or wards (%)
People in Group quarters - Schools, hospitals, or wards for the mentally retarded (%)
People in Group quarters - Schools, hospitals, or wards for the physically handicapped (%)
People in Group quarters - Institutions for the deaf (%)
People in Group quarters - Institutions for the blind (%)
People in Group quarters - Orthopedic wards and institutions for the physically handicapped (%)
People in Group quarters - Wards in general hospitals for patients who have no usual home elsewhere (%)
People in Group quarters - Wards in military hospitals for patients who have no usual home elsewhere (%)
People in Group quarters - Juvenile institutions (%)
People in Group quarters - Long-term care (%)
People in Group quarters - Homes for abused, dependent, and neglected children (%)
People in Group quarters - Residential treatment centers for emotionally disturbed children (%)
People in Group quarters - Training schools for juvenile delinquents (%)
People in Group quarters - Short-term care, detention or diagnostic centers for delinquent children (%)
People in Group quarters - Type of juvenile institution unknown (%)
People in Group quarters - Noninstitutionalized population (%)
People in Group quarters - College dormitories (includes college quarters off campus) (%)
People in Group quarters - Military quarters (%)
People in Group quarters - On base (%)
People in Group quarters - Barracks, unaccompanied personnel housing (UPH), (Enlisted/Officer), ;and similar group living quarters for military personnel (%)
People in Group quarters - Transient quarters for temporary residents (%)
People in Group quarters - Military ships (%)
People in Group quarters - Group homes (%)
People in Group quarters - Homes or halfway houses for drug/alcohol abuse (%)
People in Group quarters - Homes for the mentally ill (%)
People in Group quarters - Homes for the mentally retarded (%)
People in Group quarters - Homes for the physically handicapped (%)
People in Group quarters - Other group homes (%)
People in Group quarters - Religious group quarters (%)
People in Group quarters - Dormitories (%)
People in Group quarters - Agriculture workers' dormitories on farms (%)
People in Group quarters - Job Corps and vocational training facilities (%)
People in Group quarters - Other workers' dormitories (%)
People in Group quarters - Crews of maritime vessels (%)
People in Group quarters - Other nonhousehold living situations (%)
People in Group quarters - Other noninstitutional group quarters (%)
Residents speaking English at home (%)
Residents speaking English at home - Born in the United States (%)
Residents speaking English at home - Native, born elsewhere (%)
Residents speaking English at home - Foreign born (%)
Residents speaking Spanish at home (%)
Residents speaking Spanish at home - Born in the United States (%)
Residents speaking Spanish at home - Native, born elsewhere (%)
Residents speaking Spanish at home - Foreign born (%)
Residents speaking other language at home (%)
Residents speaking other language at home - Born in the United States (%)
Residents speaking other language at home - Native, born elsewhere (%)
Residents speaking other language at home - Foreign born (%)
Class of Workers - Employee of private company (%)
Class of Workers - Self-employed in own incorporated business (%)
Class of Workers - Private not-for-profit wage and salary workers (%)
Class of Workers - Local government workers (%)
Class of Workers - State government workers (%)
Class of Workers - Federal government workers (%)
Class of Workers - Self-employed workers in own not incorporated business and Unpaid family workers (%)
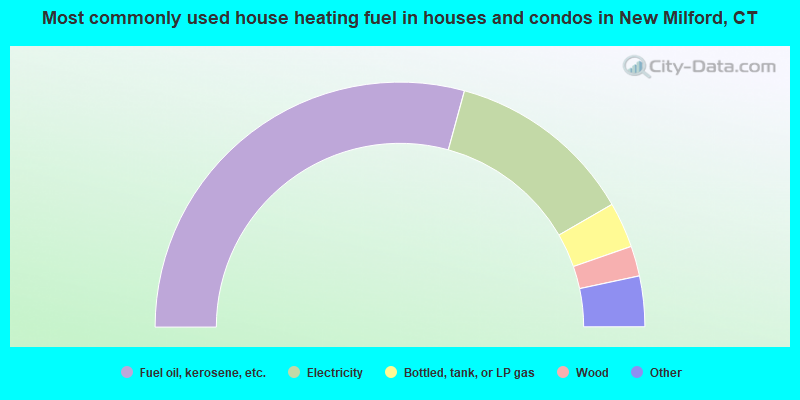
House heating fuel used in houses and condos - Utility gas (%)
House heating fuel used in houses and condos - Bottled, tank, or LP gas (%)
House heating fuel used in houses and condos - Electricity (%)
House heating fuel used in houses and condos - Fuel oil, kerosene, etc. (%)
House heating fuel used in houses and condos - Coal or coke (%)
House heating fuel used in houses and condos - Wood (%)
House heating fuel used in houses and condos - Solar energy (%)
House heating fuel used in houses and condos - Other fuel (%)
House heating fuel used in houses and condos - No fuel used (%)
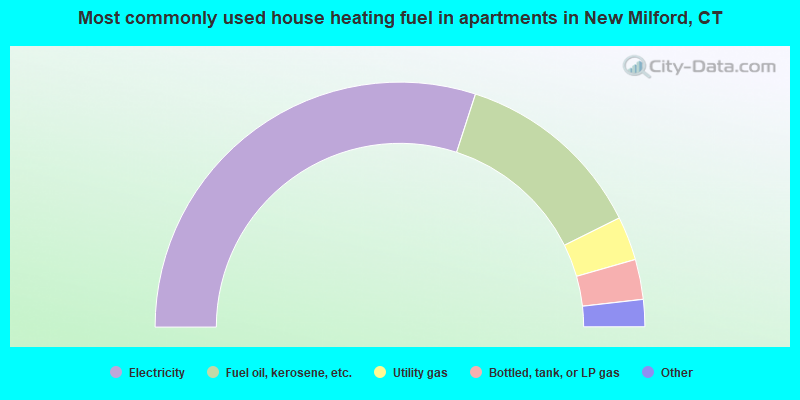
House heating fuel used in apartments - Utility gas (%)
House heating fuel used in apartments - Bottled, tank, or LP gas (%)
House heating fuel used in apartments - Electricity (%)
House heating fuel used in apartments - Fuel oil, kerosene, etc. (%)
House heating fuel used in apartments - Coal or coke (%)
House heating fuel used in apartments - Wood (%)
House heating fuel used in apartments - Solar energy (%)
House heating fuel used in apartments - Other fuel (%)
House heating fuel used in apartments - No fuel used (%)
Armed forces status - In Armed Forces (%)
Armed forces status - Civilian (%)
Armed forces status - Civilian - Veteran (%)
Armed forces status - Civilian - Nonveteran (%)
Fatal accidents locations in years 2005-2021
Fatal accidents locations in 2005
Fatal accidents locations in 2006
Fatal accidents locations in 2007
Fatal accidents locations in 2008
Fatal accidents locations in 2009
Fatal accidents locations in 2010
Fatal accidents locations in 2011
Fatal accidents locations in 2012
Fatal accidents locations in 2013
Fatal accidents locations in 2014
Fatal accidents locations in 2015
Fatal accidents locations in 2016
Fatal accidents locations in 2017
Fatal accidents locations in 2018
Fatal accidents locations in 2019
Fatal accidents locations in 2020
Fatal accidents locations in 2021
Alcohol use - People drinking some alcohol every month (%)
Alcohol use - People not drinking at all (%)
Alcohol use - Average days/month drinking alcohol
Alcohol use - Average drinks/week
Alcohol use - Average days/year people drink much
Audiometry - Average condition of hearing (%)
Audiometry - People that can hear a whisper from across a quiet room (%)
Audiometry - People that can hear normal voice from across a quiet room (%)
Audiometry - Ears ringing, roaring, buzzing (%)
Audiometry - Had a job exposure to loud noise (%)
Audiometry - Had off-work exposure to loud noise (%)
Blood Pressure & Cholesterol - Has high blood pressure (%)
Blood Pressure & Cholesterol - Checking blood pressure at home (%)
Blood Pressure & Cholesterol - Frequently checking blood cholesterol (%)
Blood Pressure & Cholesterol - Has high cholesterol level (%)
Consumer Behavior - Money monthly spent on food at supermarket/grocery store
Consumer Behavior - Money monthly spent on food at other stores
Consumer Behavior - Money monthly spent on eating out
Consumer Behavior - Money monthly spent on carryout/delivered foods
Consumer Behavior - Income spent on food at supermarket/grocery store (%)
Consumer Behavior - Income spent on food at other stores (%)
Consumer Behavior - Income spent on eating out (%)
Consumer Behavior - Income spent on carryout/delivered foods (%)
Current Health Status - General health condition (%)
Current Health Status - Blood donors (%)
Current Health Status - Has blood ever tested for HIV virus (%)
Current Health Status - Left-handed people (%)
Dermatology - People using sunscreen (%)
Diabetes - Diabetics (%)
Diabetes - Had a blood test for high blood sugar (%)
Diabetes - People taking insulin (%)
Diet Behavior & Nutrition - Diet health (%)
Diet Behavior & Nutrition - Milk product consumption (# of products/month)
Diet Behavior & Nutrition - Meals not home prepared (#/week)
Diet Behavior & Nutrition - Meals from fast food or pizza place (#/week)
Diet Behavior & Nutrition - Ready-to-eat foods (#/month)
Diet Behavior & Nutrition - Frozen meals/pizza (#/month)
Drug Use - People that ever used marijuana or hashish (%)
Drug Use - Ever used hard drugs (%)
Drug Use - Ever used any form of cocaine (%)
Drug Use - Ever used heroin (%)
Drug Use - Ever used methamphetamine (%)
Health Insurance - People covered by health insurance (%)
Kidney Conditions-Urology - Avg. # of times urinating at night
Medical Conditions - People with asthma (%)
Medical Conditions - People with anemia (%)
Medical Conditions - People with psoriasis (%)
Medical Conditions - People with overweight (%)
Medical Conditions - Elderly people having difficulties in thinking or remembering (%)
Medical Conditions - People who ever received blood transfusion (%)
Medical Conditions - People having trouble seeing even with glass/contacts (%)
Medical Conditions - People with arthritis (%)
Medical Conditions - People with gout (%)
Medical Conditions - People with congestive heart failure (%)
Medical Conditions - People with coronary heart disease (%)
Medical Conditions - People with angina pectoris (%)
Medical Conditions - People who ever had heart attack (%)
Medical Conditions - People who ever had stroke (%)
Medical Conditions - People with emphysema (%)
Medical Conditions - People with thyroid problem (%)
Medical Conditions - People with chronic bronchitis (%)
Medical Conditions - People with any liver condition (%)
Medical Conditions - People who ever had cancer or malignancy (%)
Mental Health - People who have little interest in doing things (%)
Mental Health - People feeling down, depressed, or hopeless (%)
Mental Health - People who have trouble sleeping or sleeping too much (%)
Mental Health - People feeling tired or having little energy (%)
Mental Health - People with poor appetite or overeating (%)
Mental Health - People feeling bad about themself (%)
Mental Health - People who have trouble concentrating on things (%)
Mental Health - People moving or speaking slowly or too fast (%)
Mental Health - People having thoughts they would be better off dead (%)
Oral Health - Average years since last visit a dentist
Oral Health - People embarrassed because of mouth (%)
Oral Health - People with gum disease (%)
Oral Health - General health of teeth and gums (%)
Oral Health - Average days a week using dental floss/device
Oral Health - Average days a week using mouthwash for dental problem
Oral Health - Average number of teeth
Pesticide Use - Households using pesticides to control insects (%)
Pesticide Use - Households using pesticides to kill weeds (%)
Physical Activity - People doing vigorous-intensity work activities (%)
Physical Activity - People doing moderate-intensity work activities (%)
Physical Activity - People walking or bicycling (%)
Physical Activity - People doing vigorous-intensity recreational activities (%)
Physical Activity - People doing moderate-intensity recreational activities (%)
Physical Activity - Average hours a day doing sedentary activities
Physical Activity - Average hours a day watching TV or videos
Physical Activity - Average hours a day using computer
Physical Functioning - People having limitations keeping them from working (%)
Physical Functioning - People limited in amount of work they can do (%)
Physical Functioning - People that need special equipment to walk (%)
Physical Functioning - People experiencing confusion/memory problems (%)
Physical Functioning - People requiring special healthcare equipment (%)
Prescription Medications - Average number of prescription medicines taking
Preventive Aspirin Use - Adults 40+ taking low-dose aspirin (%)
Reproductive Health - Vaginal deliveries (%)
Reproductive Health - Cesarean deliveries (%)
Reproductive Health - Deliveries resulted in a live birth (%)
Reproductive Health - Pregnancies resulted in a delivery (%)
Reproductive Health - Women breastfeeding newborns (%)
Reproductive Health - Women that had a hysterectomy (%)
Reproductive Health - Women that had both ovaries removed (%)
Reproductive Health - Women that have ever taken birth control pills (%)
Reproductive Health - Women taking birth control pills (%)
Reproductive Health - Women that have ever used Depo-Provera or injectables (%)
Reproductive Health - Women that have ever used female hormones (%)
Sexual Behavior - People 18+ that ever had sex (vaginal, anal, or oral) (%)
Sexual Behavior - Males 18+ that ever had vaginal sex with a woman (%)
Sexual Behavior - Males 18+ that ever performed oral sex on a woman (%)
Sexual Behavior - Males 18+ that ever had anal sex with a woman (%)
Sexual Behavior - Males 18+ that ever had any sex with a man (%)
Sexual Behavior - Females 18+ that ever had vaginal sex with a man (%)
Sexual Behavior - Females 18+ that ever performed oral sex on a man (%)
Sexual Behavior - Females 18+ that ever had anal sex with a man (%)
Sexual Behavior - Females 18+ that ever had any kind of sex with a woman (%)
Sexual Behavior - Average age people first had sex
Sexual Behavior - Average number of female sex partners in lifetime (males 18+)
Sexual Behavior - Average number of female vaginal sex partners in lifetime (males 18+)
Sexual Behavior - Average age people first performed oral sex on a woman (18+)
Sexual Behavior - Average number of woman performed oral sex on in lifetime (18+)
Sexual Behavior - Average number of male sex partners in lifetime (males 18+)
Sexual Behavior - Average number of male anal sex partners in lifetime (males 18+)
Sexual Behavior - Average age people first performed oral sex on a man (18+)
Sexual Behavior - Average number of male oral sex partners in lifetime (18+)
Sexual Behavior - People using protection when performing oral sex (%)
Sexual Behavior - Average number of times people have vaginal or anal sex a year
Sexual Behavior - People having sex without condom (%)
Sexual Behavior - Average number of male sex partners in lifetime (females 18+)
Sexual Behavior - Average number of male vaginal sex partners in lifetime (females 18+)
Sexual Behavior - Average number of female sex partners in lifetime (females 18+)
Sexual Behavior - Circumcised males 18+ (%)
Sleep Disorders - Average hours sleeping at night
Sleep Disorders - People that has trouble sleeping (%)
Smoking-Cigarette Use - People smoking cigarettes (%)
Taste & Smell - People 40+ having problems with smell (%)
Taste & Smell - People 40+ having problems with taste (%)
Taste & Smell - People 40+ that ever had wisdom teeth removed (%)
Taste & Smell - People 40+ that ever had tonsils teeth removed (%)
Taste & Smell - People 40+ that ever had a loss of consciousness because of a head injury (%)
Taste & Smell - People 40+ that ever had a broken nose or other serious injury to face or skull (%)
Taste & Smell - People 40+ that ever had two or more sinus infections (%)
Weight - Average height (inches)
Weight - Average weight (pounds)
Weight - Average BMI
Weight - People that are obese (%)
Weight - People that ever were obese (%)
Weight - People trying to lose weight (%)
Officers per 1,000 residents here:
1.81Connecticut average:
2.10
Latest news from New Milford, CT collected exclusively by city-data.com from local newspapers, TV, and radio stations
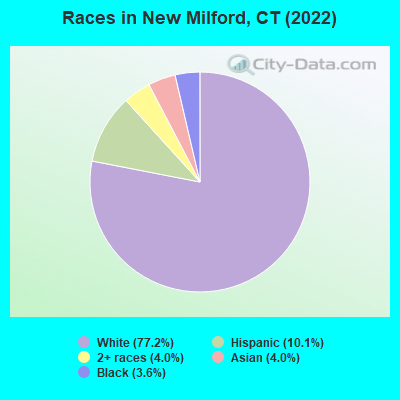
New Milford, CT City Guides: Ancestries: Italian (21.2%), English (9.4%), German (8.1%), Irish (6.0%), Brazilian (3.3%), American (3.1%).
Current Local Time:
Land area: 3.39 square miles.
Population density: 1,923 people per square mile (low).
666 residents are foreign born (3.8% Latin America , 2.2% Asia , 1.8% Europe ).
This place:
9.3%Connecticut:
15.0%
Median real estate property taxes paid for housing units with mortgages in 2022: $4,253 (1.4%)Median real estate property taxes paid for housing units with no mortgage in 2022: $4,490 (1.3%)
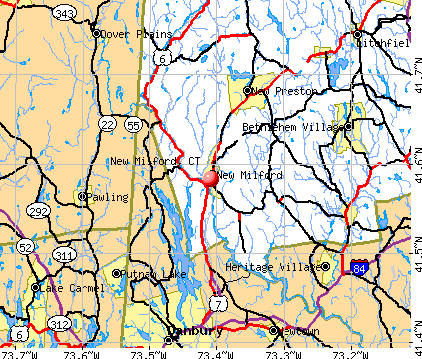
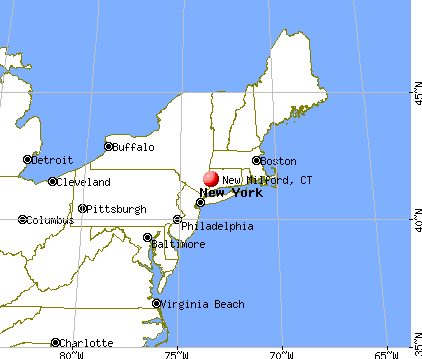
Nearest city with pop. 50,000+: Danbury, CT
Nearest city with pop. 200,000+: Bronx, NY
Nearest cities:
Latitude: 41.58 N, Longitude: 73.41 W
Daytime population change due to commuting: -381 (-5.3%)Workers who live and work in this place: 814 (21.3%)
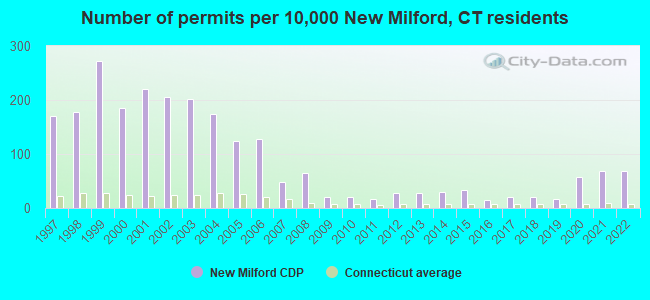
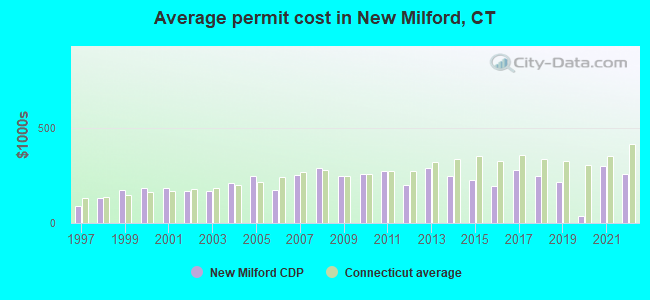
Single-family new house construction building permits:
2022: 45 buildings , average cost: $259,2002021: 45 buildings , average cost: $300,0002020: 38 buildings , average cost: $37,5002019: 11 buildings , average cost: $217,3002018: 14 buildings , average cost: $245,5002017: 13 buildings , average cost: $279,3002016: 10 buildings , average cost: $194,2002015: 22 buildings , average cost: $225,8002014: 20 buildings , average cost: $249,3002013: 18 buildings , average cost: $290,5002012: 18 buildings , average cost: $200,0002011: 11 buildings , average cost: $274,0002010: 14 buildings , average cost: $257,3002009: 14 buildings , average cost: $244,8002008: 43 buildings , average cost: $287,5002007: 32 buildings , average cost: $252,8002006: 84 buildings , average cost: $173,7002005: 83 buildings , average cost: $247,8002004: 116 buildings , average cost: $210,5002003: 134 buildings , average cost: $166,0002002: 136 buildings , average cost: $168,4002001: 146 buildings , average cost: $186,2002000: 123 buildings , average cost: $184,3001999: 181 buildings , average cost: $176,0001998: 118 buildings , average cost: $134,3001997: 113 buildings , average cost: $87,200Unemployment in December 2023: Here:
3.6%Connecticut:
3.9%
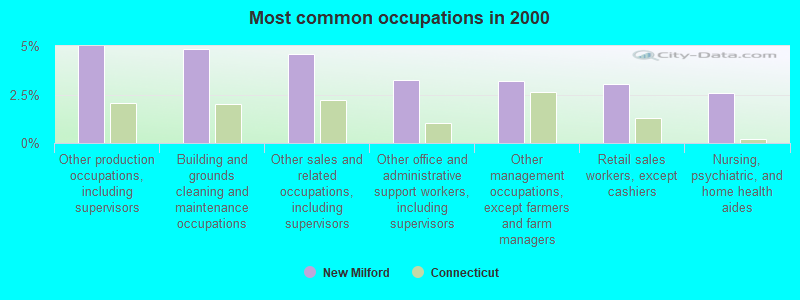
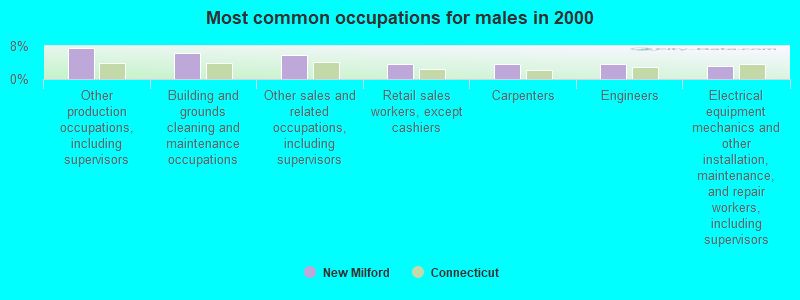
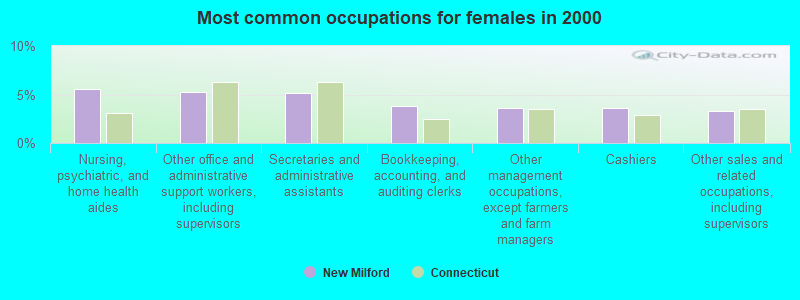
Most common occupations in New Milford, CT (%)
Both Males Females
Other production occupations, including supervisors (5.0%)
Building and grounds cleaning and maintenance occupations (4.9%)
Other sales and related occupations, including supervisors (4.6%)
Other office and administrative support workers, including supervisors (3.3%)
Other management occupations, except farmers and farm managers (3.2%)
Retail sales workers, except cashiers (3.1%)
Nursing, psychiatric, and home health aides (2.6%)
Other production occupations, including supervisors (7.5%)
Building and grounds cleaning and maintenance occupations (6.4%)
Other sales and related occupations, including supervisors (5.7%)
Retail sales workers, except cashiers (3.7%)
Carpenters (3.6%)
Engineers (3.6%)
Electrical equipment mechanics and other installation, maintenance, and repair workers, including supervisors (3.3%)
Nursing, psychiatric, and home health aides (5.6%)
Other office and administrative support workers, including supervisors (5.2%)
Secretaries and administrative assistants (5.2%)
Bookkeeping, accounting, and auditing clerks (3.9%)
Other management occupations, except farmers and farm managers (3.6%)
Cashiers (3.6%)
Other sales and related occupations, including supervisors (3.3%)
Tornado activity:
New Milford-area historical tornado activity is near Connecticut state average. It is 25% smaller than the overall U.S. average.
On 7/10/1989, a category F4 (max. wind speeds 207-260 mph) tornado 29.9 miles away from the New Milford place center injured 40 people and caused between $50,000,000 and $500,000,000 in damages.
On 5/24/1962, a category F3 (max. wind speeds 158-206 mph) tornado 15.1 miles away from the place center killed one person and injured 50 people and caused between $500,000 and $5,000,000 in damages.
Earthquake activity:
New Milford-area historical earthquake activity is significantly above Connecticut state average. It is 69% smaller than the overall U.S. average. On 10/7/1983 at 10:18:46, a magnitude 5.3 (5.1 MB, 5.3 LG, 5.1 ML, Class: Moderate, Intensity: VI - VII) earthquake occurred 170.7 miles away from the city center On 4/20/2002 at 10:50:47, a magnitude 5.3 (5.3 ML, Depth: 3.0 mi) earthquake occurred 203.2 miles away from New Milford center On 4/20/2002 at 10:50:47, a magnitude 5.2 (5.2 MB, 4.2 MS, 5.2 MW, 5.0 MW) earthquake occurred 201.5 miles away from New Milford center On 8/23/2011 at 17:51:04, a magnitude 5.8 (5.8 MW, Depth: 3.7 mi) earthquake occurred 349.9 miles away from the city center On 1/19/1982 at 00:14:42, a magnitude 4.7 (4.5 MB, 4.7 MD, 4.5 LG, Class: Light, Intensity: IV - V) earthquake occurred 161.5 miles away from New Milford center On 1/16/1994 at 01:49:16, a magnitude 4.6 (4.6 MB, 4.6 LG, Depth: 3.1 mi) earthquake occurred 162.3 miles away from the city center Magnitude types: regional Lg-wave magnitude (LG), body-wave magnitude (MB), duration magnitude (MD), local magnitude (ML), surface-wave magnitude (MS), moment magnitude (MW) Natural disasters: The number of natural disasters in Litchfield County (23) is greater than the US average (15).Major Disasters (Presidential) Declared: 13Emergencies Declared: 10Storms: 7, Hurricanes: 5, Floods: 4, Snowstorms: 4, Blizzards: 3, Snows: 2, Tropical Storms: 2, Winter Storms: 2, Snowfall: 1, Tornado: 1, Wind: 1 (Note: some incidents may be assigned to more than one category). Main business address for: NEWMIL BANCORP INC SAVINGS INSTITUTIONS, NOT FEDERALLY CHARTERED ).
Hospitals and medical centers in New Milford: ABILITY BEYOND DISABILITY GREE (14 GREENVIEW ROAD) ABILITY BEYOND DISABILITY LANE (54 LANESVILLE ROAD) NEW MILFORD HOSPITAL (Voluntary non-profit - Private, 21 ELM ST) NEW MILFORD VNA INC (68 PARK LANE RD)
CANDLEWOOD VALLEY HEALTH AND R (30 PARK LN EAST)
VILLAGE CREST CENTER FOR HEALTH AND REHABILITATION (19 POPLAR STREET)
Colleges/universities with over 2000 students nearest to New Milford:
Western Connecticut State University (about 13 miles; Danbury, CT ; Full-time enrollment: 5,345)
Post University (about 18 miles; Waterbury, CT ; FT enrollment: 5,808)
Naugatuck Valley Community College (about 18 miles; Waterbury, CT ; FT enrollment: 4,491)
University of Connecticut-Tri-Campus (about 20 miles; Waterbury, CT ; FT enrollment: 2,250)
Vassar College (about 27 miles; Poughkeepsie, NY ; FT enrollment: 2,469)
Sacred Heart University (about 27 miles; Fairfield, CT ; FT enrollment: 5,650)
Dutchess Community College (about 28 miles; Poughkeepsie, NY ; FT enrollment: 6,554)
Public high schools in New Milford: NEW MILFORD HIGH SCHOOL Students: 1,235, Location: 388 DANBURY ROAD, Grades: 9-12)LITCHFIELD HILLS TRANSITION CENTER Location: 94 RAILROAD ST., Grades: 12)
Private high schools in New Milford: CANTERBURY SCHOOL Students: 341, Location: 101 ASPETUCK AVE, Grades: 9-12)
FAITH PREP SCHOOL Students: 134, Location: 600 DANBURY RD STE 2, Grades: KG-12)
Public elementary/middle schools in New Milford: SARAH NOBLE INTERMEDIATE SCHOOL Students: 1,181, Location: 25 SUNNY VALLEY ROAD, Grades: 4-6)SCHAGHTICOKE MIDDLE SCHOOL Students: 763, Location: 23 HIPP ROAD, Grades: 7-8)JOHN PETTIBONE SCHOOL Students: 653, Location: 2 PICKETT DISTRICT ROAD, Grades: PK-3)NORTHVILLE ELEMENTARY SCHOOL Students: 646, Location: 22 HIPP ROAD, Grades: PK-3)HILL AND PLAIN SCHOOL Students: 612, Location: 60 OLD TOWN PARK ROAD, Grades: PK-3)See full list of schools located in New Milford Library in New Milford: NEW MILFORD PUBLIC LIBRARY Operating income: $1,141,591; Location: 24 MAIN ST.; 101,841 books ; 25 e-books ; 5,041 audio materials ; 5,449 video materials ; 12 local licensed databases ; 30 state licensed databases ; 224 print serial subscriptions ; 1 electronic serial subscriptions )
User-submitted facts and corrections:
As of fall 2000, a new High School was constructed and in use. The old high school building was changed to Sarah Noble Intermediate School for grades 4-6 and Schaghticoke Middle School became a school for only grades 7 and 8.
As of fall 2000, a new High School was constructed and in use. The old high school building was changed to Sarah Noble Intermediate School for grades 4-6 and Schaghticoke Middle School became a school for only grades 7 and 8.
Your population figures on my hometown are about 20,000 people too low. A more accurate figure could be found with the Chamber of Commerce at:
http://www.newmilford-chamber.com/towns/newmilford.htm
Notable locations in New Milford: (A) , New Milford Public Library (B) , New Milford Hospital Health Sciences Library (C) , New Milford Historical Society Museum (D) , New Milford Fire Marshal's Office (E) , Water Witch Hose Company 2 Grove Station (F) . Display/hide their locations on the map
Streams, rivers, and creeks: (A) . Display/hide its location on the map
Park in New Milford: (1) . Display/hide its location on the map
Tourist attractions:
Hotels:
Birthplace of: Elizabeth Bentley - Spy for the USSR, Elijah Boardman - Politician, Joseph J. Went - Assistant Commandant of the Marine Corps, Columbia Lancaster - Politician, Evan Scribner - Baseball player, Tom McGrath (artist) - Artist, Norman S. Hall - Prolific screenwriter.
Litchfield County has a predicted average indoor radon screening level between 2 and 4 pCi/L (pico curies per liter) - Moderate Potential Drinking water stations with addresses in New Milford and their reported violations in the past:
SUNNY VALLEY TAX DISTRICT (Population served: 534, Groundwater):
Past monitoring violations:
6 regular monitoring violations
Population served: 312, Groundwater):
Past health violations:
MCL, Monthly (TCR) - In JUL-2014, Contaminant: Coliform. Follow-up actions: St Public Notif requested (AUG-19-2014), St Violation/Reminder Notice (AUG-19-2014), St Public Notif received (SEP-16-2014)
Past monitoring violations:
Monitoring and Reporting (DBP) - Between JAN-2009 and MAR-2009, Contaminant: Chlorine. Follow-up actions: St Compliance achieved (MAY-14-2009), St Violation/Reminder Notice (JUN-29-2009)
One routine major monitoring violation
53 regular monitoring violations
Address: 2 Apple Lane Population served: 300, Groundwater):
Past health violations:
MCL, Monthly (TCR) - In OCT-2010, Contaminant: Coliform. Follow-up actions: St Public Notif requested (OCT-21-2010), St Violation/Reminder Notice (OCT-21-2010), St Public Notif received (OCT-29-2010), St Compliance achieved (NOV-30-2010)
Past monitoring violations:
One routine major monitoring violation
Population served: 285, Groundwater):
Past health violations:
MCL, Monthly (TCR) - In NOV-2012, Contaminant: Coliform. Follow-up actions: St Public Notif requested (DEC-14-2012), St Violation/Reminder Notice (DEC-14-2012), St Compliance achieved (DEC-31-2012), St Public Notif received (JAN-11-2013)
Past monitoring violations:
Monitoring, Source Water (GWR) - In NOV-26-2012, Contaminant: E. COLI. Follow-up actions: St Violation/Reminder Notice (APR-11-2013), St Public Notif requested (APR-11-2013)
Population served: 60, Groundwater):
Past health violations:
MCL, Monthly (TCR) - In AUG-2012, Contaminant: Coliform. Follow-up actions: St Public Notif requested (SEP-18-2012), St Violation/Reminder Notice (SEP-18-2012), St Compliance achieved (SEP-30-2012), St Public Notif received (OCT-11-2012)
MCL, Monthly (TCR) - In JUL-2012, Contaminant: Coliform. Follow-up actions: St Public Notif requested (AUG-15-2012), St Violation/Reminder Notice (AUG-15-2012), St Public Notif received (AUG-27-2012), St Compliance achieved (SEP-30-2012)
MCL, Monthly (TCR) - In AUG-2011, Contaminant: Coliform. Follow-up actions: St Public Notif received (SEP-01-2011), St Public Notif requested (SEP-13-2011), St Violation/Reminder Notice (SEP-13-2011), St Compliance achieved (SEP-30-2011)
MCL, Monthly (TCR) - In JUL-2011, Contaminant: Coliform. Follow-up actions: St Public Notif requested (AUG-10-2011), St Violation/Reminder Notice (AUG-10-2011), St Public Notif received (AUG-30-2011), St Compliance achieved (SEP-30-2011)
MCL, Monthly (TCR) - In APR-2011, Contaminant: Coliform. Follow-up actions: St Public Notif requested (APR-20-2011), St Violation/Reminder Notice (APR-20-2011), St Public Notif received (MAY-09-2011), St Compliance achieved (MAY-31-2011)
MCL, Monthly (TCR) - In JUL-2010, Contaminant: Coliform. Follow-up actions: St Public Notif requested (AUG-10-2010), St Violation/Reminder Notice (AUG-10-2010), St Public Notif received (AUG-31-2010), St Compliance achieved (SEP-30-2010)
4 other older health violations
Past monitoring violations:
2 routine major monitoring violations
9 regular monitoring violations
Drinking water stations with addresses in New Milford that have no violations reported:
CANDLEWOOD SHORES TAX DISTRICT (Address: 3 Fenway Drive Population served: 1,315, Primary Water Source Type: Groundwater)
CANDLEWOOD SPRINGS PROPERTY OWNERS ASSN (Population served: 148, Primary Water Source Type: Groundwater)
DODGE FARM (Population served: 42, Primary Water Source Type: Groundwater)
WIDOW BROWNS CAFE (Population served: 25, Primary Water Source Type: Groundwater)
Average household size: This place:
2.3 peopleConnecticut:
2.5 people
Percentage of family households: This place:
55.5%Whole state:
66.3%
Percentage of households with unmarried partners: This place:
9.0%Whole state:
6.6%
Likely homosexual households (counted as self-reported same-sex unmarried-partner households)
Lesbian couples: 0.5% of all households Gay men: 0.3% of all households
88 people in nursing facilities/skilled-nursing facilities in 2010people in other noninstitutional facilities in 2010People in group quarters in New Milford in 2000:
90 people in nursing homes
10 people in homes for the mentally retarded
8 people in other noninstitutional group quarters
4 people in homes for the mentally ill
Banks with branches in New Milford (2011 data):
Union Savings Bank: New Milford Branch, New Milford Branch, Candlewood Valley Mall Branch. Info updated 2011/11/30: Bank assets: $2,496.5 mil, Deposits: $1,625.1 mil, headquarters in Danbury, CT, positive income , Mortgage Lending Specialization, 29 total offices
Webster Bank, National Association: Lanesville Branch, Newmil Bank Branch, Boardman Terrace Branch. Info updated 2008/12/23: Bank assets: $18,674.3 mil, Deposits: $13,861.5 mil, headquarters in Waterbury, CT, positive income , Commercial Lending Specialization, 167 total offices , Holding Company: Webster Financial Corporation
Bank of America, National Association: New Milford Branch at 55 Main Street, branch established on 1975/04/14. Info updated 2009/11/18: Bank assets: $1,451,969.3 mil, Deposits: $1,077,176.8 mil, headquarters in Charlotte, NC, positive income , 5782 total offices , Holding Company: Bank Of America Corporation
People's United Bank: New Milford Stop And Shop Branch at 180 Danbury Road, branch established on 2002/02/14. Info updated 2012/02/16: Bank assets: $27,319.3 mil, Deposits: $20,835.4 mil, headquarters in Bridgeport, CT, positive income , Commercial Lending Specialization, 374 total offices
Savings Bank of Danbury: New Milford Branch at 5 Kent Road, branch established on 1995/10/25. Info updated 2006/11/03: Bank assets: $762.3 mil, Deposits: $611.3 mil, headquarters in Danbury, CT, positive income , Commercial Lending Specialization, 13 total offices
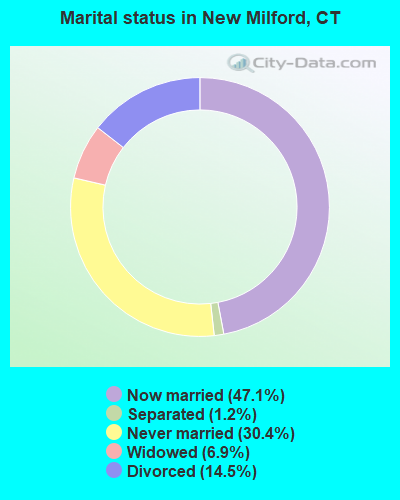
For population 15 years and over in New Milford:
Never married: 30.4%Now married: 47.1%Separated: 1.2%Widowed: 6.9%Divorced: 14.5% For population 25 years and over in New Milford:
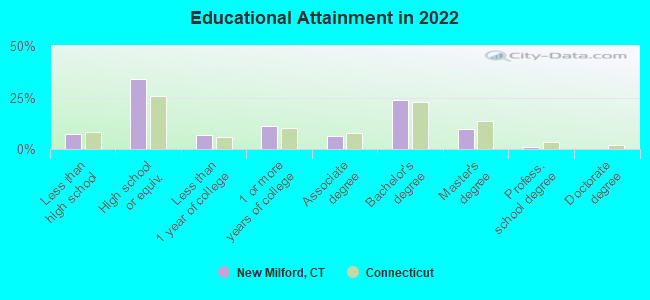
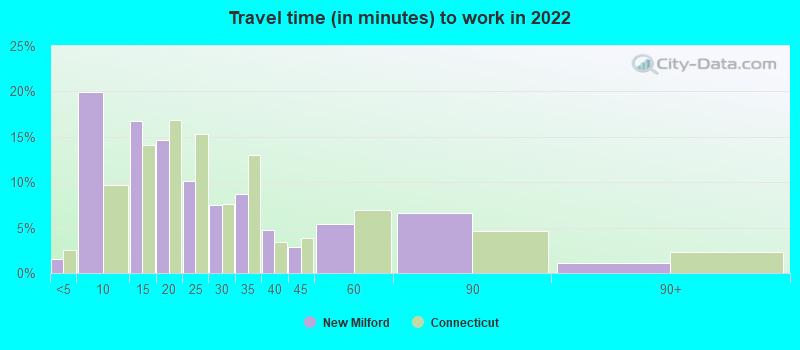
High school or higher: 92.2%Bachelor's degree or higher: 33.9%Graduate or professional degree: 10.4%Unemployed: 3.8%Mean travel time to work (commute): 23.7 minutes
Education Gini index (Inequality in education) Here:
9.4Connecticut average:
12.6
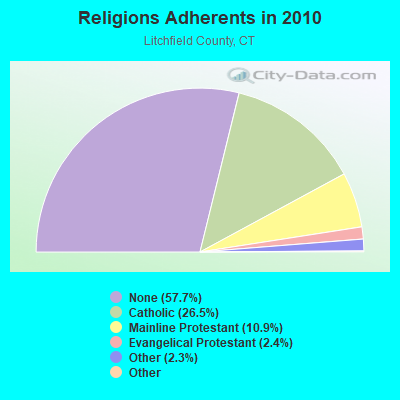
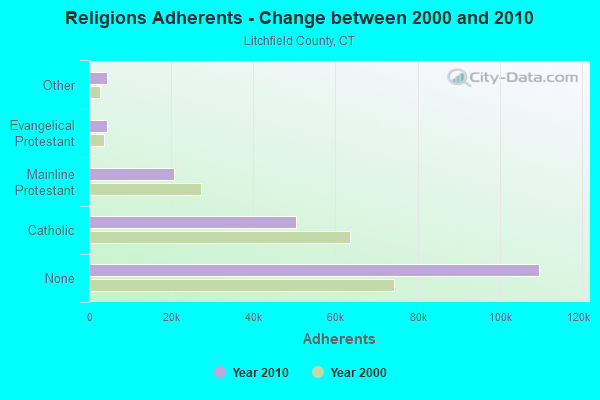
Religion statistics for New Milford, CT (based on Litchfield County data)
Religion Adherents Congregations Catholic 50,354 30 Mainline Protestant 20,681 87 Evangelical Protestant 4,483 39 Other 4,420 16 Orthodox 175 2 Black Protestant 160 2 None 109,654 -
Source: Clifford Grammich, Kirk Hadaway, Richard Houseal, Dale E.Jones, Alexei Krindatch, Richie Stanley and Richard H.Taylor. 2012. 2010 U.S.Religion Census: Religious Congregations & Membership Study. Association of Statisticians of American Religious Bodies. Jones, Dale E., et al. 2002. Congregations and Membership in the United States 2000. Nashville, TN: Glenmary Research Center. Graphs represent county-level data
Food Environment Statistics: Number of grocery stores : 43This county :
2.29 / 10,000 pop.State :
2.21 / 10,000 pop.
Number of supercenters and club stores : 1Litchfield County :
0.05 / 10,000 pop.State :
0.07 / 10,000 pop.
Number of convenience stores (no gas) : 12Litchfield County :
0.64 / 10,000 pop.Connecticut :
1.02 / 10,000 pop.
Number of convenience stores (with gas) : 56Litchfield County :
2.98 / 10,000 pop.Connecticut :
2.27 / 10,000 pop.
Number of full-service restaurants : 208Litchfield County :
11.07 / 10,000 pop.Connecticut :
9.19 / 10,000 pop.
Adult diabetes rate : Litchfield County :
6.9%State :
7.3%
Adult obesity rate : Litchfield County :
21.1%State :
21.5%
Low-income preschool obesity rate : Here :
11.8%Connecticut :
15.8%
Health and Nutrition: Healthy diet rate : New Milford:
50.8%Connecticut:
50.0%
Average overall health of teeth and gums : Average BMI : This city:
28.7Connecticut:
28.7
People feeling badly about themselves : New Milford:
21.1%Connecticut:
20.9%
People not drinking alcohol at all : New Milford:
9.4%Connecticut:
10.5%
Average hours sleeping at night : New Milford:
6.8Connecticut:
6.8
Overweight people : This city:
34.8%State:
34.2%
General health condition : New Milford:
58.5%Connecticut:
56.4%
Average condition of hearing : New Milford:
80.4%Connecticut:
78.9%
More about Health and Nutrition of New Milford, CT Residents
Businesses in New Milford, CT
Name Count Name Count
AT&T 1 RadioShack 1 Advance Auto Parts 1 Rite Aid 1 Arby's 1 Sears 1 Blockbuster 1 Staples 1 CVS 1 Starbucks 1 Curves 1 Stop & Shop 1 Dunkin Donuts 3 Subway 3 FedEx 4 T-Mobile 1 GameStop 1 T.J.Maxx 1 H&R Block 1 Taco Bell 1 Home Depot 1 True Value 2 MasterBrand Cabinets 1 U-Haul 1 McDonald's 1 UPS 4 Nike 2 Volkswagen 1 Penske 1 Walmart 1
Strongest AM radio stations in New Milford:
WTIC (1080 AM; 50 kW; HARTFORD, CT; Owner: INFINITY RADIO OPERATIONS INC.)
WNNZ (640 AM; 50 kW; WESTFIELD, MA; Owner: CLEAR CHANNEL BROADCASTING LICENSES, INC.)
WFAN (660 AM; 50 kW; NEW YORK, NY; Owner: INFINITY BROADCASTING OPERATIONS, INC.)
WCBS (880 AM; 50 kW; NEW YORK, NY; Owner: INFINITY BROADCASTING OPERATIONS, INC.)
WINE (940 AM; 1 kW; BROOKFIELD, CT; Owner: CUMULUS LICENSING CORP.)
WABC (770 AM; 50 kW; NEW YORK, NY; Owner: WABC-AM RADIO, INC.)
WMCA (570 AM; 50 kW; NEW YORK, NY; Owner: SALEM MEDIA OF NEW YORK, LLC)
WOR (710 AM; 50 kW; NEW YORK, NY; Owner: BUCKLEY BROADCASTING CORPORATION)
WGSM (740 AM; 25 kW; HUNTINGTON, NY; Owner: K RADIO LICENSEE, INC.)
WEPN (1050 AM; 50 kW; NEW YORK, NY; Owner: NEW YORK AM RADIO, LLC)
WINS (1010 AM; 50 kW; NEW YORK, NY; Owner: INFINITY BROADCASTING OPERATIONS, INC.)
WBBR (1130 AM; 50 kW; NEW YORK, NY; Owner: BLOOMBERG COMMUNICATIONS INC.)
WFNW (1380 AM; 5 kW; NAUGATUCK, CT; Owner: CANDIDO DIAS CARRELO)
Strongest FM radio stations in New Milford:
WRKI (95.1 FM; BROOKFIELD, CT; Owner: CUMULUS LICENSING CORP.)
W206AW (89.1 FM; PAWLING, NY; Owner: SOUND OF LIFE, INC.)
W218AV (91.5 FM; WARREN, CT; Owner: MONROE BOARD OF EDUCATION)
WDBY (105.5 FM; PATTERSON, NY; Owner: CUMULUS LICENSING CORP.)
WRNQ (92.1 FM; POUGHKEEPSIE, NY; Owner: CLEAR CHANNEL BROADCASTING LICENSES, INC.)
WDAQ (98.3 FM; DANBURY, CT; Owner: BERKSHIRE BROADCASTING CORP.)
WPDH (101.5 FM; POUGHKEEPSIE, NY; Owner: CUMULUS LICENSING CORP.)
WSPK (104.7 FM; POUGHKEEPSIE, NY; Owner: 6 JOHNSON ROAD LICENSES, INC.)
WQQQ (103.3 FM; SHARON, CT; Owner: THE RIDGEFIELD BROADCASTING CORPORATION)
WKCI-FM (101.3 FM; HAMDEN, CT; Owner: CLEAR CHANNEL BROADCASTING LICENSES, INC.)
WRCH (100.5 FM; NEW BRITAIN, CT; Owner: INFINITY RADIO OPERATIONS INC.)
WFNP (88.7 FM; ROSENDALE, NY; Owner: STATE UNIVERSITY OF NEW YORK)
WRHV (88.7 FM; POUGHKEEPSIE, NY; Owner: WMHT EDUCATIONAL TELECOMMUNICATIONS)
WPLR (99.1 FM; NEW HAVEN, CT; Owner: COX RADIO, INC.)
WCZX (97.7 FM; HYDE PARK, NY; Owner: CUMULUS LICENSING CORP.)
WRRB (96.9 FM; ARLINGTON, NY; Owner: CUMULUS LICENSING CORP.)
WWYZ (92.5 FM; WATERBURY, CT; Owner: CAPSTAR TX LIMITED PARTNERSHIP)
WKSS (95.7 FM; HARTFORD-MERIDEN, CT; Owner: CAPSTAR TX LIMITED PARTNERSHIP)
WEZN-FM (99.9 FM; BRIDGEPORT, CT; Owner: CXR HOLDINGS, INC.)
WZMX (93.7 FM; HARTFORD, CT; Owner: INFINITY RADIO OPERATIONS INC.)
TV broadcast stations around New Milford:
WTIC-TV (Channel 61; HARTFORD, CT; Owner: TRIBUNE TELEVISION COMPANY)
W11BJ (Channel 11; HARTFORD, CT; Owner: COMMUNICATIONS SITE MANAGEMENT LLC)
WTXX (Channel 20; WATERBURY, CT; Owner: WTXX INC.)
WTNH (Channel 8; NEW HAVEN, CT; Owner: WTNH BROADCASTING, INC.)
WVIT (Channel 30; NEW BRITAIN, CT; Owner: OUTLET BROADCASTING, INC)
WEDH (Channel 24; HARTFORD, CT; Owner: CONNECTICUT PUBLIC BROADCASTING, INC.)
WUVN (Channel 18; HARTFORD, CT; Owner: ENTRAVISION HOLDINGS, LLC)
WCTX (Channel 59; NEW HAVEN, CT; Owner: WTNH BROADCASTING, INC.)
WEDY (Channel 65; NEW HAVEN, CT; Owner: CONNECTICUT PUBLIC BROADCASTING, INC.)
WTBY (Channel 54; POUGHKEEPSIE, NY; Owner: TRINITY BROADCASTING OF NEW YORK, INC.)
WEDW (Channel 49; BRIDGEPORT, CT; Owner: CONNECTICUT PUBLIC BROADCASTING, INC.)
WSAH (Channel 43; BRIDGEPORT, CT; Owner: WSAH LICENSE, INC.)
W12BH (Channel 12; WATERBURY, CT; Owner: CONN.PUBLIC BROADCASTING, INC.)
W22BN (Channel 22; DANBURY, CT; Owner: it COMMUNICATIONS, INC.)
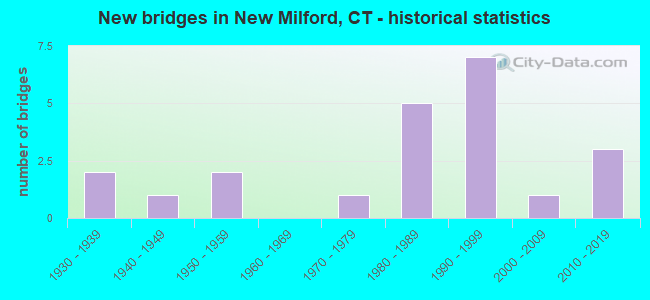
National Bridge Inventory (NBI) Statistics 22 Number of bridges197ft / 59.6m Total length $6,302,000 Total costs134,712 Total average daily traffic6,892 Total average daily truck traffic200,169 Total future (year 2035) average daily traffic
New bridges - historical statistics
2 1930-1939 1 1940-1949 2 1950-1959 1 1970-1979 5 1980-1989 7 1990-1999 1 2000-2009 3 2010-2019
See full National Bridge Inventory statistics for New Milford, CT
FCC Registered Cell Phone Towers: 2 (
See the full list of FCC Registered Cell Phone Towers in New Milford )
FCC Registered Antenna Towers: 14 (
See the full list of FCC Registered Antenna Towers )
FCC Registered Private Land Mobile Towers: 3 (
See the full list of FCC Registered Private Land Mobile Towers in New Milford, CT )
FCC Registered Broadcast Land Mobile Towers: 37 (
See the full list of FCC Registered Broadcast Land Mobile Towers )
FCC Registered Microwave Towers: 2
NEW MILFORD, Chapin Rd (Lat: 41.605917 Lon: -73.367472), Type: Ltower, Structure height: 74.7 m, Overall height: 81.4 m, Call Sign: WPNB735, Assigned Frequencies: 6835.00 MHz, 6585.00 MHz, 6345.49 MHz, 6375.14 MHz, Grant Date: 09/11/2021, Expiration Date: 12/03/2031, Registrant: State Of Connecticut, 1111 Country Club Rd, Middletown, CT 06457, Phone: (860) 685-8080, Fax: (860) 685-8362, Email:
NEW MILFORD, 26 Chapin Rd (Lat: 41.605222 Lon: -73.367028), Type: Ltower, Structure height: 75.3 m, Overall height: 81.1 m, Call Sign: WBD387, Assigned Frequencies: 6256.54 MHz, 6197.24 MHz, 6404.79 MHz, 6755.00 MHz, 6725.00 MHz, 6815.00 MHz, 6315.84 MHz, 6286.19 MHz, Grant Date: 02/03/2018, Expiration Date: 03/18/2028, Registrant: Micronet Communications, Inc., 812 Lexington Dr, Plano, TX 75075, Phone: (972) 422-7200, Email:
FCC Registered Paging Towers: 1
Hartwell Road (Lat: 41.593972 Lon: -73.374000), Overall height: 45.7 m, Call Sign: KNKM897, Assigned Frequencies: 931.887 MHz, Grant Date: 05/11/1999, Expiration Date: 04/01/2009, Cancellation Date: 01/13/2005, Certifier: Paul H Kuzia, Registrant: Venable, LLP, 575 7th Street, Nw, Washington, DC 20004, Phone: (202) 344-4000, Fax: (202) 344-8300, Email:
FCC Registered Amateur Radio Licenses: 128 (
See the full list of FCC Registered Amateur Radio Licenses in New Milford )
FAA Registered Aircraft Manufacturers and Dealers: 1 (
See the full list of FAA Registered Manufacturers and Dealers in New Milford )
FAA Registered Aircraft: 15 (
See the full list of FAA Registered Aircraft )
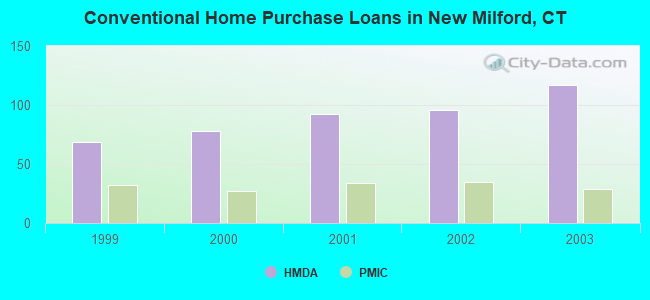
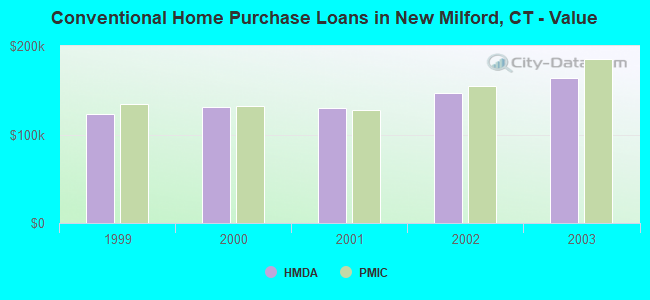
Home Mortgage Disclosure Act Aggregated Statistics For Year 2003(Based on 1 full tract) A) FHA, FSA/RHS & VA B) Conventional C) Refinancings D) Home Improvement Loans F) Non-occupant Loans on Number Average Value Number Average Value Number Average Value Number Average Value Number Average Value
LOANS ORIGINATED 4 $101,250 117 $164,214 260 $150,827 3 $22,333 27 $106,741 APPLICATIONS APPROVED, NOT ACCEPTED 0 $0 17 $221,941 34 $146,206 3 $25,333 2 $291,500 APPLICATIONS DENIED 1 $63,000 25 $99,720 106 $141,670 8 $38,125 6 $92,833 APPLICATIONS WITHDRAWN 0 $0 16 $168,312 44 $173,455 2 $62,500 0 $0 FILES CLOSED FOR INCOMPLETENESS 0 $0 0 $0 6 $137,667 0 $0 1 $60,000
Aggregated Statistics For Year 2002(Based on 1 full tract) A) FHA, FSA/RHS & VA B) Conventional C) Refinancings D) Home Improvement Loans F) Non-occupant Loans on Number Average Value Number Average Value Number Average Value Number Average Value Number Average Value
LOANS ORIGINATED 11 $121,455 96 $147,083 197 $131,766 16 $33,688 25 $104,560 APPLICATIONS APPROVED, NOT ACCEPTED 1 $180,000 5 $147,600 40 $126,125 3 $20,000 0 $0 APPLICATIONS DENIED 1 $24,000 12 $78,750 55 $108,109 13 $27,462 3 $89,667 APPLICATIONS WITHDRAWN 2 $66,500 16 $138,562 40 $112,325 5 $21,800 3 $92,667 FILES CLOSED FOR INCOMPLETENESS 1 $107,000 3 $159,333 29 $148,759 2 $38,500 2 $280,000
Aggregated Statistics For Year 2001(Based on 1 full tract) A) FHA, FSA/RHS & VA B) Conventional C) Refinancings D) Home Improvement Loans F) Non-occupant Loans on Number Average Value Number Average Value Number Average Value Number Average Value Number Average Value
LOANS ORIGINATED 14 $117,000 92 $129,946 132 $125,826 13 $19,077 12 $104,667 APPLICATIONS APPROVED, NOT ACCEPTED 1 $144,000 9 $139,333 27 $126,556 3 $38,333 4 $108,000 APPLICATIONS DENIED 2 $157,000 15 $106,733 60 $106,900 5 $12,600 8 $74,375 APPLICATIONS WITHDRAWN 1 $80,000 5 $119,800 28 $98,429 3 $38,333 0 $0 FILES CLOSED FOR INCOMPLETENESS 0 $0 2 $59,500 5 $105,000 1 $18,000 1 $68,000
Aggregated Statistics For Year 2000(Based on 1 full tract) A) FHA, FSA/RHS & VA B) Conventional C) Refinancings D) Home Improvement Loans F) Non-occupant Loans on Number Average Value Number Average Value Number Average Value Number Average Value Number Average Value
LOANS ORIGINATED 15 $90,333 78 $131,218 27 $100,926 5 $17,600 5 $82,200 APPLICATIONS APPROVED, NOT ACCEPTED 1 $194,000 15 $119,533 12 $89,333 4 $18,500 1 $104,000 APPLICATIONS DENIED 4 $143,000 36 $108,500 15 $62,067 4 $61,750 1 $160,000 APPLICATIONS WITHDRAWN 0 $0 8 $141,375 18 $74,000 2 $150,000 3 $132,667 FILES CLOSED FOR INCOMPLETENESS 0 $0 2 $167,000 6 $111,167 0 $0 0 $0
Aggregated Statistics For Year 1999(Based on 1 full tract) A) FHA, FSA/RHS & VA B) Conventional C) Refinancings D) Home Improvement Loans F) Non-occupant Loans on Number Average Value Number Average Value Number Average Value Number Average Value Number Average Value
LOANS ORIGINATED 23 $115,085 69 $123,200 68 $94,348 11 $21,585 12 $129,792 APPLICATIONS APPROVED, NOT ACCEPTED 1 $146,570 5 $130,736 13 $84,782 5 $27,946 2 $52,765 APPLICATIONS DENIED 1 $64,490 20 $89,112 19 $59,397 10 $19,347 3 $44,620 APPLICATIONS WITHDRAWN 4 $67,420 8 $157,801 28 $98,548 1 $68,400 0 $0 FILES CLOSED FOR INCOMPLETENESS 0 $0 1 $75,240 5 $69,374 0 $0 0 $0
Detailed HMDA statistics for the following Tracts:
2531.00
Private Mortgage Insurance Companies Aggregated Statistics For Year 2003(Based on 1 full tract) A) Conventional B) Refinancings C) Non-occupant Loans on Number Average Value Number Average Value Number Average Value
LOANS ORIGINATED 29 $184,862 10 $187,600 2 $91,500 APPLICATIONS APPROVED, NOT ACCEPTED 4 $137,250 5 $188,800 0 $0 APPLICATIONS DENIED 0 $0 0 $0 0 $0 APPLICATIONS WITHDRAWN 0 $0 0 $0 0 $0 FILES CLOSED FOR INCOMPLETENESS 0 $0 0 $0 0 $0
Aggregated Statistics For Year 2002(Based on 1 full tract) A) Conventional B) Refinancings C) Non-occupant Loans on Number Average Value Number Average Value Number Average Value
LOANS ORIGINATED 35 $154,914 15 $149,867 3 $170,000 APPLICATIONS APPROVED, NOT ACCEPTED 7 $129,000 8 $109,125 0 $0 APPLICATIONS DENIED 0 $0 0 $0 0 $0 APPLICATIONS WITHDRAWN 2 $146,500 3 $185,667 0 $0 FILES CLOSED FOR INCOMPLETENESS 0 $0 0 $0 0 $0
Aggregated Statistics For Year 2001(Based on 1 full tract) A) Conventional B) Refinancings C) Non-occupant Loans on Number Average Value Number Average Value Number Average Value
LOANS ORIGINATED 34 $127,353 14 $150,214 4 $100,750 APPLICATIONS APPROVED, NOT ACCEPTED 4 $67,250 4 $133,500 0 $0 APPLICATIONS DENIED 2 $208,500 2 $174,500 2 $164,500 APPLICATIONS WITHDRAWN 2 $87,000 1 $155,000 1 $139,000 FILES CLOSED FOR INCOMPLETENESS 0 $0 0 $0 0 $0
Aggregated Statistics For Year 2000(Based on 1 full tract) A) Conventional B) Refinancings Number Average Value Number Average Value
LOANS ORIGINATED 27 $132,296 1 $136,000 APPLICATIONS APPROVED, NOT ACCEPTED 3 $175,667 0 $0 APPLICATIONS DENIED 8 $106,250 0 $0 APPLICATIONS WITHDRAWN 2 $126,500 0 $0 FILES CLOSED FOR INCOMPLETENESS 0 $0 0 $0
Aggregated Statistics For Year 1999(Based on 1 full tract) A) Conventional B) Refinancings C) Non-occupant Loans on Number Average Value Number Average Value Number Average Value
LOANS ORIGINATED 32 $134,718 10 $131,322 1 $43,970 APPLICATIONS APPROVED, NOT ACCEPTED 1 $70,350 1 $103,570 0 $0 APPLICATIONS DENIED 3 $58,300 1 $157,310 0 $0 APPLICATIONS WITHDRAWN 0 $0 1 $180,760 0 $0 FILES CLOSED FOR INCOMPLETENESS 0 $0 0 $0 0 $0
Detailed PMIC statistics for the following Tracts:
2531.00
New Milford compared to Connecticut state average:
Unemployed percentage significantly below state average. Black race population percentage below state average. Length of stay since moving in significantly above state average. New Milford on our top lists :
#38 on the list of "Top 101 cities with largest percentage of females in industries: management of companies and enterprises (population 5,000+)"
#53 on the list of "Top 101 cities with the most residents born in Ecuador (population 500+)"
#56 on the list of "Top 101 cities with largest percentage of females in industries: information (population 5,000+)"
#7 on the list of "Top 101 counties with the lowest Particulate Matter (PM10 ) Annual air pollution readings in 2012 (µg/m3 )"
#10 on the list of "Top 101 counties with the lowest number of births per 1000 residents 2007-2013"
#21 on the list of "Top 101 counties with the largest decrease in the number of births per 1000 residents 2000-2006 to 2007-2013 (pop 50,000+)"
#38 on the list of "Top 101 counties with the lowest Particulate Matter (PM2.5 ) Annual air pollution readings in 2012 (µg/m3 )"
#39 on the list of "Top 101 counties with the highest carbon monoxide air pollution readings in 2012 (ppm)"
Top Patent Applicants
Chongying Xu (64)
Renee M. Zindell (26)
Lifen Wu (22)
Edward A. Sturm (20)
Boris Rozenfeld (18)
Michael J. Wodjenski (18)
Todd Bosanac (18)
Russell Pribanic (17)
Joseph D. Sweeney (16)
Richard S. Ray (15)
Total of 689 patent applications in 2008-2024.


 Recent articles from our blog. Our writers, many of them Ph.D. graduates or candidates, create easy-to-read articles on a wide variety of topics.


 (12.7 miles
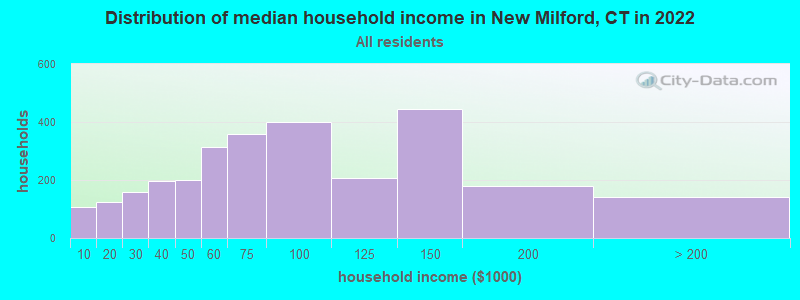

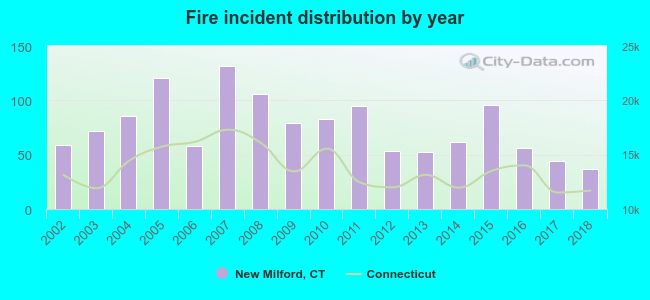 Based on the data from the years 2002 - 2018 the average number of fire incidents per year is 76. The highest number of reported fires - 132 took place in 2007, and the least - 37 in 2018. The data has a dropping trend.
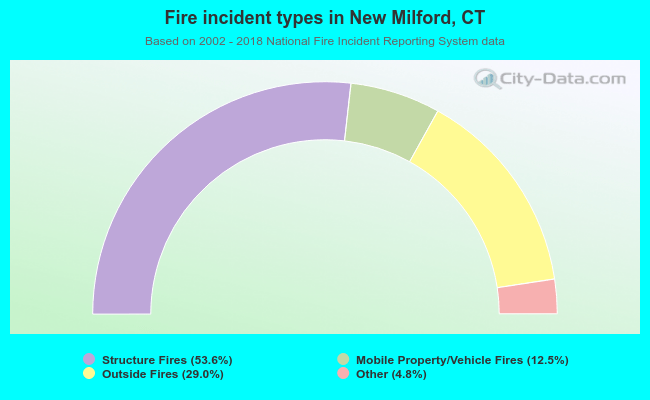 When looking into fire subcategories, the most reports belonged to: Structure Fires (53.6%), and Outside Fires (29.0%).