Races in Palatka, Florida (FL) Detailed Stats
Ancestries, Foreign-born residents, place of birth
Settings
X


Recent posts about races in Palatka, Florida on our local forum with over 2,400,000 registered users:
 | Parts of Florida that are still relatively affordable (22 replies) |
| Average HOA Fees in Jacksonville (7 replies) |
| Is there a safe area near the ocean that I can afford on 42K (22 replies) |
| Insight on prejudice in Palatka? (5 replies) |
| Asking about Interlachen (1 reply) |
| North or Central Florida Relocating Advice (10 replies) |
Latest news about races in Palatka, FL collected exclusively by city-data.com from local newspapers, TV, and radio stations
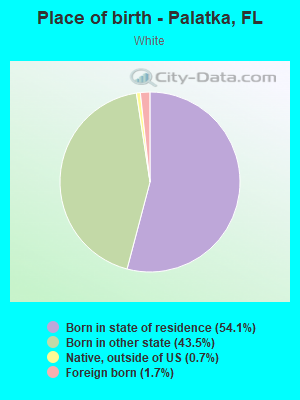
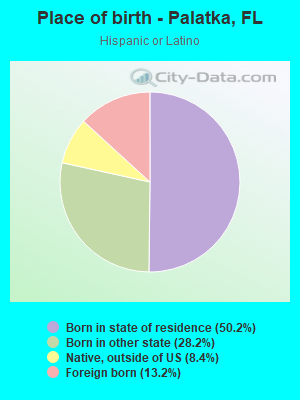
According to 2022 data, the most numerous races in Palatka, FL are White alone (5,074 residents), Hispanic (833 residents), and Black alone (4,191 residents). 93.6% of Palatka residents speak English at home. 4.4% of Palatka, FL residents are foreign-born (1.6% born in Latin America, 1.1% born in Europe, 1.1% born in Asia), which is 374.0% less than the foreign-born rate of 21.0% across the entire state of Florida.
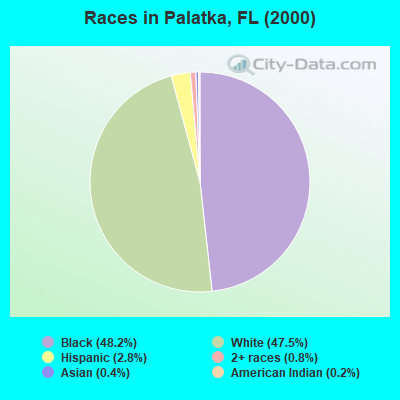
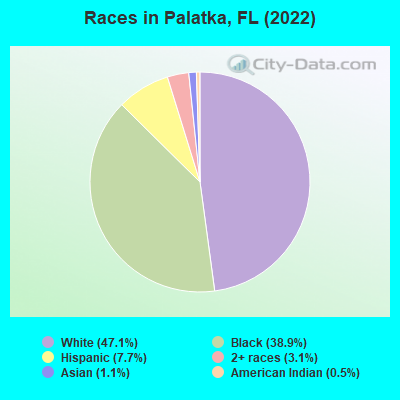
Race distribution in Palatka
2000
2022

- 4,84048.2%Black alone
- 4,76247.5%White alone
- 2842.8%Hispanic
- 830.8%Two or more races
- 440.4%Asian alone
- 160.2%American Indian alone
- 30.03%Other race alone
- 10.01%Native Hawaiian and Other
Pacific Islander alone
-
- 5,07447.1%White alone
- 4,19138.9%Black alone
- 8337.7%Hispanic
- 3313.1%Two or more races
- 1231.1%Asian alone
- 580.5%American Indian alone
- 90.08%Other race alone
2000
2022
-
- 10,458,50965.4%White alone
- 2,682,71516.8%Hispanic
- 2,264,26814.2%Black alone
- 261,6931.6%Asian alone
- 236,9541.5%Two or more races
- 42,3580.3%American Indian alone
- 28,9940.2%Other race alone
- 6,8870.04%Native Hawaiian and Other
Pacific Islander alone

-
- 11,309,40350.8%White alone
- 6,025,03927.1%Hispanic
- 3,241,01514.6%Black alone
- 861,6303.9%Two or more races
- 623,6922.8%Asian alone
- 152,0540.7%Other race alone
- 22,5040.1%American Indian alone
- 9,4860.04%Native Hawaiian and Other
Pacific Islander alone

Income and house value in Palatka
- Median household income in 2022
- $40,069White non-Hispanic householders
- $23,436Black householders
- $130,102Two or more races householders
- $122,329Hispanic or Latino race householders
- Median 2022 house value
- $126,235White Non-Hispanic householders
- $97,637Black or African American householders
- $203,988Asian householders
- $307,211Native Hawaiian and other Pacific Islander householders
- $160,643Some other race householders
- $171,814Hispanic or Latino householders
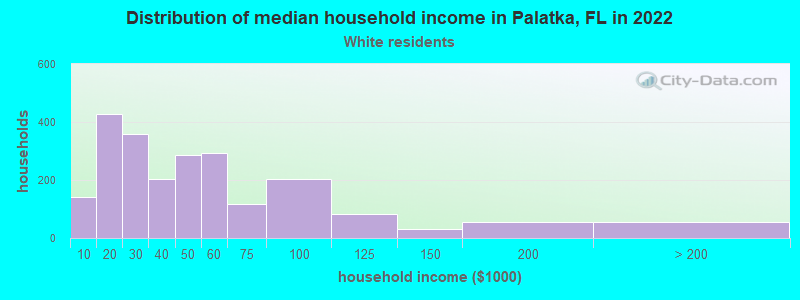
Household income for White non-Hispanic householders
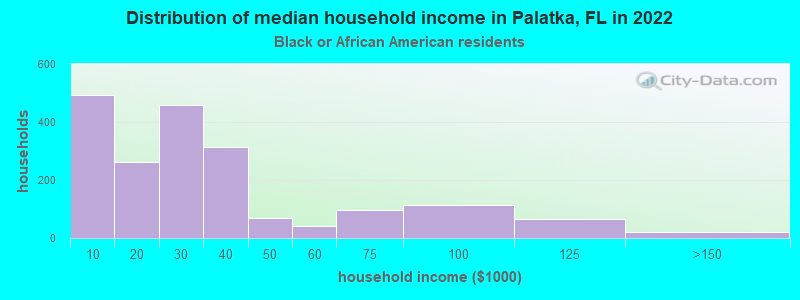
Household income for Black householders
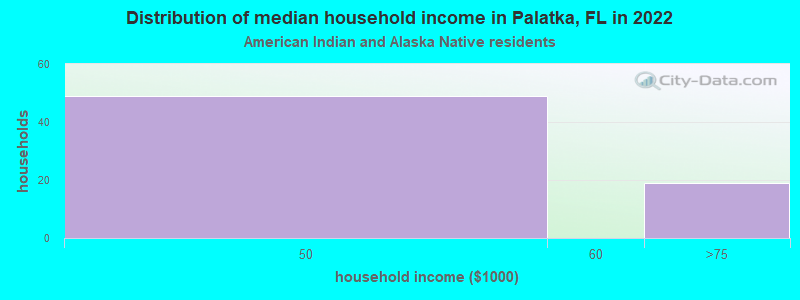
Household income for American Indian and Alaska Native householders
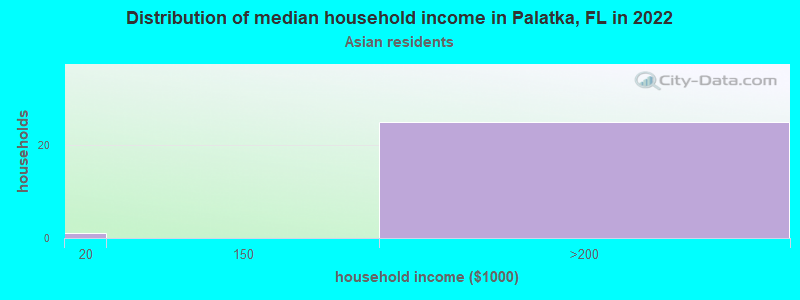
Household income for Asian householders
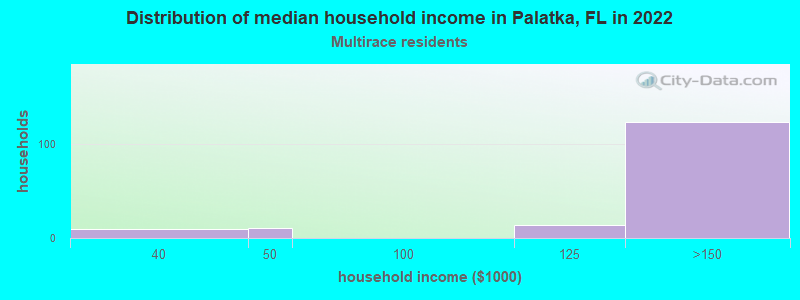
Household income for Two or more races householders
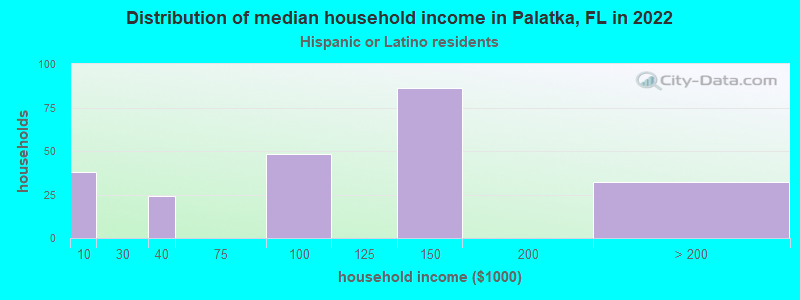
Household income for Hispanic or Latino race householders
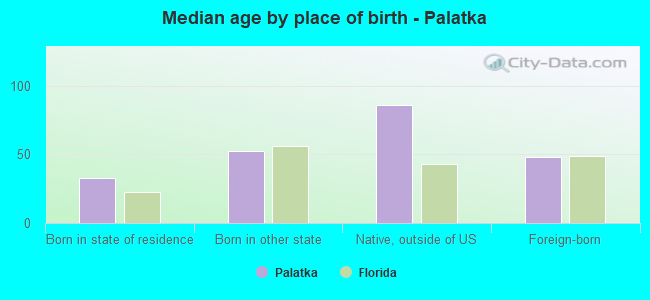
Median age by race in Palatka
- 41.8Median age for White residents
- 33.5Males
- 52.8Females
- 38.8Median age for Black or African American residents
- 48.6Males
- 35.5Females
- 37.4Median age for American Indian / Alaska Native residents
- -611,418,047.3Males
- -594,925,633.7Females
- 23.9Median age for Asian residents
- -545,601,290.8Males
- 21.3Females
- -666,666,666.0Median age for Native Hawaiian / Pacific Islander residents
- -666,666,666.0Males
- -666,666,666.0Females
- 27.1Median age for Other race residents
- 27.1Males
- -685,185,184.5Females
- 33.3Median age for Two or more races residents
- 33.1Males
- 27.4Females
- 42.3Median age for White alone residents
- 34.9Males
- 52.1Females
- 26.5Median age for Hispanic or Latino residents
- 26.8Males
- 25.3Females
Owner/renter occupied households by race in Palatka
- House owners and renters - White residents
- 1,43568.0%Owner occupied
- 67532.0%Renter occupied
- House owners and renters - Black or African American residents
- 86041.7%Owner occupied
- 1,20258.3%Renter occupied
- House owners and renters - American Indian / Alaska Native residents
- 59100.0%Renter occupied
- House owners and renters - Asian residents
- 2295.5%Owner occupied
- 14.5%Renter occupied
- House owners and renters - Two or more races residents
- 21097.9%Owner occupied
- 42.1%Renter occupied
- House owners and renters - White alone residents
- 1,40567.0%Owner occupied
- 69333.0%Renter occupied
- House owners and renters - Hispanic or Latino residents
- 20272.8%Owner occupied
- 7627.2%Renter occupied
Language usage in Palatka
- English speakers - Total
- 93.6% of residents of Palatka speak English at home.
- 4.6% of residents speak Spanish at home
- 25656.4%Speak English very well
- 19843.6%Speak English less than very well
- 1.5% of residents speak other language at home
- 7047.9%Speak English very well
- 7652.1%Speak English less than very well
- English speakers - Born in the United States
- 95.2% of residents of Palatka speak English at home.
- 4.8% of residents speak Spanish at home
- 9667.1%Speak English very well
- 4732.9%Speak English less than very well
- English speakers - Native, born elsewhere
- 25.8% of residents of Palatka speak English at home.
- 71.1% of residents speak Spanish at home
- 4058.0%Speak English very well
- 2942.0%Speak English less than very well
- English speakers - Foreign-born
- 39.1% of residents of Palatka speak English at home.
- 32.3% of residents speak Spanish at home
- 3422.4%Speak English very well
- 11877.6%Speak English less than very well
- 28.2% of residents speak other language at home
- 7052.6%Speak English very well
- 6347.4%Speak English less than very well
White (Caucasian) - Speak only English
| Native: | 100.0% (4,560) |
| Foreign-born: | 100.0% (104) |
White (Caucasian) - Speak another language
| Native: | 1.3% (58) |
| Foreign-born: | 19.7% (21) |
Black or African American - Speak only English
| Native: | 99.1% (3,835) |
| Foreign-born: | 97.0% (37) |
Asian - Speak only English
| Native: | 100.0% (5) |
| Foreign-born: | 1.7% (2) |
Two or more races - Speak another language
| Native: | 43.9% (296) |
| Foreign-born: | 100.0% (173) |
White alone - Speak only English
| Native: | 99.2% (4,583) |
| Foreign-born: | 93.8% (142) |
White alone - Speak another language
| Native: | 0.9% (42) |
| Foreign-born: | 9.0% (14) |
Hispanic or Latino - Speak another language
| Native: | 42.3% (256) |
| Foreign-born: | 100.0% (114) |
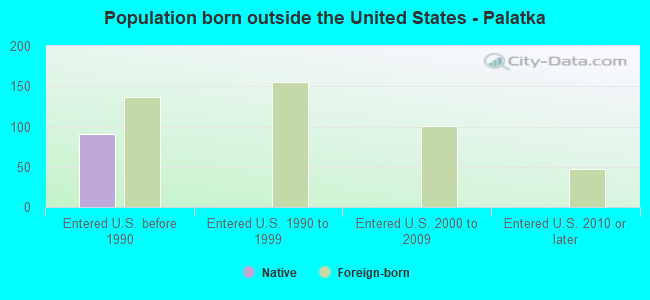
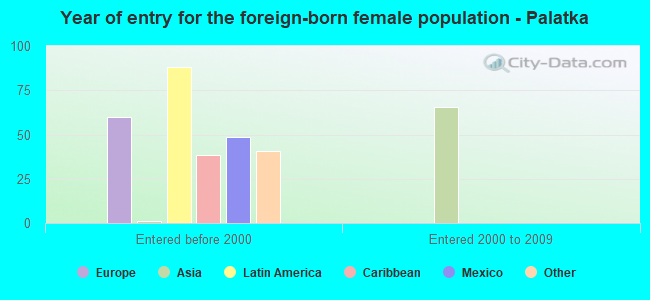
Foreign-born residents in Palatka
471 residents are foreign born (1.6% Latin America, 1.1% Europe, 1.1% Asia).
| This city: | 4.4% |
| Florida: | 21.1% |
Marital status for residents in Palatka
Marital status - White (Caucasian) population 15 years and over
- Males
- 48.9%Never married
- 33.6%Now married
- 2.0%Separated
- 3.7%Widowed
- 11.8%Divorced
- Females
- 25.5%Never married
- 25.1%Now married
- 1.7%Separated
- 23.5%Widowed
- 24.1%Divorced
Women who gave birth in the past 12 months
| Now married: | 14.9% (23) |
| Unmarried: | 85.1% (134) |
Women who did not give birth in the past 12 months
| Now married: | 33.3% (255) |
| Unmarried: | 66.7% (513) |
Marital status - Black or African American population 15 years and over
- Males
- 58.4%Never married
- 11.6%Now married
- 10.5%Separated
- 4.9%Widowed
- 14.7%Divorced
- Females
- 52.3%Never married
- 13.7%Now married
- 4.1%Separated
- 15.0%Widowed
- 14.9%Divorced
Women who gave birth in the past 12 months
| Now married: | 0.0% (0) |
| Unmarried: | 100.0% (66) |
Women who did not give birth in the past 12 months
| Now married: | 12.0% (92) |
| Unmarried: | 88.0% (676) |
Marital status - American Indian / Alaska Native population 15 years and over
- Males
- 0.0%Never married
- 0.0%Now married
- 0.0%Separated
- 0.0%Widowed
- 100.0%Divorced
- Females
- 0.0%Never married
- 57.7%Now married
- 42.3%Separated
- 0.0%Widowed
- 0.0%Divorced
Women who did not give birth in the past 12 months
| Now married: | 100.0% (43) |
| Unmarried: | 0.0% (0) |
Marital status - Asian population 15 years and over
- Males
- 53.5%Never married
- 46.5%Now married
- 0.0%Separated
- 0.0%Widowed
- 0.0%Divorced
- Females
- 0.0%Never married
- 96.0%Now married
- 0.0%Separated
- 4.0%Widowed
- 0.0%Divorced
Women who gave birth in the past 12 months
| Now married: | 100.0% (5) |
| Unmarried: | 0.0% (0) |
Women who did not give birth in the past 12 months
| Now married: | 100.0% (69) |
| Unmarried: | 0.0% (0) |
Marital status - Two or more races population 15 years and over
- Males
- 46.8%Never married
- 31.0%Now married
- 0.0%Separated
- 0.0%Widowed
- 22.2%Divorced
- Females
- 58.7%Never married
- 32.9%Now married
- 0.0%Separated
- 0.0%Widowed
- 8.4%Divorced
Women who did not give birth in the past 12 months
| Now married: | 50.5% (77) |
| Unmarried: | 49.5% (75) |
Marital status - White alone, not Hispanic / Latino population 15 years and over
- Males
- 49.6%Never married
- 32.2%Now married
- 2.2%Separated
- 3.5%Widowed
- 12.6%Divorced
- Females
- 25.1%Never married
- 25.7%Now married
- 1.8%Separated
- 22.8%Widowed
- 24.5%Divorced
Women who gave birth in the past 12 months
| Now married: | 14.9% (25) |
| Unmarried: | 85.1% (143) |
Women who did not give birth in the past 12 months
| Now married: | 33.3% (272) |
| Unmarried: | 66.7% (546) |
Marital status - Hispanic or Latino population 15 years and over
- Males
- 39.8%Never married
- 40.7%Now married
- 0.0%Separated
- 2.2%Widowed
- 17.3%Divorced
- Females
- 63.1%Never married
- 22.7%Now married
- 0.0%Separated
- 13.3%Widowed
- 0.9%Divorced
Women who did not give birth in the past 12 months
| Now married: | 39.5% (53) |
| Unmarried: | 60.5% (81) |
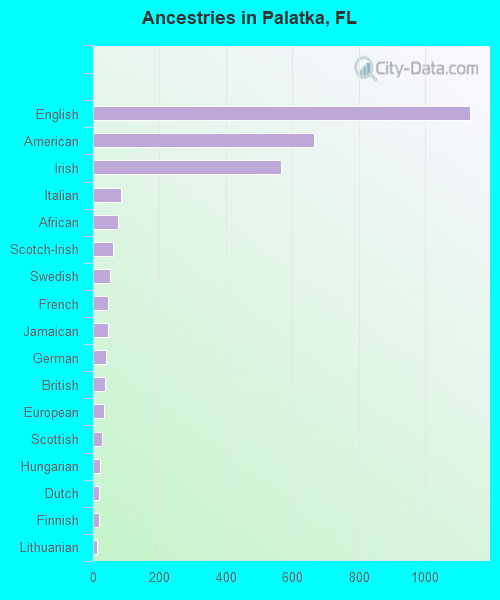
Ancestries in Palatka

- 1,13615.7%English
- 6679.2%American
- 5667.8%Irish
- 851.2%Italian
- 761.1%African
- 590.8%Scotch-Irish
- 500.7%Swedish
- 450.6%French
- 440.6%Jamaican
- 380.5%German
- 370.5%British
- 340.5%European
- 270.4%Scottish
- 220.3%Hungarian
- 190.3%Dutch
- 190.3%Finnish
- 130.2%Lithuanian
- 100.1%Polish
- 80.1%French Canadian
- 70.10%Brazilian
- 60.08%Russian
- 10.01%Haitian
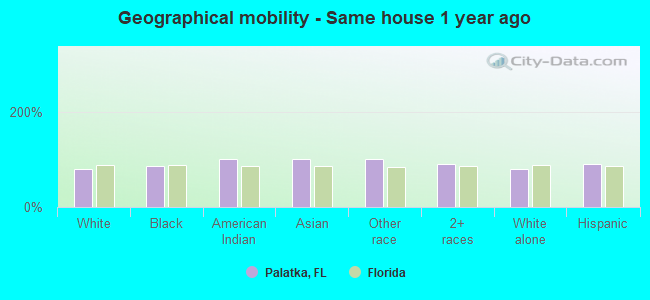
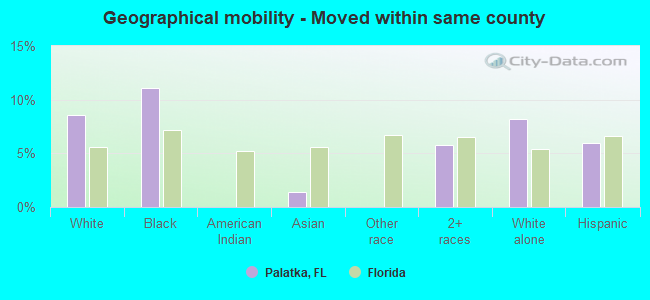
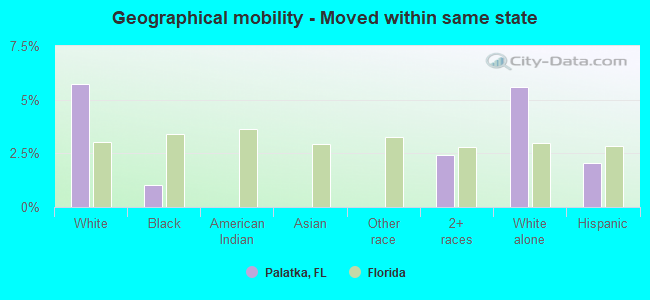
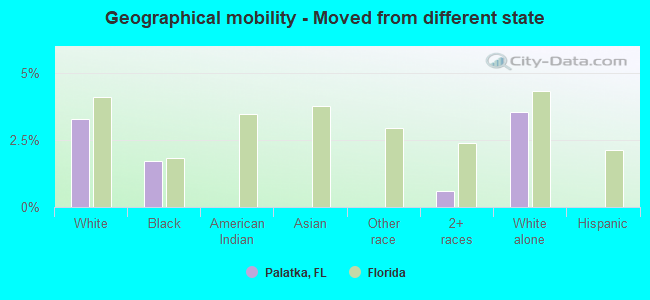
Geographical mobility in Palatka

- Same house 1 year ago
- 3,96878.9%White (Caucasian)
- 3,49085.3%Black or African American
- 109100.0%American Indian / Alaska Native
- 12399.5%Asian
- 24100.0%Other race
- 96890.7%Two or more races
- 3,91679.0%White alone, not Hispanic / Latino
- 74991.2%Hispanic or Latino
-
- Moved within same county
- 4308.6%White / Caucasian
- 45311.1%Black or African American
- 21.4%Asian
- 615.7%Two or more races
- 4078.2%White alone, not Hispanic / Latino
- 495.9%Hispanic or Latino
-
- Moved within same state
- 2895.7%White / Caucasian
- 421.0%Black or African American
- 262.4%Two or more races
- 2775.6%White alone, not Hispanic / Latino
- 172.0%Hispanic or Latino
-
- Moved from different state
- 1663.3%White / Caucasian
- 701.7%Black or African American
- 60.6%Two or more races
- 1753.5%White alone, not Hispanic / Latino
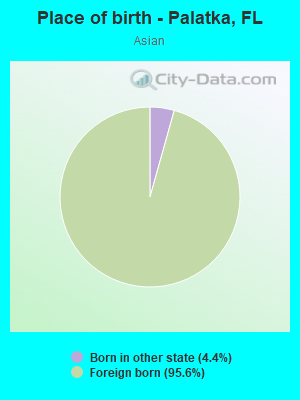
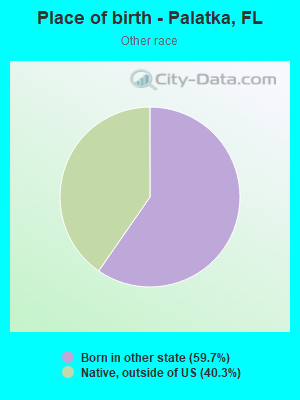
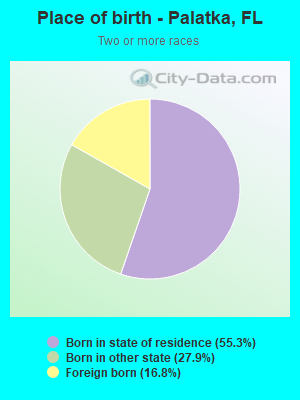
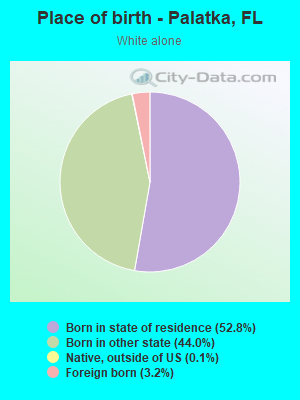
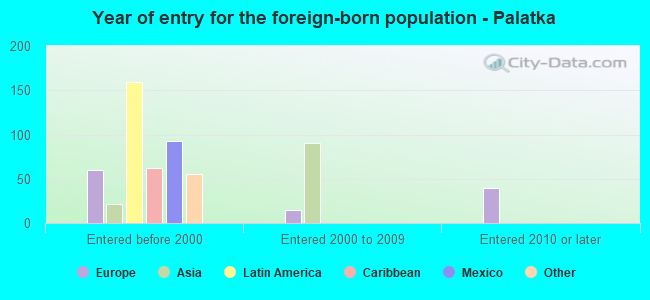
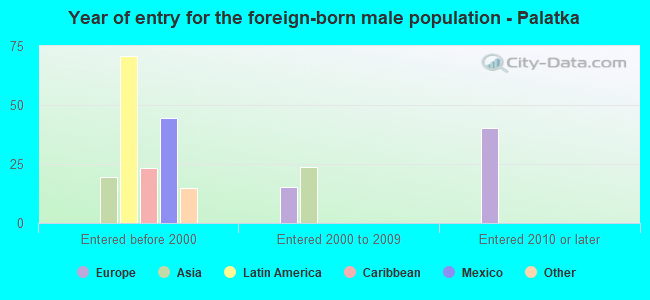
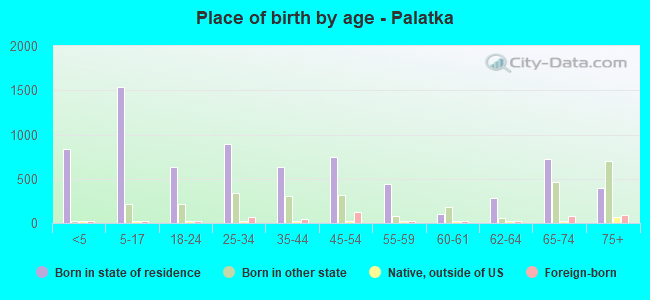
Children Nativity (place of birth) in Palatka
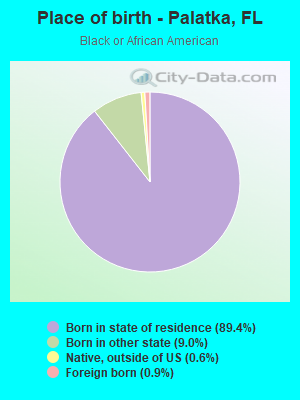
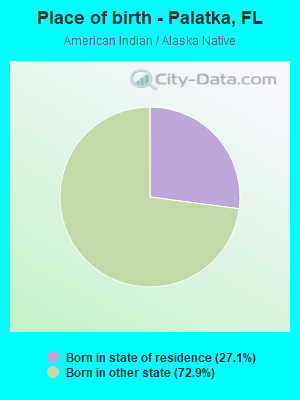
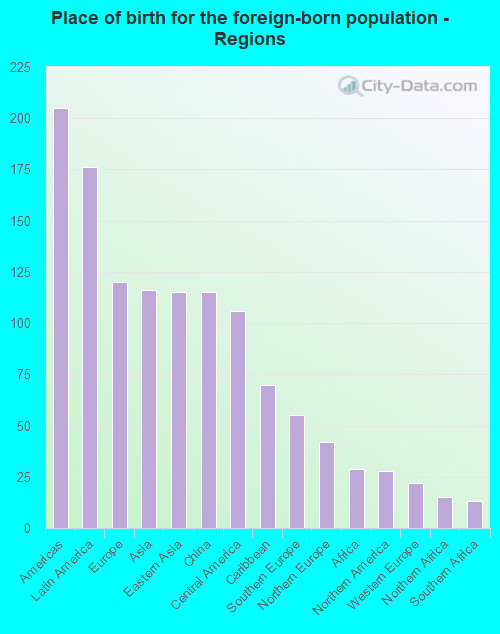
Place of birth for residents in Palatka
![Place of birth for the foreign-born population - Regions]()
- 205Americas
- 176Latin America
- 120Europe
- 116Asia
- 115Eastern Asia
- 115China
- 106Central America
- 70Caribbean
- 55Southern Europe
- 42Northern Europe
- 29Africa
- 28Northern America
- 22Western Europe
- 15Northern Africa
- 13Southern Africa
- 1South Eastern Asia
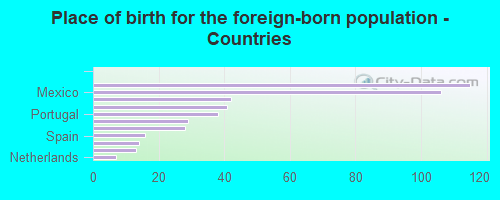
![Place of birth for the foreign-born population - Countries]()
- 115China
- 106Mexico
- 42England
- 41Jamaica
- 38Portugal
- 29Cuba
- 28Canada
- 16Spain
- 14Germany
- 13South Africa
- 7Netherlands
- 1Philippines
Grandparents responsible for own grandchildren in Palatka
Zip codes: 32177.